. 2012 Apr;108(4):419-30.
doi: 10.1038/hdy.2011.92. Epub 2011 Oct 19.

Proteomic divergence in Arabidopsis autopolyploids and allopolyploids and their progenitors

Affiliations

Proteomic divergence in Arabidopsis autopolyploids and allopolyploids and their progenitors

D W-K Ng et al. Heredity (Edinb). 2012 Apr.

Abstract

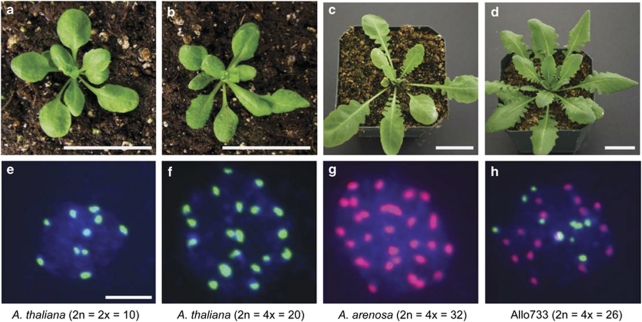
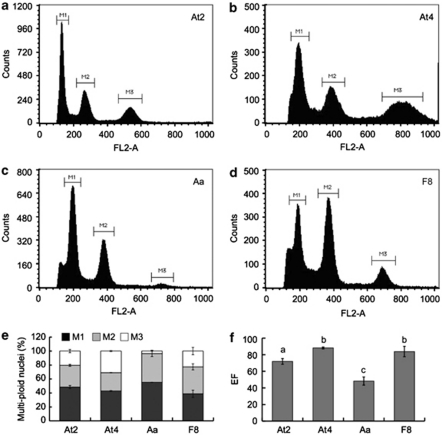
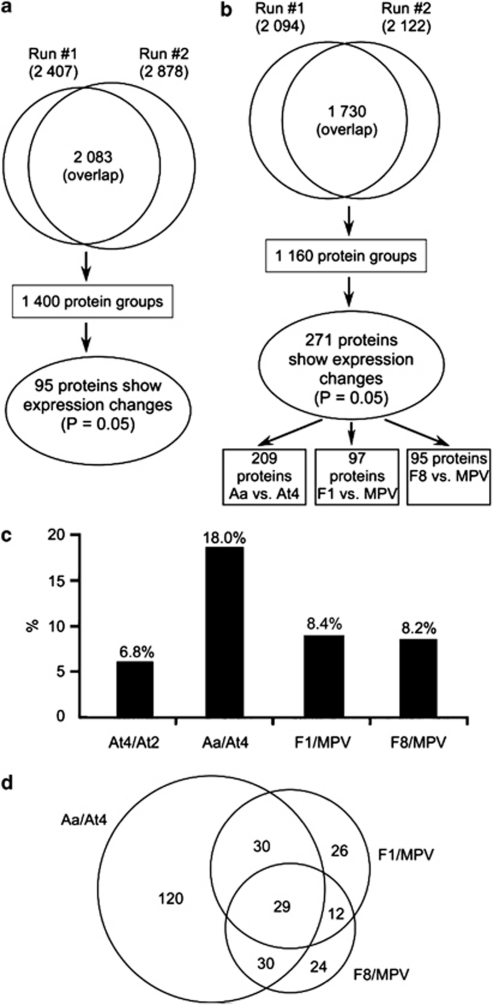
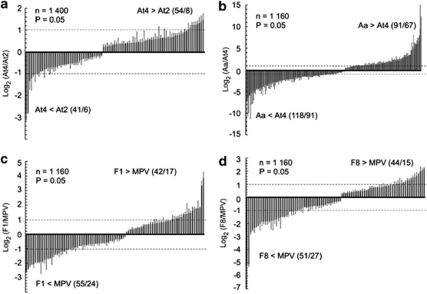
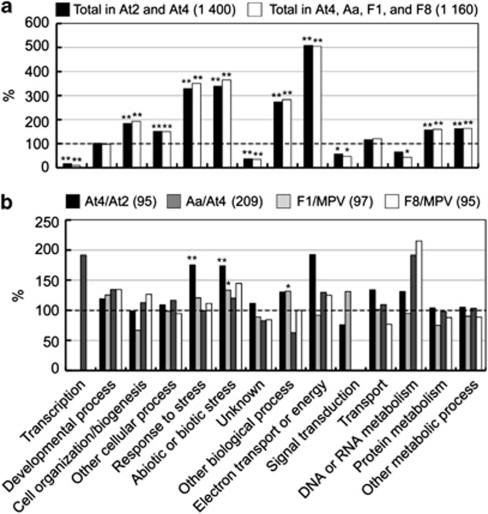
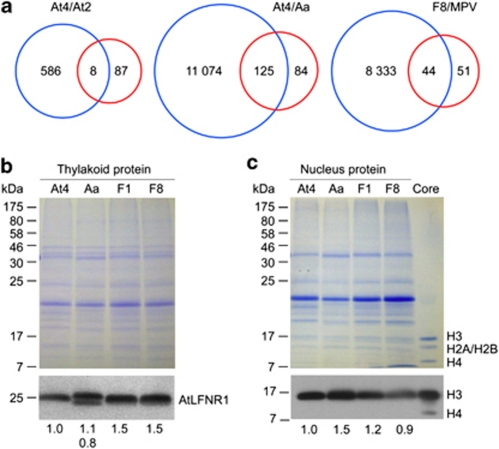
Autopolyploidy and allopolyploidy are common in many plants and some animals. Rapid changes in genomic composition and gene expression have been observed in both autopolyploids and allopolyploids, but the effects of polyploidy on proteomic divergence are poorly understood. Here, we report quantitative analysis of protein changes in leaves of Arabidopsis autopolyploids and allotetraploids and their progenitors using isobaric tags for relative and absolute quantitation (iTRAQ) coupled with mass spectrometry. In more than 1000 proteins analyzed, the levels of protein divergence were relatively high (~18%) between Arabidopsis thaliana and Arabidopsis arenosa, relatively low (~6.8%) between an A. thaliana diploid and autotetraploid and intermediate (~8.3 and 8.2%) in F(1)- and F(8)-resynthesized allotetraploids relative to mid-parent values, respectively. This pattern of proteomic divergence was consistent with the previously reported gene expression data. In particular, many non-additively accumulated proteins (61-62%) in the F(1) and F(8) allotetraploids were also differentially expressed between the parents. The differentially accumulated proteins in functional categories of abiotic and biotic stresses were overrepresented between an A. thaliana autotetraploid and diploid and between two Arabidopsis species, but not significantly different between allotetraploids and their progenitors. Although the trend of changes is similar, the percentage of differentially accumulated proteins that matched previously reported differentially expressed genes was relatively low. Western blot analysis confirmed several selected proteins with isoforms the cumulative levels of which were differentially expressed. These data suggest high protein divergence between species and rapid changes in post-transcriptional regulation and translational modifications of proteins during polyploidization.


Figures

Figure 1
Figure 1
Plant materials and fluorescence in situ hybridization (FISH). (a, e) Arabidopsis thaliana (Ler) diploid (At2; 2n=2x=10). (b, f) A. thaliana autotetraploid (At4; 2n=4x=20). (c, g) Arabidopsis arenosa autotetraploid (Aa; 2n=4x=32). (d, h) Resynthesized allotetraploid (Allo733F8; 2n=4x=26) derived from A. thaliana and A. arenosa. Fluorescein-labeled (green) and Texas red-labeled (Red) probes were used to detect At and Aa centromeric repeats, respectively. Bars=5 μ (panels ad) and 4 cm (panels eh).
Figure 2
Figure 2
Flow-cytometric analysis of endopolyploidy in mature leaves of different Arabidopsis lines. (ad) Flow-cytometry histograms of gated nuclei fluorescence detected using the FL2 (480 nm) photodetector (FL2-A) using mature leaves of an A. thaliana diploid (panel a), A. thaliana autotetraploid (panel b), A. arenosa tetraploid (panel c) and allotetraploid Allo733 in the F8 generation (Allo733F8) (panel d). Markers (M1 to M3) indicate 0, 1 and 2 endoreduplication events, respectively. (e) The proportion of cell ploidy levels (n=3). M1, M2 and M3 represent 2C, 4C, 8C nuclei in a diploid, respectively, and 4C, 8C and 16C nuclei in a tetraploid, respectively. (f) The endoreduplication factor (EF) represents the average endocycles per 100 cells (n=3) in the 4 lines examined. Error bars indicate s.e. The significance levels (P⩽0.05) are shown as ‘a, b and c' in multiple comparison tests.
Figure 3
Figure 3
Use of iTRAQ strategy for analysis of proteome divergence and non-additive accumulation in Arabidopsis-related species. (a) Proteome comparison between A. thaliana (Ler) diploids (At2) and autotetraploids (At4). (b) Proteome comparison between A. thaliana autotetraploids (At4), A. arenosa autotetraploids (Aa) and their allotetraploid hybrids in the F1 and F8 generations. Two LC-MS/MS runs were performed for each comparison. Proteins identified in both runs (overlap) were used for expression divergence analysis. Proteins sharing the same peptides were assigned to a protein group, and the protein with the highest identification score designated as the group leader for proteomic comparisons among all Arabidopsis species. Protein expression differences were determined using a significance level of P⩽0.05 within each comparison. MPV, mid-parent value (½ At4 + ½ Aa). (c) Percentage of proteins showing expression divergence between A. thaliana (Ler) diploids (At2) and tetraploids (At4), A. thaliana and A. arenosa tetraploids (Aa/At4), and resynthesized F1 and stable (F8, Allo733F8) allotetraploids and the MPV (½ At4 + ½ Aa). (d) Venn diagram showing the number of differentially accumulated proteins between Aa and At4 and non-additively accumulated proteins between F1 or F8 allotetraploids and the MPV.
Figure 4
Figure 4
Protein expression changes in Arabidopsis autotetraploids and allotetraploids and their progenitors. Histograms showing expression levels (in log2 scale) of differentially expressed proteins between (a) A. thaliana diploids and autotetraploids; (b) A. arenosa and A. thaliana tetraploids; (c) F1-resynthesized allotetraploids and the MPV; and (d) F8-resynthesized allotetraploids (Allo733F8) and the MPV. The number of downregulated or upregulated proteins is showed in parenthesis. Error bars showed the s.d. of the log ratio. Dashed lines mark the ±2-fold change levels, respectively. MPV: mid-parent value. Total numbers of differentially expressed proteins over those with ±2-fold changes are shown in parentheses.
Figure 5
Figure 5
Gene ontology categorization of identified proteins in Arabidopsis-related species. (a) Total proteins identified by iTRAQ LC-MS/MS analysis were grouped into 14 biological process categories. The percentage of proteins identified in each category was compared with that in the corresponding category of the entire A. thaliana genome (dashed line=average or 100%). (b) The percentage distribution of differentially or non-additively accumulated proteins in A. thaliana (At2, At4), A. arenosa and resynthesized allotetraploids (F1 and F8 generations). The percentage distribution was compared with that of total proteins detected by iTRAQ analysis (dashed line=average or 100%). MPV: mid-parent value. Significant GO enrichments with P⩽0.05 and P⩽0.01 were denoted by ‘*' and ‘**', respectively.
Figure 6
Figure 6
Comparison and validation of proteomic and transcriptomic data. (a) Venn diagrams showing the number of differentially or non-additively expressed proteins in comparison with transcript divergence using per-gene variance in the microarray study (Wang et al., 2006b). (b, c) Validation of protein expression data. (Panel b) Total leaf thylakoid proteins (20 μg) extracts from At4, Aa, F1, F8 were resolved in a 15% Urea-SDS-PAGE for subsequent western blot analysis using antibodies against AtLFNR1. (Panel c) The nucleus proteins (20 μg) were prepared from the same plant materials as shown in panel b and used for western blot analysis using the antibodies against histone H3 C terminus. Core histones (1 μg) were also included as a positive control. Coomassie blue-stained gels were shown as loading controls.

References

    1. Albertin W, Alix K, Balliau T, Brabant P, Davanture M, Malosse C, et al. Differential regulation of gene products in newly synthesized Brassica napus allotetraploids is not related to protein function nor subcellular localization. BMC Genomics. 2007;8:56. - PMC - PubMed
    1. Albertin W, Balliau T, Brabant P, Chevre AM, Eber F, Malosse C, et al. Numerous and rapid nonstochastic modifications of gene products in newly synthesized Brassica napus allotetraploids. Genetics. 2006;173:1101–1113. - PMC - PubMed
    1. Albertin W, Brabant P, Catrice O, Eber F, Jenczewski E, Chevre AM, et al. Autopolyploidy in cabbage (Brassica oleracea L.) does not alter significantly the proteomes of green tissues. Proteomics. 2005;5:2131–2139. - PubMed
    1. Albertin W, Langella O, Joets J, Negroni L, Zivy M, Damerval C, et al. Comparative proteomics of leaf, stem, and root tissues of synthetic Brassica napus. Proteomics. 2009;9:793–799. - PubMed
    1. Andreyev AY, Shen Z, Guan Z, Ryan A, Fahy E, Subramaniam S, et al. Application of proteomic marker ensembles to subcellular organelle identification. Mol Cell Proteomics. 2010;9:388–402. - PMC - PubMed

Publication types

LinkOut - more resources