

Real-time imaging of perivascular transport of nanoparticles during convection-enhanced delivery in the rat cortex
- PMID: 22009318
- PMCID: PMC3288849
- DOI: 10.1007/s10439-011-0440-0
Real-time imaging of perivascular transport of nanoparticles during convection-enhanced delivery in the rat cortex
Abstract
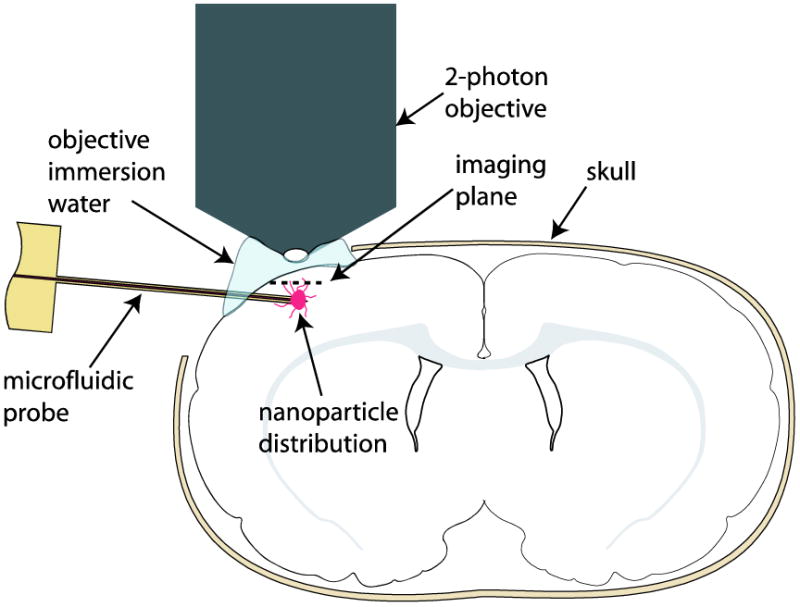
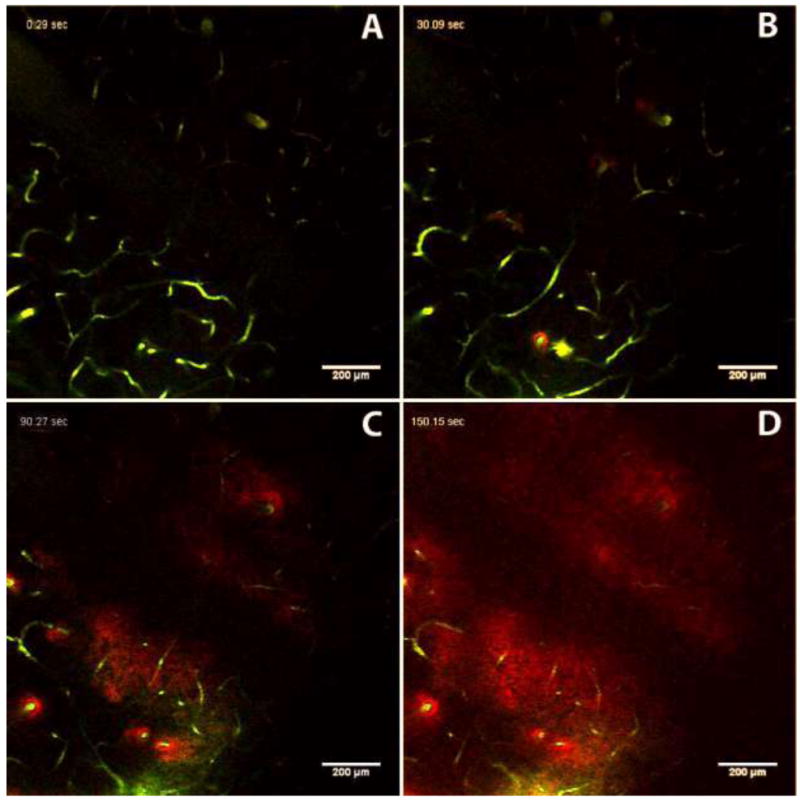
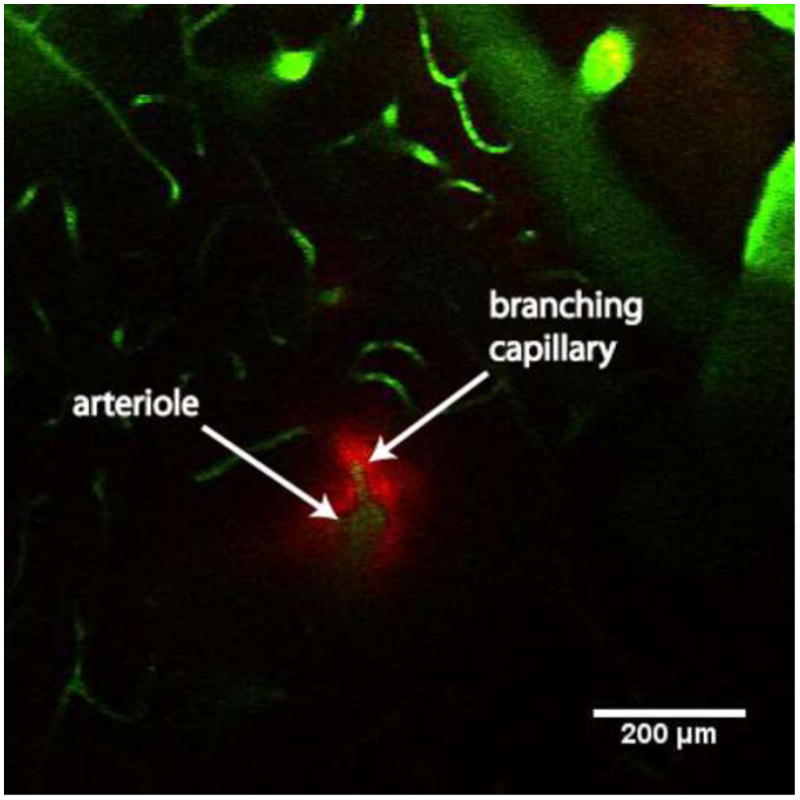
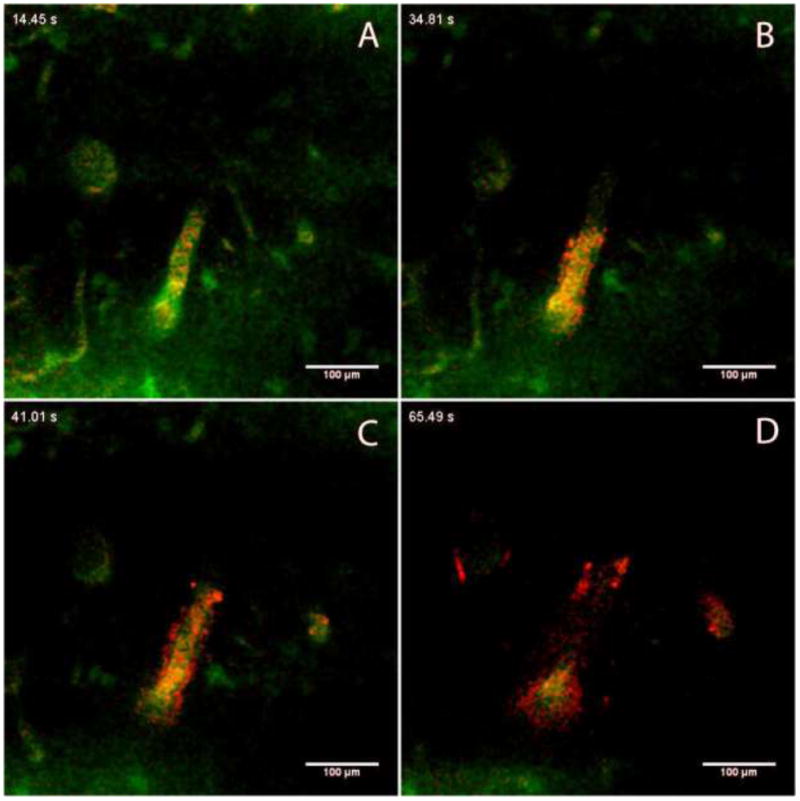
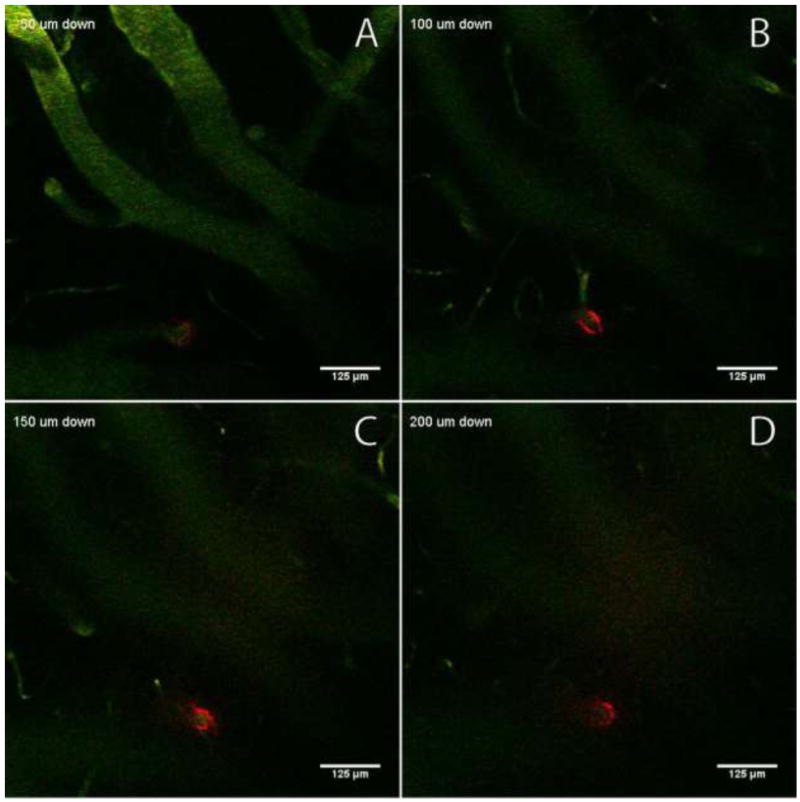
Convection-enhanced delivery (CED) is a promising technique for administering large therapeutics that do not readily cross the blood brain barrier to neural tissue. It is of vital importance to understand how large drug constructs move through neural tissue during CED to optimize construct and delivery parameters so that drugs are concentrated in the targeted tissue, with minimal leakage outside the targeted zone. Experiments have shown that liposomes, viral vectors, high molecular weight tracers, and nanoparticles infused into neural tissue localize in the perivascular spaces of blood vessels within the brain parenchyma. In this work, we used two-photon excited fluorescence microscopy to monitor the real-time distribution of nanoparticles infused in the cortex of live, anesthetized rats via CED. Fluorescent nanoparticles of 24 and 100 nm nominal diameters were infused into rat cortex through microfluidic probes. We found that perivascular spaces provide a high permeability path for rapid convective transport of large nanoparticles through tissue, and that the effects of perivascular spaces on transport are more significant for larger particles that undergo hindered transport through the extracellular matrix. This suggests that the vascular topology of the target tissue volume must be considered when delivering large therapeutic constructs via CED.
Figures
Similar articles
-
Dilation and degradation of the brain extracellular matrix enhances penetration of infused polymer nanoparticles.Brain Res. 2007 Nov 14;1180:121-32. doi: 10.1016/j.brainres.2007.08.050. Epub 2007 Aug 29. Brain Res. 2007. PMID: 17920047 Free PMC article.
-
The "perivascular pump" driven by arterial pulsation is a powerful mechanism for the distribution of therapeutic molecules within the brain.Mol Ther. 2006 Jul;14(1):69-78. doi: 10.1016/j.ymthe.2006.02.018. Epub 2006 May 2. Mol Ther. 2006. PMID: 16650807 Free PMC article.
-
Strategies to enhance the distribution of nanotherapeutics in the brain.J Control Release. 2017 Dec 10;267:232-239. doi: 10.1016/j.jconrel.2017.07.028. Epub 2017 Jul 21. J Control Release. 2017. PMID: 28739449 Free PMC article.
-
Convective diffusion of nanoparticles from the epithelial barrier toward regional lymph nodes.Adv Colloid Interface Sci. 2013 Nov;199-200:23-43. doi: 10.1016/j.cis.2013.06.002. Epub 2013 Jun 10. Adv Colloid Interface Sci. 2013. PMID: 23859221 Free PMC article. Review.
-
Convection-enhanced delivery to the central nervous system.J Neurosurg. 2015 Mar;122(3):697-706. doi: 10.3171/2014.10.JNS14229. Epub 2014 Nov 14. J Neurosurg. 2015. PMID: 25397365 Review.
Cited by
-
Current Status of Brain Tumor in the Kingdom of Saudi Arabia and Application of Nanobiotechnology for Its Treatment: A Comprehensive Review.Life (Basel). 2021 May 5;11(5):421. doi: 10.3390/life11050421. Life (Basel). 2021. PMID: 34063122 Free PMC article. Review.
-
Voxelized computational model for convection-enhanced delivery in the rat ventral hippocampus: comparison with in vivo MR experimental studies.Ann Biomed Eng. 2012 Sep;40(9):2043-58. doi: 10.1007/s10439-012-0566-8. Epub 2012 Apr 25. Ann Biomed Eng. 2012. PMID: 22532321 Free PMC article.
-
A holistic approach to targeting disease with polymeric nanoparticles.Nat Rev Drug Discov. 2015 Apr;14(4):239-47. doi: 10.1038/nrd4503. Epub 2015 Jan 19. Nat Rev Drug Discov. 2015. PMID: 25598505 Free PMC article. Review.
-
Investigation of Antibody Pharmacokinetics in the Brain Following Intra-CNS Administration and Development of PBPK Model to Characterize the Data.AAPS J. 2024 Mar 5;26(2):29. doi: 10.1208/s12248-024-00898-7. AAPS J. 2024. PMID: 38443635
-
Perivascular network segmentations derived from high-field MRI and their implications for perivascular and parenchymal mass transport in the rat brain.Sci Rep. 2023 Jun 6;13(1):9205. doi: 10.1038/s41598-023-34850-0. Sci Rep. 2023. PMID: 37280246 Free PMC article.
References
-
- Abramoff MD, Magelhaes PJ, Ram SJ. Image Processing with Image. J Biophotonics International. 2004;11:36–42.
-
- Bezemer JM, Grijpma DW, Dijkstra PJ, van Blitterswijk CA, Feijen J. A controlled release system for proteins based on poly(ether ester) block-copolymers: polymer network characterization. J Control Release. 1999;62:393–405. - PubMed
-
- Carare RO, Bernardes-Silva M, Newman TA, Page AM, Nicoll JAR, Perry VH, Weller RO. Solutes, but not cells, drain from the brain parenchyma along basement membranes of capillaries and arteries: significance for cerebral amyloid angiopathy and neuroimmunology. Neuropathol Appl Neurobiol. 2008;34:131–144. - PubMed
-
- Cserr HF, Ostrach LH. Bulk flow of interstitial fluid after intracranial injection of blue dextran 2000. Exp Neurol. 1974;45:50–60. - PubMed
Publication types
MeSH terms
Substances
Grants and funding
LinkOut - more resources
Full Text Sources
Other Literature Sources
