. 2011 Dec 9;286(49):42051-42062.
doi: 10.1074/jbc.M111.300541. Epub 2011 Oct 17.

The chromatin-binding protein HMGN1 regulates the expression of methyl CpG-binding protein 2 (MECP2) and affects the behavior of mice

Affiliations

The chromatin-binding protein HMGN1 regulates the expression of methyl CpG-binding protein 2 (MECP2) and affects the behavior of mice

Liron Abuhatzira et al. J Biol Chem. .

Abstract

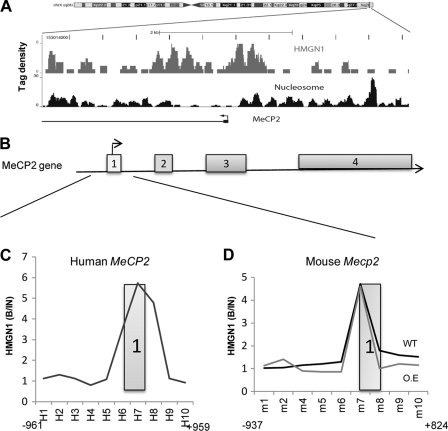
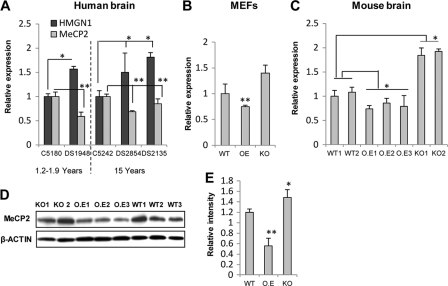
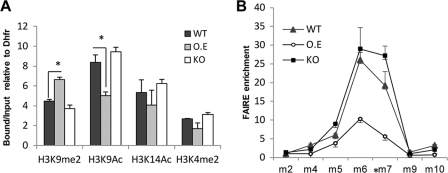
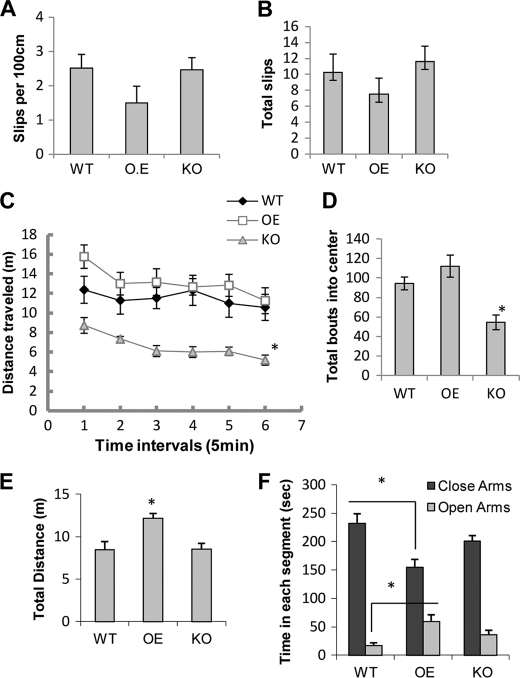
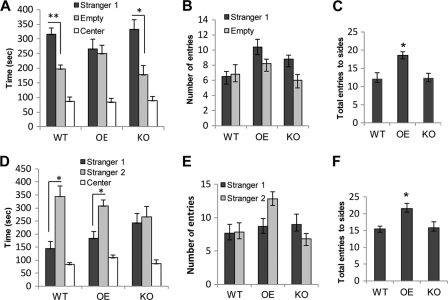
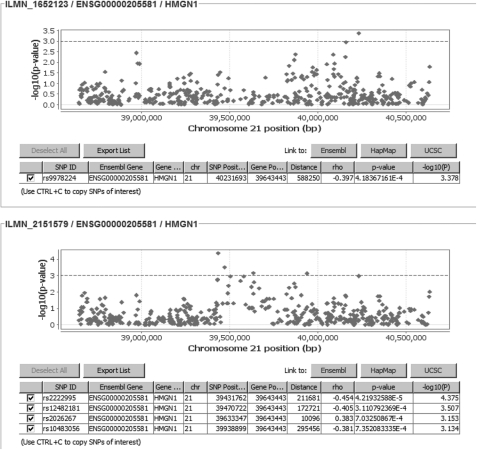
High mobility group N1 protein (HMGN1), a nucleosomal-binding protein that affects the structure and function of chromatin, is encoded by a gene located on chromosome 21 and is overexpressed in Down syndrome, one of the most prevalent genomic disorders. Misexpression of HMGN1 affects the cellular transcription profile; however, the biological function of this protein is still not fully understood. We report that HMGN1 modulates the expression of methyl CpG-binding protein 2 (MeCP2), a DNA-binding protein known to affect neurological functions including autism spectrum disorders, and whose alterations in HMGN1 levels affect the behavior of mice. Quantitative PCR and Western analyses of cell lines and brain tissues from mice that either overexpress or lack HMGN1 indicate that HMGN1 is a negative regulator of MeCP2 expression. Alterations in HMGN1 levels lead to changes in chromatin structure and histone modifications in the MeCP2 promoter. Behavior analyses by open field test, elevated plus maze, Reciprocal Social Interaction, and automated sociability test link changes in HMGN1 levels to abnormalities in activity and anxiety and to social deficits in mice. Targeted analysis of the Autism Genetic Resource Exchange genotype collection reveals a non-random distribution of genotypes within 500 kbp of HMGN1 in a region affecting its expression in families predisposed to autism spectrum disorders. Our results reveal that HMGN1 affects the behavior of mice and suggest that epigenetic changes resulting from altered HMGN1 levels could play a role in the etiology of neurodevelopmental disorders.


Figures

FIGURE 1.
FIGURE 1.
HMGN1 binds to the promoter of MeCP2 in both human and mouse. A, nucleosome position and HMGN1 binding in the MeCP2 promoter of human CD4+ T cells was determined by ChIP sequencing. Tag density indicates the number of adjusted reads in 10-bp windows. Data were obtained from Cuddapah et al. (22). B, shown is a schematic presentation of the MeCP2 gene. Boxes represent exons. C and D, identification of the HMGN1 binding site in human and mouse brain tissue by ChIP in the regulatory region overlapping the transcription start site present in exon 1 is shown. The boxed region represents exon #1. The genomic regions amplified, denoted as H for human and m for mouse, are listed in supplemental Table S1, a and b. Values are the averages of 3 different samples from each group. Shown is the ratio of bound/input (B/IN), normalized to APRT or Dhfr.
FIGURE 2.
FIGURE 2.
HMGN1 is a negative regulator of MeCP2 expression. A, shown are relative transcript levels of HMGN1 and MeCP2 in brain tissue from DS patients and age-matched controls (C) normalized to glucose-6-phosphate dehydrogenase (G6PD). The ages of the sample donors are indicated. *, p value<0.05; **, p value<0.02. B, shown are Mecp2 transcript levels in MEFs from WT mice, primary MEFs isolated from Hmgn1−/− mice (KO), and MEFs stably transfected with a vector overexpressing HMGN1 (OE) normalized to Dhfr. *, p value <0.003. C, Mecp2 transcript levels in brain tissue of wild type (WT), HMGN1 overexpressing (OE), and Hmgn1−/− (KO) mice relative to β-actin. *, p values <0.01; error bars represent S.D. D, shown is a representative Western blot depicting MeCP2 protein levels in brain extracts of wild type (WT), HMGN1 overexpressing (OE), and in Hmgn1−/− (KO) mice. E, relative levels of MeCP2 protein in mice brain extracts were quantified by Image J and adjusted to the relative intensity of β-actin for each sample. Values are the averages of three different samples from each group and two different blots. Error bars represent S.D. *, p value<0.05; **, p value<0.003.
FIGURE 3.
FIGURE 3.
HMGN1 affects the chromatin structure of the MeCP2 promoter region. A, ChIP analysis of the effect of HMGN1 on histone modifications at its binding site on the Mecp2 promoter (m7 in Fig. 1D) in mice brain is shown. Values are the averages of three different samples from each group. Shown is the ratio of bound/input, normalized to Dhfr. B, FAIRE analysis of HMGN1-mediated changes at the Mecp2 promoter in mice brain. The regions amplified by the primers used are in supplemental Table S1b. Values are the averages of two experiments, normalized to m2, which gave the lowest enrichment values. Error bars represent S.D. OE, HMGN1 overexpressing; KO, Hmgn1−/− mice.
FIGURE 4.
FIGURE 4.
Aberrant expression of HMGN1 affects the activity levels and anxiety in mice. A and B, parallel bar task is shown. Shown are the average number of foot slips per 100 cm traveled and the total number of slips during 5 min of testing. C, open field test is shown. Shown is the distance traveled in consecutive 5-min intervals. The difference between the Hmgn1−/− and control mice is significant throughout all time intervals; *, p < 0.001. D, open field test is shown. Average total entries (bouts) into the center of arena during 30 min are shown. *, p < 0.001. E, elevated plus maze is shown. Average total distance traveled in all arms of the maze during 5 min. *, p < 0.005. F, elevated plus maze is shown. Average time spent in either the closed or open arms of the maze. *, p < 0.005. In all experiments eight age-matched male mice were tested in each group; bars represent S.E. OE, HMGN1 overexpressing; KO, Hmgn1−/− mice.
FIGURE 5.
FIGURE 5.
HMGN1 levels affect sociability and social memory in mice. A–C, automated sociability test, stage 1, is shown. A, shown is the total time spent in each of the 3 chambers. *, p < 0.01; **, p < 0.001. B, shown is the average number of entries to each of the two side chambers. C, shown is the total sum of entries to both side chambers throughout the test. *, p value<0.01. D–F, shown is the automated sociability test, stage 2. D, total time spent in each of the three chambers is shown. *p < 0.01. E, shown is the average number of entries to each of the 2 side chambers. F, total sum of entries to both side chambers throughout the test is shown. Bars represent S.E. *, p value <0.007. In all experiments eight age-matched male mice were tested in each group; bars represent S.E. OE, HMGN1 overexpressing; KO, Hmgn1−/− mice.
FIGURE 6.
FIGURE 6.
Scatter plot representing observed eQTLs associated with a variation in expression of HMGN1, located approximately at position 39,640,000 bp in human chromosome 21. Shown is the screen capture of Genevar results obtained by a search for SNPs (eQTLs) associated with a variation in expression of HMGN1. The top panel presents the results obtained with probe ILMN_1652123, which is associated with SNP rs9978224, whereas the bottom panel represents the results obtained with probe ILMN_2151579, which is associated with SNPs rs2222995, rs12482181, rs2026267, and rs104830556. Note that rs2222995 and rs12482181 were genotyped in the AGRE dataset and are in the region where there is an excess of homozygous runs among the unaffected individuals.

References

    1. Kugathasan S., Baldassano R. N., Bradfield J. P., Sleiman P. M., Imielinski M., Guthery S. L., Cucchiara S., Kim C. E., Frackelton E. C., Annaiah K., Glessner J. T., Santa E., Willson T., Eckert A. W., Bonkowski E., Shaner J. L., Smith R. M., Otieno F. G., Peterson N., Abrams D. J., Chiavacci R. M., Grundmeier R., Mamula P., Tomer G., Piccoli D. A., Monos D. S., Annese V., Denson L. A., Grant S. F., Hakonarson H. (2008) Nat. Genet. 40, 1211–1215 - PMC - PubMed
    1. Scherr R., Essers J., Hakonarson H., Kugathasan S. (2009) Dig. Dis. 27, 236–239 - PubMed
    1. Dubinsky M. C., Mei L., Friedman M., Dhere T., Haritunians T., Hakonarson H., Kim C., Glessner J., Targan S. R., McGovern D. P., Taylor K. D, Rotter J. I. (2010) Inflamm. Bowel Dis. 16, 1357–1366 - PMC - PubMed
    1. Murata K., Degmetich S., Kinoshita M., Shimada E. (2009) Dev. Growth Differ. 51, 95–107 - PubMed
    1. Bustin M., Trieschmann L., Postnikov Y. V. (1995) Semin Cell Biol. 6, 247–255 - PubMed

Publication types

LinkOut - more resources