. 2011 Dec 16;286(50):43045-53.
doi: 10.1074/jbc.M111.252544. Epub 2011 Oct 18.

The composition of plant mitochondrial supercomplexes changes with oxygen availability

Affiliations

The composition of plant mitochondrial supercomplexes changes with oxygen availability

Santiago J Ramírez-Aguilar et al. J Biol Chem. .

Abstract

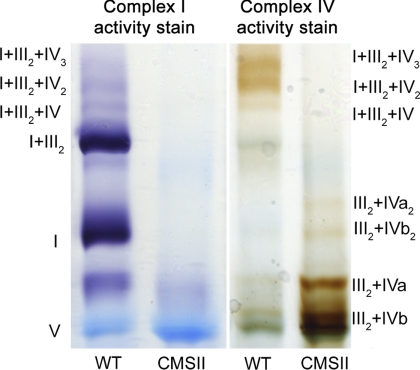
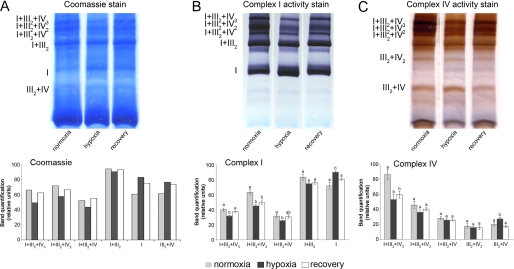
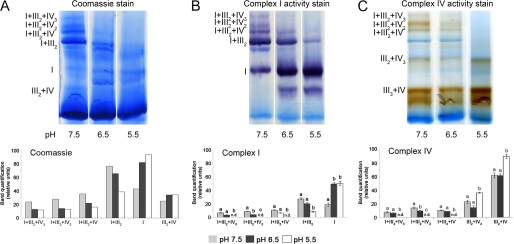
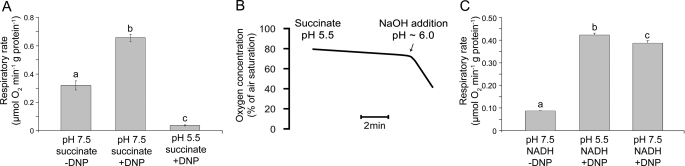
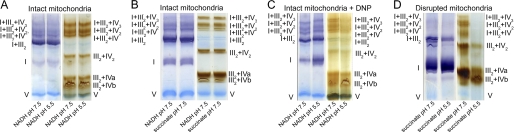
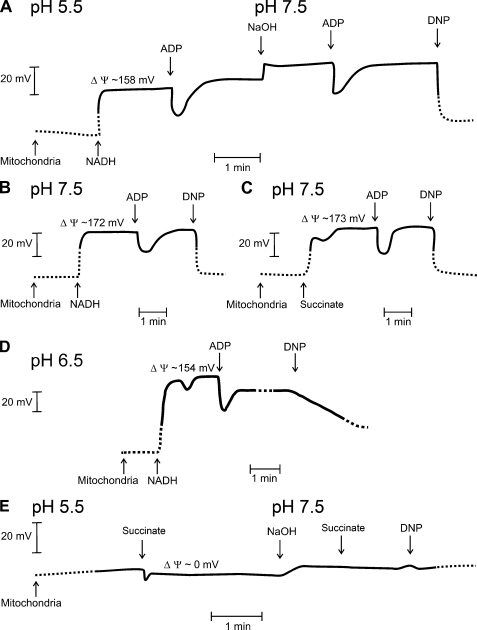
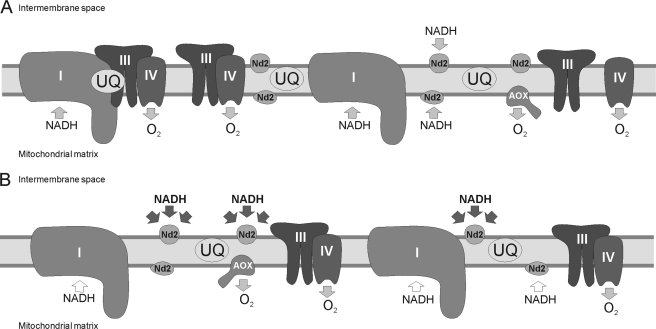
Respiratory supercomplexes are large protein structures formed by various enzyme complexes of the mitochondrial electron transport chain. Using native gel electrophoresis and activity staining, differential regulation of complex activity within the supercomplexes was investigated. During prolonged hypoxia, complex I activity within supercomplexes diminished, whereas the activity of the individual complex I-monomer increased. Concomitantly, an increased activity was observed during hypoxia for complex IV in the smaller supercomplexes that do not contain complex I. These changes in complex activity within supercomplexes reverted again during recovery from the hypoxic treatment. Acidification of the mitochondrial matrix induced similar changes in complex activity within the supercomplexes. It is suggested that the increased activity of the small supercomplex III(2)+IV can be explained by the dissociation of complex I from the large supercomplexes. This is discussed to be part of a mechanism regulating the involvement of the alternative NADH dehydrogenases, known to be activated by low pH, and complex I, which is inhibited by low pH. It is concluded that the activity of complexes within supercomplexes can be regulated depending on the oxygen status and the pH of the mitochondrial matrix.


Figures

FIGURE 1.
FIGURE 1.
Supercomplex analysis of plants with altered levels of complex I. shown is activity staining of complex I and IV within supercomplexes isolated from N. sylvestris wild type (WT) and the CMSII mutant deficient in complex I. Additional determinations on biologically independent material are provided in supplemental Fig. S4.
FIGURE 2.
FIGURE 2.
Effect of hypoxia on respiratory supercomplexes. A, shown is blue native PAGE of supercomplexes from mitochondria that were isolated from potato tubers after 36 h of flooding-induced hypoxia ([O2] ≤ 10 μm) or from tubers that regenerated during 36 h in normal air from the hypoxic treatment. As the control, samples were prepared from tubers that were kept in normal air during the entire course of the experiment. The first three lanes (A) show Coomassie-stained proteins from mitochondria isolated from tubers after a normoxic, hypoxic (flooded), or recovery treatment, respectively. The second (B) and third sets (C) of three lanes show activity staining of complex I and complex IV, respectively. B, shown is quantification of color intensity of the bands stained for complex I activity. C, shown is quantification of color intensity of the bands stained for complex IV activity. Bars represent mean values ± S.E. of at least three technical replicates. Significant differences were determined using single-way analysis of variance (p ≤ 0.05), and mean values that are significantly different from each other were marked with different letters above the bars. The results from additional biological repetitions are provided in supplemental Figs. S5 and S6.
FIGURE 3.
FIGURE 3.
Effect of pH on supercomplex composition in mitochondria oxidizing succinate. A, proteins isolated from mitochondria that were pretreated at various pH in the presence of 10 mm succinate were separated on a BN-PAGE gel. The same protein extracts were used for staining with Coomassie, complex I, and complex IV activity. B, quantification of color intensity of the bands stained for complex I activity is shown. C, quantification of color intensity of the bands stained for complex IV activity is shown. Bars represent mean values ± S.E. of at least three technical replicates. Significantly different mean values as determined by a 2-way analysis of variance followed by the Holm-Sidak post hoc test are marked by different letters (n = 3, p ≤ 0.05). The results from additional biological repetitions are provided in supplemental Fig. S8.
FIGURE 4.
FIGURE 4.
The effect of various combinations of respiratory substrates and different pH on respiratory activity. A, shown is respiratory activity of isolated potato tuber mitochondria supplied with 750 μm ADP and either 4 mm NADH (pH 7.5), 10 mm succinate (pH 7.5), or 10 mm succinate (pH 5.5). B, oxygen consumption of isolated potato tuber mitochondria was determined at pH 5.5 in the presence of 10 mm succinate and 500 μm DNP. Subsequently, NaOH was added to increase the pH of the incubation buffer. At pH 6, the rate of respiration is indicated by the slope of the graph increased rapidly. C, respiratory activity is shown of isolated potato tuber mitochondria supplied with 4 mm NADH at pH 7.5 or 5.5 in the presence or absence of 250 μm DNP to activate state 3-respiration. Significantly different mean values as determined by a 2-way analysis of variance followed by the Holm-Sidak post hoc test are marked by different letters (n = 3, p ≤ 0.05).
FIGURE 5.
FIGURE 5.
The effect of various combinations of respiratory substrates and different pH values on supercomplex composition. A, blue native gels stained for the activity of complex I (left) and complex IV (right) within supercomplexes isolated from mitochondria were preincubated at either pH 5.5 or 7.5 for 10 min in a buffer containing 4 mm NADH and 750 μm ADP. B, shown is the effect of NADH or succinate at pH 7.5 on supercomplex composition. Activity staining of complex I (left) and complex IV (right) on supercomplexes isolated from mitochondria pretreated with either 750 μm ADP and 4 mm NADH or 10 mm succinate is shown. C, shown is the effect of DNP-induced membrane depolarization on the stability of supercomplexes at pH 5.5 and 7.5. Mitochondria were preincubated for 10 min in a buffer (pH 5.5 or 7.5) with 500 μm DNP, 4 mm NADH, and 750 μm ADP. D, determination of supercomplex stability in disrupted mitochondrial membranes is shown. Isolated potato tuber mitochondria were treated with a freeze-thaw cycle, and supercomplexes were isolated from the disrupted membranes. Complex activity within blue native gels was determined after preincubation of the mitochondria for 10 min in a buffer containing 10 mm succinate and 750 μm ADP at a pH of 5.5 or 7.5. Bar charts showing quantification data of the activity staining for the experiments shown in these figures as well as the results of biological replicate determinations are provided in the supplemental Figs. S9–S11.
FIGURE 6.
FIGURE 6.
Determination of the mitochondrial membrane potential. A, shown is determination of the membrane potential of potato tuber mitochondria via measuring changes in TPP+ accumulation. The initial pH of the incubation solution was 5.5. Subsequently, 50 μl of 160 mm NADH was added to the incubation solution (volume 2 ml) followed by 15 μl of 15 mm ADP, 3 μl of 10 m NaOH to increase the pH of the buffer to pH 7.3, 15 μl of 15 mm ADP, or DNP (final concentration of 500 μm). B, shown is determination of the membrane potential of isolated mitochondria in medium with pH 7.5 using 4 mm NADH as respiratory substrate. Subsequently, 15 μl of 15 mm ADP or DNP were added. C, shown is determination of the membrane potential of isolated mitochondria incubated at pH 7.5 using 10 mm succinate as the respiratory substrate. Subsequently, 15 μl of 15 mm ADP or DNP were added. D, shown is determination of the membrane potential of isolated mitochondria incubated at pH 6.5 using 4 mm NADH as respiratory substrate. Subsequently, 15 μl of 15 mm ADP or DNP were added. E, shown is determination of the membrane potential of mitochondria incubated in buffer (pH 5.5) with 10 mm succinate as respiratory substrate. Subsequently, the pH of the solution was adjusted to 7.5 using 4 μl of 10 m NaOH, and succinate (final concentration: 20 mm) and DNP were added. ΔΨ, membrane potential.
FIGURE 7.
FIGURE 7.
Model of the role of supercomplex formation for the channeling of electrons through the oxidative phosphorylation pathway. A, under standard conditions respirasomes as well as smaller supercomplexes and single complexes are observed simultaneously in the inner mitochondrial membrane. B, dissociation of complex I from the respirasomes supports electron transfer from cytosolic NAD(P)H into the mitochondrial electron transport chain via the external alternative dehydrogenases. Supercomplex dissociation can be induced by acidification of the cell and accumulation of organic acids such as it occurs during hypoxia. These same conditions were previously described to inhibit the enzyme activity of complex I and stimulate activity of the alternative dehydrogenases (–47). The shift from complex I to the alternative dehydrogenases would support oxidation of cytosolic NADH to keep the glycolytic flux upright when oxidative phosphorylation is reduced upon hypoxia. UQ, ubiquinone; Nd2, alternative NAD(P)H dehydrogenase; AOX, alternative oxidase.

References

    1. Schäfer E., Dencher N. A., Vonck J., Parcej D. N. (2007) Biochemistry 46, 12579–12585 - PubMed
    1. Eubel H., Heinemeyer J., Sunderhaus S., Braun H. P. (2004) Plant Physiol. Biochem. 42, 937–942 - PubMed
    1. Bultema J. B., Braun H. P., Boekema E. J., Kouril R. (2009) Biochim. Biophys. Acta 1787, 60–67 - PubMed
    1. Eubel H., Heinemeyer J., Braun H. P. (2004) Plant Physiol. 134, 1450–1459 - PMC - PubMed
    1. Schägger H., Pfeiffer K. (2000) EMBO J. 19, 1777–1783 - PMC - PubMed

Publication types

MeSH terms