Pituitary adenylate cyclase-activating peptide (PACAP) recruits low voltage-activated T-type calcium influx under acute sympathetic stimulation in mouse adrenal chromaffin cells
- PMID: 22009744
- PMCID: PMC3234986
- DOI: 10.1074/jbc.M111.289389
Pituitary adenylate cyclase-activating peptide (PACAP) recruits low voltage-activated T-type calcium influx under acute sympathetic stimulation in mouse adrenal chromaffin cells
Abstract
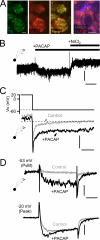
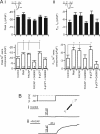
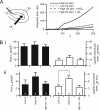
Low voltage-activated T-type Ca(v)3.2 calcium channels are expressed in neurosecretory chromaffin cells of the adrenal medulla. Previous studies have shown that naïve adrenal chromaffin cells express a nominal Ca(v)3.2-dependent conductance. However, Ca(v)3.2 conductance is up-regulated following chronic hypoxia or long term exposure to cAMP analogs. Thus, although a link between chronic stressors and up-regulation of Ca(v)3.2 exists, there are no reports testing the specific role of Ca(v)3.2 channels in the acute sympathoadrenal stress response. In this study, we examined the effects of acute sympathetic stress on T-type Ca(v)3.2 calcium influx in mouse chromaffin cells in situ. Pituitary adenylate cyclase-activating peptide (PACAP) is an excitatory neuroactive peptide transmitter released by the splanchnic nerve under elevated sympathetic activity to stimulate the adrenal medulla. PACAP stimulation did not evoke action potential firing in chromaffin cells but did cause a persistent subthreshold membrane depolarization that resulted in an immediate and robust Ca(2+)-dependent catecholamine secretion. Moreover, PACAP-evoked secretion was sensitive to block by nickel chloride and was acutely inhibited by protein kinase C blockers. We utilized perforated patch electrophysiological recordings conducted in adrenal tissue slices to investigate the mechanism of PACAP-evoked calcium entry. We provide evidence that stimulation with exogenous PACAP and native neuronal stress stimulation both lead to a protein kinase C-mediated phosphodependent recruitment of a T-type Ca(v)3.2 Ca(2+) influx. This in turn evokes catecholamine release during the acute sympathetic stress response.
Figures


Similar articles
-
PACAP regulates immediate catecholamine release from adrenal chromaffin cells in an activity-dependent manner through a protein kinase C-dependent pathway.J Neurochem. 2009 Aug;110(4):1214-25. doi: 10.1111/j.1471-4159.2009.06206.x. Epub 2009 Jun 5. J Neurochem. 2009. PMID: 19508428 Free PMC article.
-
Pituitary adenylate cyclase-activating polypeptide induces a sustained increase in intracellular free Ca(2+) concentration and catechol amine release by activating Ca(2+) influx via receptor-stimulated Ca(2+) entry, independent of store-operated Ca(2+) channels, and voltage-dependent Ca(2+) channels in bovine adrenal medullary chromaffin cells.J Pharmacol Exp Ther. 2002 Sep;302(3):972-82. doi: 10.1124/jpet.102.033456. J Pharmacol Exp Ther. 2002. PMID: 12183654
-
Pituitary adenylate cyclase-activating peptide enhances electrical coupling in the mouse adrenal medulla.Am J Physiol Cell Physiol. 2012 Aug 1;303(3):C257-66. doi: 10.1152/ajpcell.00119.2012. Epub 2012 May 16. Am J Physiol Cell Physiol. 2012. PMID: 22592408 Free PMC article.
-
Is PACAP the major neurotransmitter for stress transduction at the adrenomedullary synapse?J Mol Neurosci. 2012 Oct;48(2):403-12. doi: 10.1007/s12031-012-9749-x. Epub 2012 May 18. J Mol Neurosci. 2012. PMID: 22610912 Free PMC article. Review.
-
Pituitary adenylate cyclase-activating polypeptides, PACAP-38 and PACAP-27, regulation of sympathetic neuron catecholamine, and neuropeptide Y expression through activation of type I PACAP/VIP receptor isoforms.Ann N Y Acad Sci. 1996 Dec 26;805:204-16; discussion 217-8. doi: 10.1111/j.1749-6632.1996.tb17484.x. Ann N Y Acad Sci. 1996. PMID: 8993404 Review.
Cited by
-
A PACAP-activated network for secretion requires coordination of Ca2+ influx and Ca2+ mobilization.Mol Biol Cell. 2024 Jul 1;35(7):ar92. doi: 10.1091/mbc.E24-02-0083. Epub 2024 May 17. Mol Biol Cell. 2024. PMID: 38758660 Free PMC article.
-
Immunomodulatory Role of Neuropeptides in the Cornea.Biomedicines. 2022 Aug 16;10(8):1985. doi: 10.3390/biomedicines10081985. Biomedicines. 2022. PMID: 36009532 Free PMC article. Review.
-
Gap junction communication between chromaffin cells: the hidden face of adrenal stimulus-secretion coupling.Pflugers Arch. 2018 Jan;470(1):89-96. doi: 10.1007/s00424-017-2032-9. Epub 2017 Jul 22. Pflugers Arch. 2018. PMID: 28735418 Review.
-
Roles of Na+, Ca2+, and K+ channels in the generation of repetitive firing and rhythmic bursting in adrenal chromaffin cells.Pflugers Arch. 2018 Jan;470(1):39-52. doi: 10.1007/s00424-017-2048-1. Epub 2017 Aug 3. Pflugers Arch. 2018. PMID: 28776261 Free PMC article. Review.
-
Basal and Stress-Induced Network Activity in the Adrenal Medulla In Vivo.Front Endocrinol (Lausanne). 2022 Jun 20;13:875865. doi: 10.3389/fendo.2022.875865. eCollection 2022. Front Endocrinol (Lausanne). 2022. PMID: 35795145 Free PMC article.
References
-
- Aunis D. (1998) Int. Rev. Cytol. 181, 213–320 - PubMed
-
- Chan S. A., Polo-Parada L., Smith C. (2005) Arch. Biochem. Biophys. 435, 65–73 - PubMed
-
- García A. G., García-De-Diego A. M., Gandía L., Borges R., García-Sancho J. (2006) Physiol. Rev. 86, 1093–1131 - PubMed
-
- Carmichael S. W., Winkler H. (1985) Sci. Am. 253, 40–49 - PubMed
Publication types
MeSH terms
Substances
Grants and funding
LinkOut - more resources
Full Text Sources
Miscellaneous

