. 2011 Oct;23(10):3745-60.
doi: 10.1105/tpc.111.087239. Epub 2011 Oct 18.

Interplay between N-terminal methionine excision and FtsH protease is essential for normal chloroplast development and function in Arabidopsis

Affiliations

Interplay between N-terminal methionine excision and FtsH protease is essential for normal chloroplast development and function in Arabidopsis

Zach Adam et al. Plant Cell. 2011 Oct.

Abstract

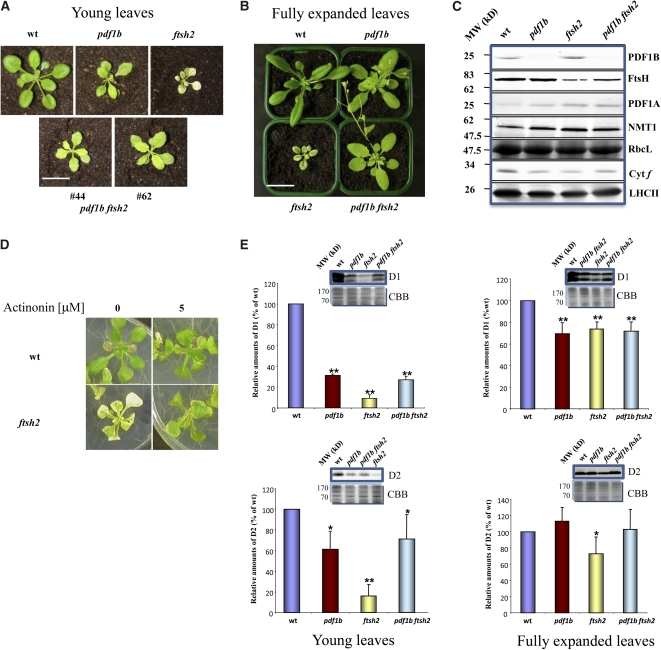
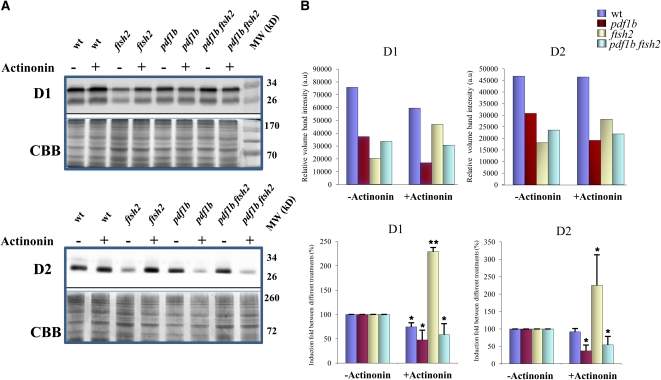
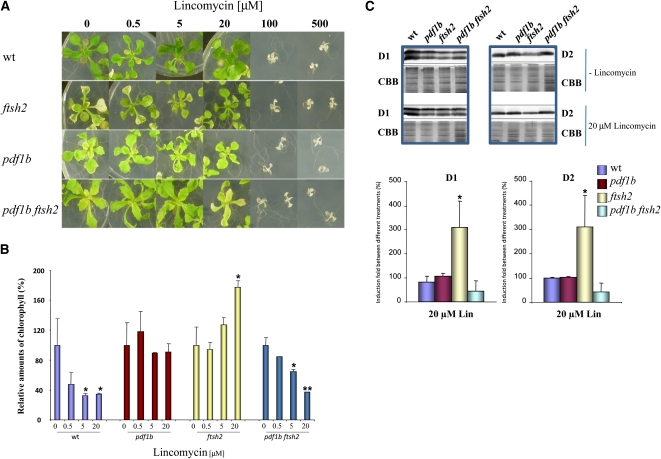
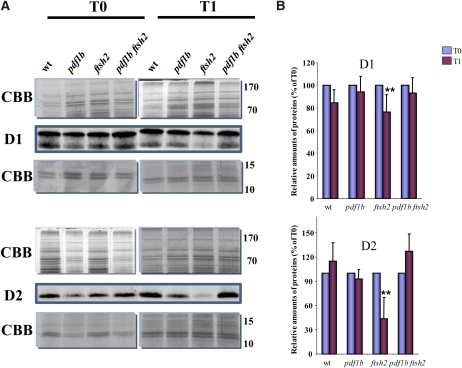
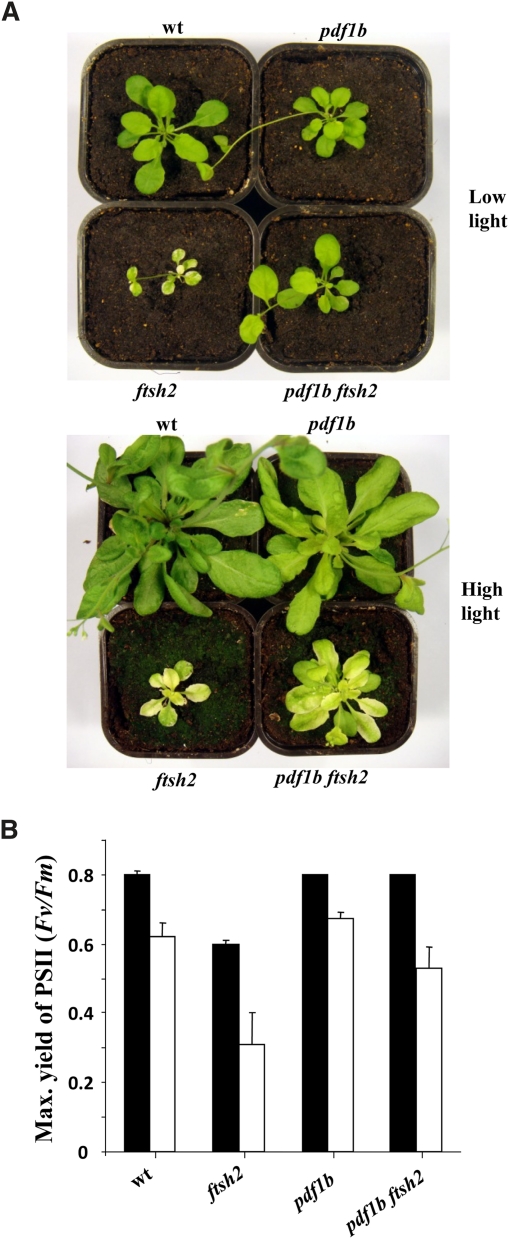
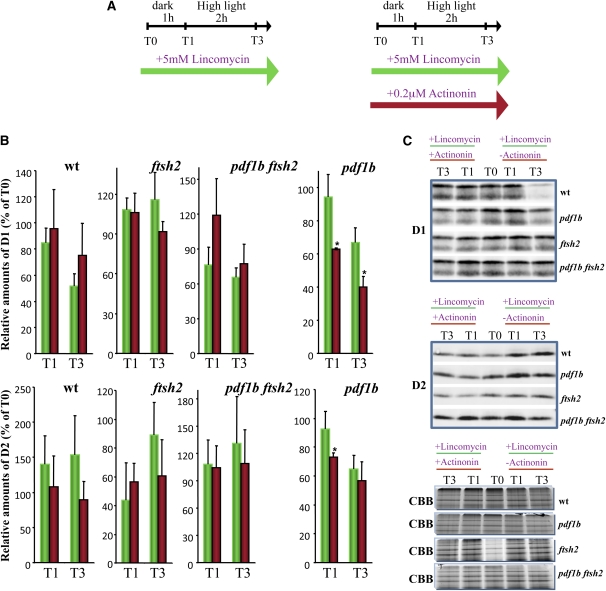
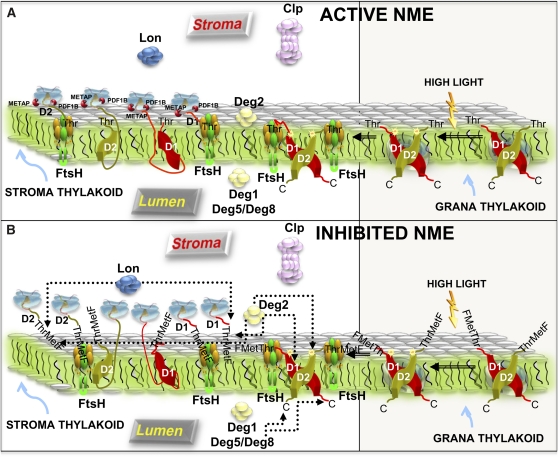
N-terminal methionine excision (NME) is the earliest modification affecting most proteins. All compartments in which protein synthesis occurs contain dedicated NME machinery. Developmental defects induced in Arabidopsis thaliana by NME inhibition are accompanied by increased proteolysis. Although increasing evidence supports a connection between NME and protein degradation, the identity of the proteases involved remains unknown. Here we report that chloroplastic NME (cNME) acts upstream of the FtsH protease complex. Developmental defects and higher sensitivity to photoinhibition associated with the ftsh2 mutation were abolished when cNME was inhibited. Moreover, the accumulation of D1 and D2 proteins of the photosystem II reaction center was always dependent on the prior action of cNME. Under standard light conditions, inhibition of chloroplast translation induced accumulation of correctly NME-processed D1 and D2 in a ftsh2 background, implying that the latter is involved in protein quality control, and that correctly NME-processed D1 and D2 are turned over primarily by the thylakoid FtsH protease complex. By contrast, inhibition of cNME compromises the specific N-terminal recognition of D1 and D2 by the FtsH complex, whereas the unprocessed forms are recognized by other proteases. Our results highlight the tight functional interplay between NME and the FtsH protease complex in the chloroplast.


Figures

Figure 1.
Figure 1.
Genetic Analysis of the Double Mutant pdf1b ftsh2 Places PDF1B Upstream of the FtsH Pathway. (A) Photographs of 3-week-old plants corresponding to the wild type (wt), pdf1b, and ftsh2 single mutants and the double mutant pdf1b ftsh2, grown for 1 week in soil in a greenhouse under standard light conditions. The mutant progenies of pdf1b, ftsh2, pdf1b ftsh2, and the wild type were obtained from the self-pollination of heterozygous pdf1b PDF1B ftsh2 FtsH2 generated by crossing the single pdf1b and ftsh2 mutants (two different pdf1b ftsh2 double mutants are shown). Homozygosis was confirmed by PCR analysis of genomic DNA (see Supplemental Figure 1 online). (B) Photographs of 6-week-old plants corresponding to the wild type, pdf1b, and ftsh2 single mutants and the double mutant pdf1b ftsh2, grown for 4 weeks in soil in a greenhouse under standard light conditions. The mutant progenies of pdf1b, ftsh2, pdf1b ftsh2, and the wild type were obtained as described in (A). (C) Immunoblot analysis of proteins isolated from 30 mg of 2-week-old seedlings corresponding to the wild type, pdf1b, and ftsh2 single mutants and the double mutant pdf1b ftsh2 grown as described in (B). Total proteins (25 μg) were probed using anti-PDF1B, anti-FtsH, anti-PDF1A, anti-NMT1, anticytochrome f, anti-LHCII, and anti-RbcL antibodies. MW, molecular weight. (D) Photographs of 3-week-old plants corresponding to the wild type and ftsh2 single mutant were grown on 1% Suc medium (see Methods) in the absence or presence of 5 μM actinonin in a growth chamber at 22°C, 16 h of daylight, and a light intensity of 100 μE m−2 s−1. (E) Immunoblot analysis was performed using anti-D1 and anti-D2 antibodies to quantify the protein levels in the wild type, pdf1b, and ftsh2 single mutants and the double mutant pdf1b ftsh2 under standard light conditions. Membrane proteins were extracted from 3-week-old (A) and fully expanded leaves (B). Signals from each immunoblot were quantified and normalized using Quantity One 1-D Analysis Software (Bio-Rad, see Methods). The protein level in the wild type was taken as 100%. Values are means of three biological replicates and 9 to 11 technical replicates, and error bars indicate sd. Asterisks indicate the error probability as performed with a two-tailed Student’s t test (*, <0.05; **, <0.01). Representative immunoblots for each condition are shown. The CBB-stained gels are shown just below their respective immunoblot. Bar in (A) = 0.5 cm; bar in (B) = 1 cm. [See online article for color version of this figure.]
Figure 2.
Figure 2.
Partial Chemical Inhibition of Chloroplastic Deformylation Suppresses the Variegated Phenotype in the ftsh2 Background. (A) Membrane proteins of each genotype were isolated from 3-week-old seedlings grown in the absence or presence of 5 μΜ actinonin for the wild type (wt) and ftsh2 mutant and 0.25 μΜ actinonin for the pdf1b and pdf1b ftsh2 mutants (see Supplemental Figure 3A online); 25 μg membrane proteins were separated by 12% SDS-PAGE, and accumulation of D1 and D2 was estimated by immunoblot analysis. The CBB-stained gels are shown just below their respective immunoblots. The stained portions of the gels were used to calculate the normalization coefficient for the equal loading of the samples. (B) Relative volume intensities of D1 and D2 for one representative immunoblot after normalization are shown in arbitrary units (a.u) (Top). Data show the induction fold of D1 and D2 between different treatments, generated from four biological replicates. The values after normalization are reported as a percentage of the value of D1 or D2 corresponding to each genotype in the absence of actinonin, taken as 100% (error bars indicate sd) (Bottom). Asterisks indicate the error probability as performed with a two-tailed Student’s t test (*, <0.05; **, <0.01). [See online article for color version of this figure.]
Figure 3.
Figure 3.
Under Standard Light Conditions, Reduced Chloroplast Translation Induces Accumulation of the Correctly NME-Processed D1 and D2 Solely in the Absence of FtsH2. (A) Wild type (wt), pdf1b and ftsh2 single mutants, and the double mutant pdf1b ftsh2 were grown on 1% Suc medium (see Methods) in the absence or presence of increasing concentrations of lincomycin in a growth chamber at 22°C, 16 h of daylight, and a light intensity of 100 μE m−2 s−1 for 3 weeks. (B) Chlorophyll content obtained from seedlings in (A). Total chlorophyll content was determined spectroscopically and was normalized to fresh weight. Total chlorophyll content for each variant in the absence of lincomycin was taken as 100%. Values are means of three biological replicates, and error bars indicate sd. Asterisks indicate the error probability as performed with a two-tailed Student’s t test (*, <0.05; **, <0.01). (C) Immunoblot analysis of the accumulation of membrane proteins D1 and D2 from each genotype in (A) in the absence or presence of 20 μM lincomycin. Total membrane proteins (25 μg) were separated by 12% SDS-PAGE. Each value in the absence of lincomycin corresponding to each genotype was taken as 100%. Values correspond to two independent experiments each consisting of 6 to 9 biological replicates originating from the measurement performed from independent leaves. Error bars indicate sd. Asterisk indicates the error probability as performed with a two-tailed Student’s t test (*, <0.05). Representative immunoblots for each condition are shown. The CBB-stained gels used for normalization are shown just below their respective immunoblot. [See online article for color version of this figure.]
Figure 4.
Figure 4.
Protein Synthesis Inhibition Causes a Rapid Decrease of D2 in the ftsh2 Mutant under Dark Conditions. (A) Representative protein immunoblots of the PSII core polypeptides from the different genotypes with anti-D1 and anti-D2 antibodies. Membrane proteins were extracted from untreated leaves after removal of leaf tissue from plants grown in the greenhouse (T0). Similar leaves were incubated via their petioles in 5 mM lincomycin for 1 h in the dark. After this incubation time (T1), some of these leaves were used to extract membrane proteins that were subjected to immunoblot analysis. wt, wild type. (B) Signals from immunoblot analyses as in (A) were quantified and normalized as reported in Figure 3. Data were obtained from five biological replicates and between 10 to 15 technical replicates. To compare the relative levels of D1 and D2 proteins, the value at T0 in each genotype was set to 100%. Error bars indicate sd. Asterisks indicate the error probability as performed with a two-tailed Student’s t test (**, <0.01). [See online article for color version of this figure.]
Figure 5.
Figure 5.
NME Inhibition Suppresses ftsh2 Sensitivity to Photoinhibition under Short-Term Exposure to High Light. (A) Four-week-old plants corresponding to the wild type (wt), the pdf1b and ftsh2 single mutants, and the double mutant pdf1b ftsh2, grown for 2 weeks on soil in the greenhouse, were transferred to a growth chamber at 22°C, 16 h of daylight, and a light intensity of 20 μE m−2 s−1 (Top), then the pots were transferred to an equivalent chamber with a light intensity of 500 μE m−2 s−1 for another 2 weeks (Bottom). Photographs are taken at the same time on 8-week-old plants. (B) For the photoinhibition experiments, 6-week-old plants corresponding to different variants grown in the greenhouse under standard light conditions were used. PSII activity, monitored as Fv/Fm, was measured after dark adaptation (dark columns), then again after exposing the different variants to high light (500 μE m−2 s−1) for 30 min (white columns). The values are means ± se (error bars) of eight independent experiments of each genotype. [See online article for color version of this figure.]
Figure 6.
Figure 6.
In Vivo Analysis of D1 and D2 Degradation Reveals a Rapid Decrease of D2 in the ftsh2 Mutant under Dark Conditions. The ability to degrade D1 and D2 polypeptides in vivo following light-induced damage was assayed by incubating 6-week-old detached leaves of each variant in the absence or presence of 5 mM lincomycin. Three different biological replicates and 9-11 technical replicates were used for each genotype. Leaves from T0 were exposed to high light (μE m2 s1) for 4 additional hours prior to protein preparation. (A) Experimental setting. (B) Protein immunoblot analyses were performed for each point and genotype using anti-D1 and anti-D2 antibodies (see also Figures 4 and 7 for the immunoblots corresponding to the dark samples [T0]). Representative immunoblots for each condition and genotype are shown. The upper CBB-stained gels used for normalization are shown to the right of the respective immunoblots. wt, wild type. (C) Signals of the immunoblot analysis were quantified and normalized as described in Methods. To compare the relative levels of D1 and D2 protein, the value at time T0 in each genotype was set to 100%. Data were obtained from five biological replicates and between 10 to 15 technical replicates. Asterisks indicate the error probability as performed with a two-tailed t test (*, <0.05; **, <0.01). [See online article for color version of this figure.]
Figure 7.
Figure 7.
Under Photoinhibitory Conditions, the Contribution of FtsH2 to the Degradation of Fully Unprocessed N-Terminal D1 and D2 Is Irrelevant for D2 and Minor for D1. The ability to degrade the D1 and D2 polypeptides in vivo following light-induced damage was assayed by incubating 8-week-old detached leaves of each variant in the presence of 5 mM lincomycin and in the absence and presence of 0.2 mM actinonin (red bars). Three different biological replicates and 9-11 technical replicates were used for each genotype. (A) Experimental setting. (B) Immunoblot analysis was performed using anti-D1 and anti-D2 antibodies to quantify the protein levels in the wild type (wt), pdf1b, and ftsh2 single mutants and the double mutant pdf1b ftsh2. Signals were quantified and normalized as described in Methods. To compare the relative levels of D1 and D2, the value at time T0 in each genotype was set to 100%. Data were obtained from five biological replicates and between 10 to 15 technical replicates. Error bars indicate SD. * indicates an error probability (two-tailed t test) less than 0.05. (C) Representative immunoblots for each condition and genotype are shown. The equivalent upper gels used for normalization (see Methods) are shown. [See online article for color version of this figure.]
Figure 8.
Figure 8.
Model Recapitulating D1 and D2 Degradation by Different Chloroplastic Proteases as a Function of the NME Process. Both cartoons show the architecture around the thylakoid membranes and the possible interplay between all chloroplastic proteases (Lon, ClpP, Deg, or FtsH) and D1 and D2 at the level of the PSII complex or the ribosome as a function of the NME process (PDF and METAP) and under normal or photoinhibition conditions (referred to as “High Light” in the cartoon). Note that FtsH also can be located in the thylakoid grana (Yoshioka et al., 2010). (A) Independent of the conditions, correctly NME-processed D1 and D2 components of PSII are turned over primarily by the FtsH metalloprotease complex. (B) When the NME process is inhibited, the NME non-processed PSII subunits starting now with a N-terminal Formyl-Met-Threonine (indicated as FMetThr) appear to be recognized and degraded primarily by proteases other than the FtsH complex (dotted arrows). [See online article for color version of this figure.]

Similar articles

Cited by

References

    1. Adam Z., Clarke A.K. (2002). Cutting edge of chloroplast proteolysis. Trends Plant Sci. 7: 451–456 - PubMed
    1. Adam Z., Rudella A., van Wijk K.J. (2006). Recent advances in the study of Clp, FtsH and other proteases located in chloroplasts. Curr. Opin. Plant Biol. 9: 234–240 - PubMed
    1. Adir N., Ohad I. (1988). Structural properties of the D1 and surrounding photosystem II polypeptides as revealed by their interaction with cross-linking reagents. J. Biol. Chem. 263: 283–289 - PubMed
    1. Andersson F.I., et al. (2009). Structure and function of a novel type of ATP-dependent Clp protease. J. Biol. Chem. 284: 13519–13532 - PMC - PubMed
    1. Arfin S.M., Bradshaw R.A. (1988). Cotranslational processing and protein turnover in eukaryotic cells. Biochemistry 27: 7979–7984 - PubMed

Publication types

MeSH terms

LinkOut - more resources