

Distinct Ldb1/NLI complexes orchestrate γ-globin repression and reactivation through ETO2 in human adult erythroid cells
- PMID: 22010104
- PMCID: PMC3234672
- DOI: 10.1182/blood-2011-06-363101
Distinct Ldb1/NLI complexes orchestrate γ-globin repression and reactivation through ETO2 in human adult erythroid cells
Abstract
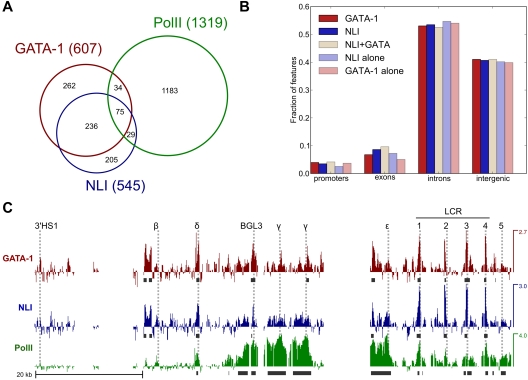
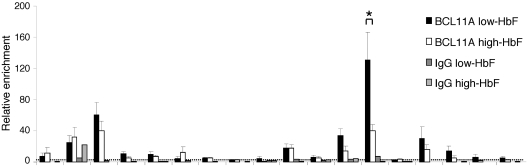
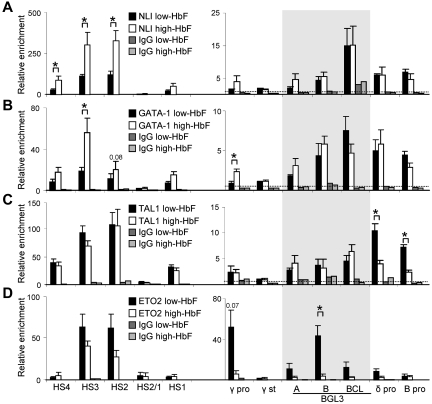
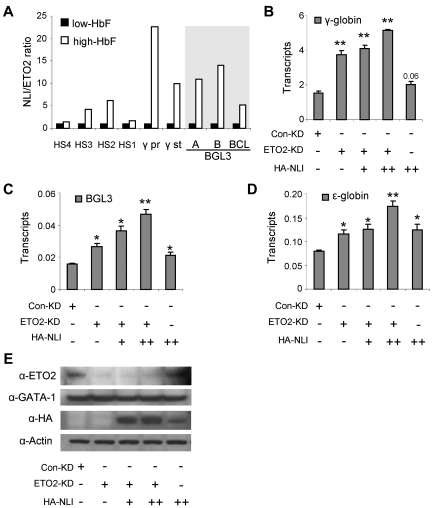
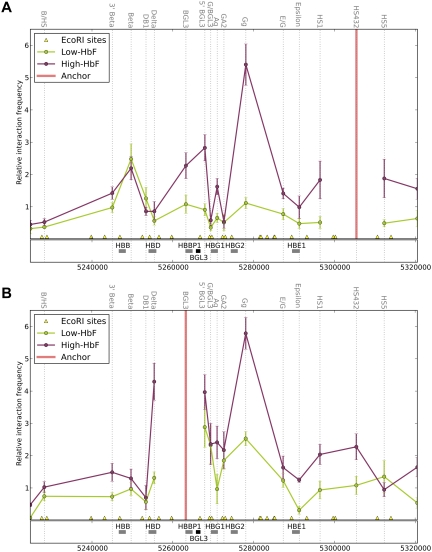
The Ldb1/GATA-1/TAL1/LMO2 complex mediates long-range interaction between the β-globin locus control region (LCR) and gene in adult mouse erythroid cells, but whether this complex mediates chromatin interactions at other developmental stages or in human cells is unknown. We investigated NLI (Ldb1 homolog) complex occupancy and chromatin conformation of the β-globin locus in human erythroid cells. In addition to the LCR, we found robust NLI complex occupancy at a site downstream of the (A)γ-globin gene within sequences of BGL3, an intergenic RNA transcript. In cells primarily transcribing β-globin, BGL3 is not transcribed and BGL3 sequences are occupied by NLI core complex members, together with corepressor ETO2 and by γ-globin repressor BCL11A. The LCR and β-globin gene establish proximity in these cells. In contrast, when γ-globin transcription is reactivated in these cells, ETO2 participation in the NLI complex at BGL3 is diminished, as is BCL11A occupancy, and both BGL3 and γ-globin are transcribed. In these cells, proximity between the BGL3/γ-globin region and the LCR is established. We conclude that alternative NLI complexes mediate γ-globin transcription or silencing through long-range LCR interactions involving an intergenic site of noncoding RNA transcription and that ETO2 is critical to this process.
Figures

Similar articles
-
The hematopoietic regulator TAL1 is required for chromatin looping between the β-globin LCR and human γ-globin genes to activate transcription.Nucleic Acids Res. 2014 Apr;42(7):4283-93. doi: 10.1093/nar/gku072. Epub 2014 Jan 26. Nucleic Acids Res. 2014. PMID: 24470145 Free PMC article.
-
A positive role for NLI/Ldb1 in long-range beta-globin locus control region function.Mol Cell. 2007 Dec 14;28(5):810-22. doi: 10.1016/j.molcel.2007.09.025. Mol Cell. 2007. PMID: 18082606 Free PMC article.
-
Ldb1-nucleated transcription complexes function as primary mediators of global erythroid gene activation.Blood. 2013 May 30;121(22):4575-85. doi: 10.1182/blood-2013-01-479451. Epub 2013 Apr 22. Blood. 2013. PMID: 23610375 Free PMC article.
-
Ldb1 complexes: the new master regulators of erythroid gene transcription.Trends Genet. 2014 Jan;30(1):1-9. doi: 10.1016/j.tig.2013.10.001. Epub 2013 Nov 27. Trends Genet. 2014. PMID: 24290192 Free PMC article. Review.
-
The Hematopoietic Stem and Progenitor Cell Cistrome: GATA Factor-Dependent cis-Regulatory Mechanisms.Curr Top Dev Biol. 2016;118:45-76. doi: 10.1016/bs.ctdb.2016.01.002. Epub 2016 Feb 26. Curr Top Dev Biol. 2016. PMID: 27137654 Free PMC article. Review.
Cited by
-
CTCF-mediated chromatin looping in EGR2 regulation and SUZ12 recruitment critical for peripheral myelination and repair.Nat Commun. 2020 Aug 17;11(1):4133. doi: 10.1038/s41467-020-17955-2. Nat Commun. 2020. PMID: 32807777 Free PMC article.
-
A unified model of human hemoglobin switching through single-cell genome editing.Nat Commun. 2021 Aug 17;12(1):4991. doi: 10.1038/s41467-021-25298-9. Nat Commun. 2021. PMID: 34404810 Free PMC article.
-
LDB1 establishes multi-enhancer networks to regulate gene expression.Mol Cell. 2025 Jan 16;85(2):376-393.e9. doi: 10.1016/j.molcel.2024.11.037. Epub 2024 Dec 24. Mol Cell. 2025. PMID: 39721581
-
CTCF-mediated transcriptional regulation through cell type-specific chromosome organization in the β-globin locus.Nucleic Acids Res. 2012 Sep;40(16):7718-27. doi: 10.1093/nar/gks536. Epub 2012 Jun 16. Nucleic Acids Res. 2012. PMID: 22705794 Free PMC article.
-
Chromatin loop formation in the β-globin locus and its role in globin gene transcription.Mol Cells. 2012 Jul;34(1):1-5. doi: 10.1007/s10059-012-0048-8. Epub 2012 May 18. Mol Cells. 2012. PMID: 22610406 Free PMC article. Review.
References
-
- Sankaran VG, Menne TF, Xu J, et al. Human fetal hemoglobin expression is regulated by the developmental stage-specific repressor BCL11A. Science. 2008;322(5909):1839–1842. - PubMed
-
- Tolhuis B, Palstra RJ, Splinter E, Grosveld F, de Laat W. Looping and interaction between hypersensitive sites in the active beta-globin locus. Mol Cell. 2002;10(6):1453–1465. - PubMed
Publication types
MeSH terms
Substances
Grants and funding
LinkOut - more resources
Full Text Sources
Molecular Biology Databases
