. 2011 Dec;4(6):605-13.
doi: 10.1161/CIRCGENETICS.111.960419. Epub 2011 Oct 18.

Selective microRNA suppression in human thoracic aneurysms: relationship of miR-29a to aortic size and proteolytic induction

Affiliations

Selective microRNA suppression in human thoracic aneurysms: relationship of miR-29a to aortic size and proteolytic induction

Jeffrey A Jones et al. Circ Cardiovasc Genet. 2011 Dec.

Abstract

Background: Increasing evidence points to a direct role for altered microRNA (miRNA or miR) expression levels in cardiovascular remodeling and disease progression. Although alterations in miR expression levels have been directly linked to cardiac hypertrophy, fibrosis, and remodeling, their role in regulating gene expression during thoracic aortic aneurysm (TAA) development has yet to be explored.

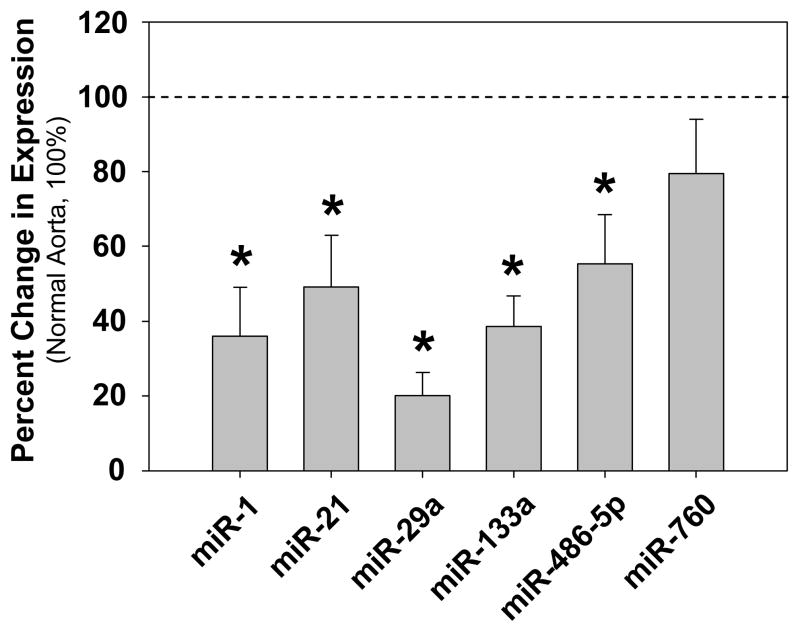
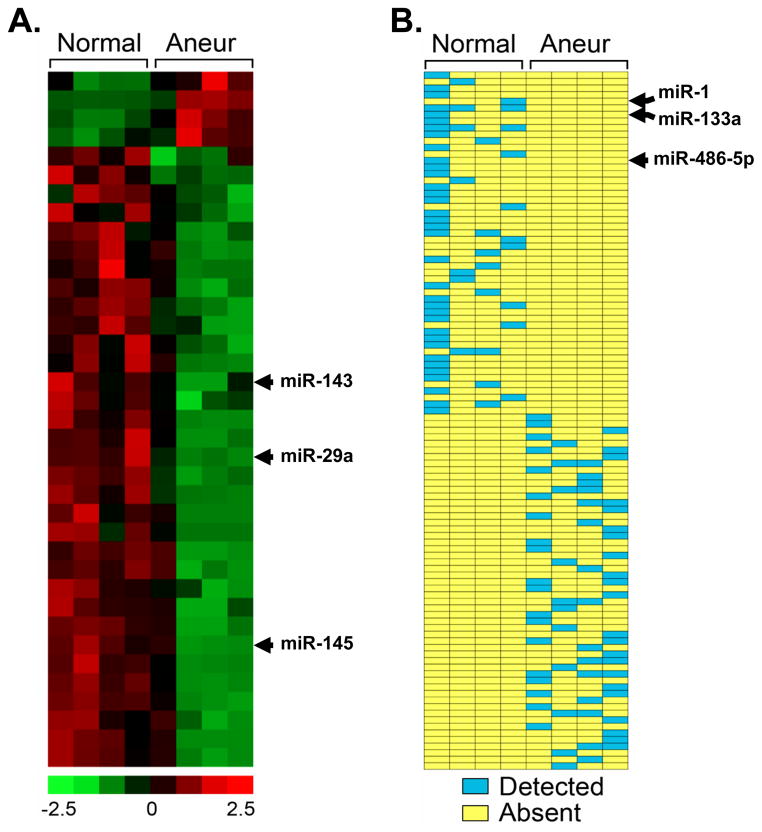
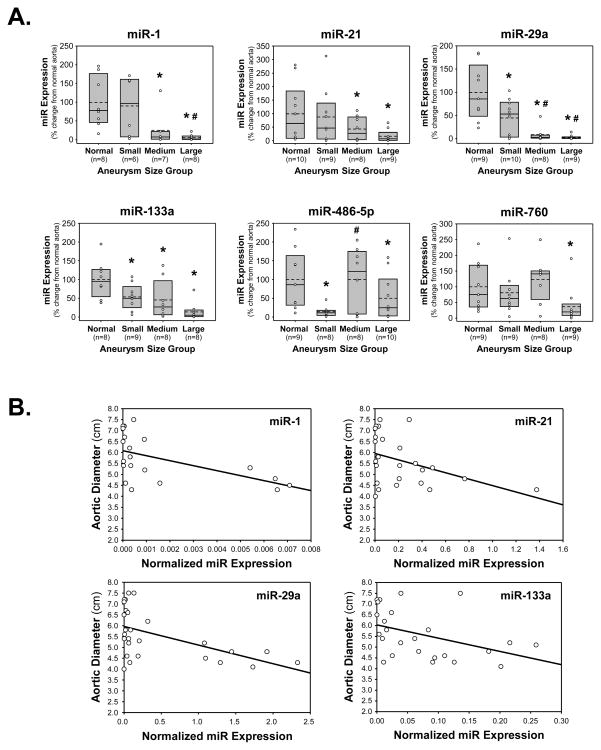
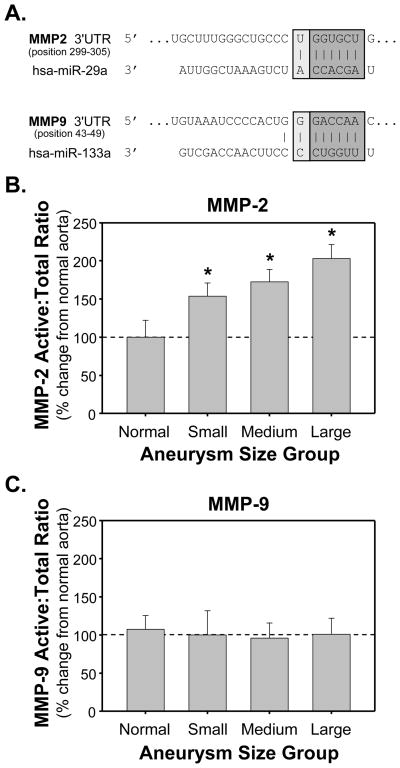
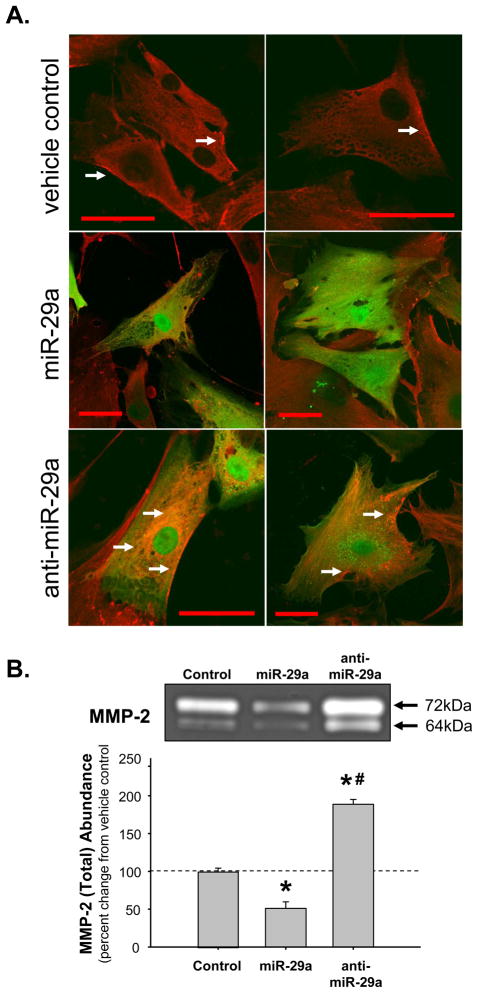
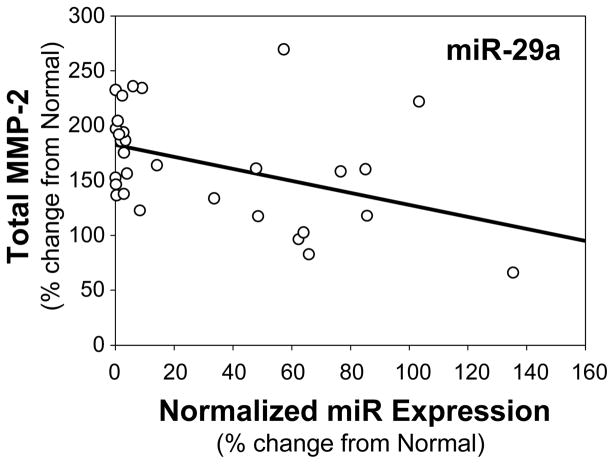
Methods and results: The present study examined miR expression levels in aortic tissue specimens collected from patients with ascending TAAs by quantitative real-time PCR, and observed decreased miR expression (miRs -1, -21, -29a, -133a, and -486) as compared with normal aortic specimens. A significant relationship between miR expression levels (miRs -1, -21, -29a, and -133a) and aortic diameter was identified; as aortic diameter increased, miR expression decreased. Through the use of a bioinformatics approach, members of the matrix metalloproteinase (MMP) family, proteins involved in TAA development, were examined for putative miR binding sites. MMP-2 and MMP-9 were identified as potential targets for miR-29a and miR-133a, respectively, and MMP-2 was subsequently verified as a miR-29a target in vitro. A significant inverse relationship between miR-29a and total MMP-2 was then identified in the clinical TAA specimens.

Conclusions: These findings demonstrate altered miR expression patterns in clinical TAA specimens, suggesting that the loss of specific miR expression may allow for the elaboration of specific MMPs capable of driving aortic remodeling during TAA development. Importantly, these data suggest that these miRs have biological and clinical relevance to the behavior of TAAs and may provide significant targets for therapeutic and diagnostic applications.


Conflict of interest statement

Conflict of Interest Disclosures: Drs. Jones, Elefteriades, Bavaria, Joseph Gorman, Robert Gorman, Spinale, and Ikonomidis are all grant recipients. Dr. Spinale consults for Boston Scientific, Acorn Cardiovascular, and Roche Pharmaceuticals. Dr. Ikonomidis consults for W.L. Gore and Associates, and On-X Life Technologies, Inc..

Figures

Figure 1
Figure 1
Alterations in miR expression in clinical TAA specimens as compared to normal aorta. Mean percent change (±SEM) of miR expression in clinical TAA specimens versus normal aorta. All specimens were analyzed by quantitative PCR. The results for all cycling specimens are shown in the graph. The dashed line represents the results for normal aorta set at 100% for each miR examined (n=minimum of 8). The bars represent results for miR expression in cycling TAA specimens; miR-1 (n=21), miR-21 (n=26), miR-29a (n-27), miR-133a (n=25), miR-486-5p (n=26), and miR-760 (n=26); * indicates p<0.05 versus 100%. Note: expression of the myocardial-specific miR-208 was not detected in our aortic specimens.
Figure 2
Figure 2
Differentially expressed miRs in clinical TAA specimens as compared to normal aorta. miRs differentially expressed between aneurysmal (Aneur; n=4) and normal (Normal, n=4) aorta were detected by Affymetrix GeneChip analysis. A, Heatmap depicting 37 differentially expresses miRs between Aneur and Normal aorta. Colorimetric scaling for expression values (z-standardized) is shown at bottom. Patterns for miR-29a, and previously describe miR-143/miR-145, are indicated. B, Schematic diagram depicting detection scoring for 106 miRs that changed from detected to undetected or undetected to detected between Aneur and Normal aorta. Positive statistical detection calls for miRs are indicated by blue; absent (i.e., undetected) calls are indicated by yellow. Patterns for miRs-1, -133a, and -486-5p are indicated.
Figure 3
Figure 3
miR expression and relationship to aortic size. A. miR expression was stratified into groups based on aortic diameter (TAA size) defined as: small TAAs (4.0–5.0 cm), medium TAAs (5.1–6.0 cm), or large TAAs (6.1–7.5 cm), and results were compared to normal aorta (Normal). Expression levels were calculated as a percent change form normal aorta (set at 100%) and displayed as box plots showing the median (solid line), interquartile range (25th to 75th percentile; gray box), and the mean (dashed line), overlaid with a scatter plot of each value; * p<0.05 versus 100%, # p<0.05 versus small TAAs. B. Linear least-squares regression analysis demonstrating several significant inverse relationships between miR expression in clinical TAA specimens and aortic diameter; miR-1 (r= −0.5433, p=0.0109, n=21), miR-21 (r=−0.4132, p=0.0359, n=26), miR-29a (r=−0.5364, p=0.0039, n=27), and miR-133a (r=−0.4247, p=0.0344, n=25).
Figure 4
Figure 4
Identification and relative abundance of potential biological targets for altered miRs in clinical TAA specimens. A. Significant miR binding sites identified using the TargetScanHuman database (v5.1 released April 2009). B. Relative protein abundance of MMP-2 in clinical TAA specimens as compared to normal aorta as determined by zymographic analysis. C. Relative protein abundance of MMP-9 in clinical TAA specimens as compared to normal aorta as determined by zymographic analysis. Changes in the ratio of active:total forms were determined by densitometry and expressed as mean percent change (±SEM) from normal aorta (set at 100%); * p<0.05 versus 100%.
Figure 5
Figure 5
Modulation of miR-29a expression levels in human primary aortic vascular smooth muscle cells. A. Cells were exposed to lentiviral constructs, containing a bicistronic copy of green fluorescent protein (GFP), designed to overexpress miR29a, anti-miR-29a, or to the transduction reagent alone. Five days post-transduction the cells were stained with MMP-2 specific antisera using an AlexFluor647 secondary antibody. Green fluorescence (GFP; ex 488nm/em 509nm) was used to identify transduced cells, while red fluorescence (MMP-2; ex 633nm/em 670) showed the localization and abundance of the active and latent forms of MMP-2. MMP-2 was localized to the cell periphery in vehicle treated cells (transduction vehicle control, top), while in the miR-29a transduced cells (middle panels), MMP-2 abundance was attenuated. In the anti-miR-29a transduced cells (bottom panels), MMP-2 protein levels were enhanced. White arrows show regions of MMP-2 accumulation at the peri-nuclear region, and cell periphery. Red bar = 50μm. B. Cells were exposed to the transduction vehicle alone, miR-29a lentivirus, or anti-miR-29a lentivirus. Five days post-transduction cells were harvested and examined by gelatin zymography. The results demonstrated that overexpression of miR-29a attenuated total MMP-2 protein abundance, while overexpression of anti-miR-29a enhanced total MMP-2 protein abundance (n=3; * p<0.05 versus control, # p<0.05 versus miR-29a transduced cells).
Figure 6
Figure 6
Relationship between total MMP-2 abundance and miR-29a expression in clinical TAA specimens. Linear least-squares regression analysis demonstrated a significant inverse relationship between miR-29a expression and total MMP-2 abundance (r= −0.4198, p=0.0209, n=30).

References

    1. Bartel DP. Micrornas: Genomics, biogenesis, mechanism, and function. Cell. 2004;116:281–297. - PubMed
    1. Kozomara A, Griffiths-Jones S. Mirbase: Integrating microrna annotation and deep-sequencing data. Nucleic Acids Res. 2011;39:D152–157. - PMC - PubMed
    1. Lewis BP, Burge CB, Bartel DP. Conserved seed pairing, often flanked by adenosines, indicates that thousands of human genes are microrna targets. Cell. 2005;120:15–20. - PubMed
    1. Bartel DP. Micrornas: Target recognition and regulatory functions. Cell. 2009;136:215–233. - PMC - PubMed
    1. Friedman RC, Farh KK, Burge CB, Bartel DP. Most mammalian mrnas are conserved targets of micrornas. Genome Res. 2009;19:92–105. - PMC - PubMed

Publication types