

Molecular determinants of retinoic acid sensitivity in pancreatic cancer
- PMID: 22010213
- PMCID: PMC3251696
- DOI: 10.1158/1078-0432.CCR-11-2165
Molecular determinants of retinoic acid sensitivity in pancreatic cancer
Abstract
Purpose: To identify a predictive molecular "signature" for sensitivity to retinoic acid in pancreatic cancer.
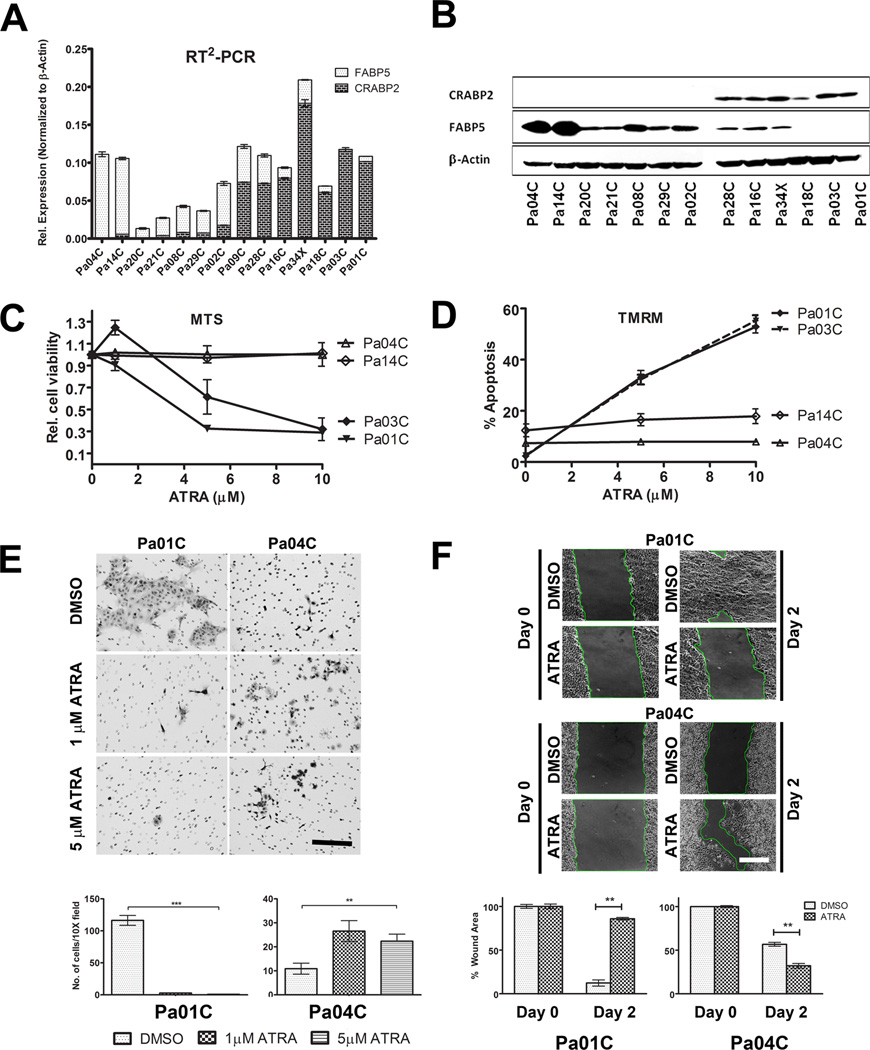
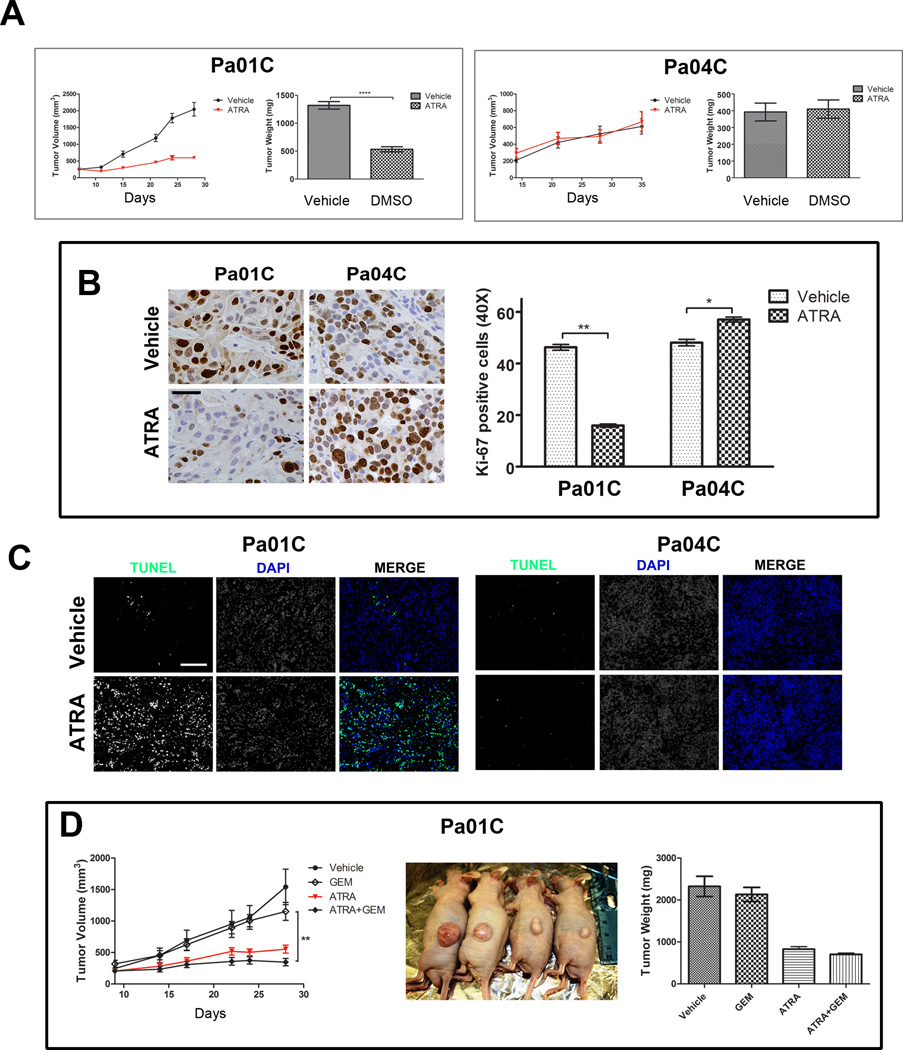
Experimental design: Fourteen patient-derived, low-passage pancreatic ductal adenocarcinoma (PDAC) lines with varied expression of fatty acid-binding protein 5 (FABP5) and cellular retinoic acid-binding protein 2 (CRABP2) were used to evaluate the response to all-trans retinoic acid (ATRA). Cell proliferation, apoptosis, and migration/invasion assays were used to measure the in vitro response. Tumor growth was monitored in subcutaneous xenografts in athymic nude mice for 4 weeks.
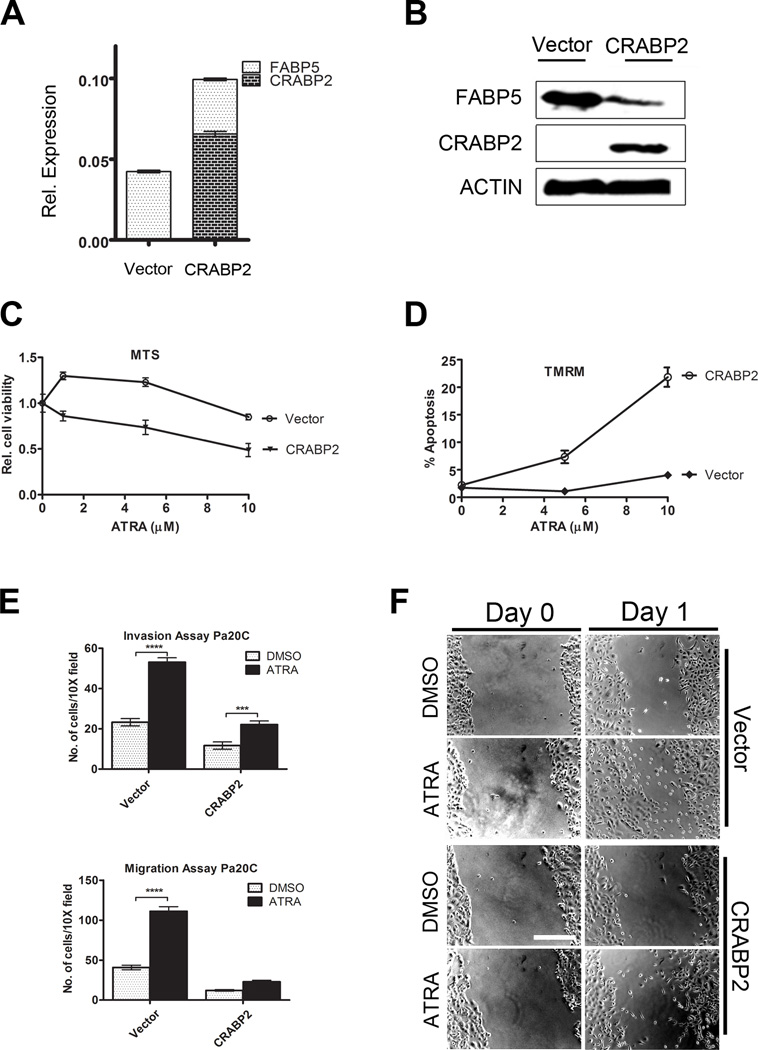
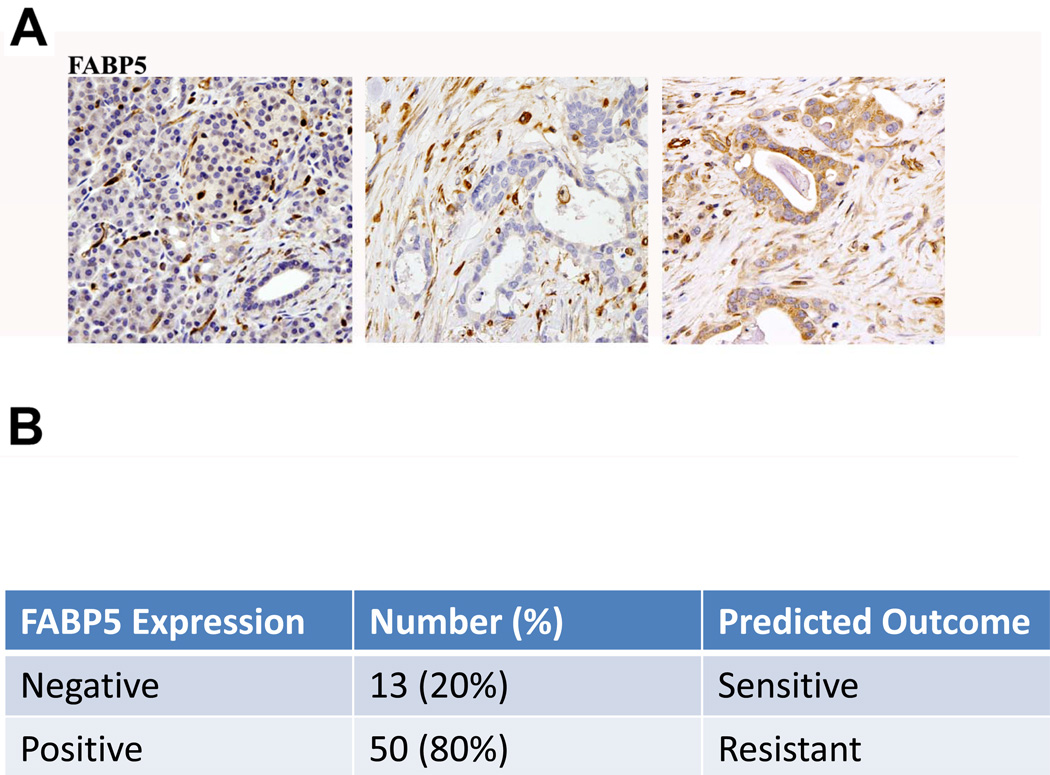
Results: Response to ATRA was observed to be dependent upon differential expression of FABP5 versus CRABP2. Thus, elevated FABP5 expression was associated with minimal cytotoxicity and tumor growth inhibition and a paradoxical increase in migration and invasion. Conversely, CRABP2 expression in the absence of FABP5 was associated with significant tumor growth inhibition with ATRA, even in gemcitabine-resistant tumors. The ATRA-resistant phenotype of FABP5(high)CRABP2(null) cells could be circumvented by ectopic expression of CRABP2. Alternatively, reexpression of endogenous CRABP2 could be enabled in FABP5(high)CRABP2(null) PDAC lines by exposure to decitabine and trichostatin A, thereby relieving epigenetic silencing of the CRABP2 gene promoter. Immunohistochemical staining for FABP5 in archival human tissue microarrays identifies a subset of cases (13 of 63, ~20%) which are negative for FABP5 expression and might be candidates for ATRA therapy.
Conclusions: The widely used agent ATRA deserves a "second look" in PDAC, but needs to be targeted to patient subsets with biopsy-proven FABP5-negative tumors, or be combined with a chromatin-modifying agent to reexpress endogenous CRABP2.
© 2011 AACR.
Conflict of interest statement
No potential conflicts of interest were disclosed.
Figures
Similar articles
-
CRABP2 and FABP5 expression levels in diseased and normal pancreas.Ann Diagn Pathol. 2020 Aug;47:151557. doi: 10.1016/j.anndiagpath.2020.151557. Epub 2020 Jun 20. Ann Diagn Pathol. 2020. PMID: 32593808
-
4-Amino-2-trifluoromethyl-phenyl retinate inhibits proliferation, invasion, and migration of breast cancer cells by independently regulating CRABP2 and FABP5.Drug Des Devel Ther. 2018 Apr 27;12:997-1008. doi: 10.2147/DDDT.S151029. eCollection 2018. Drug Des Devel Ther. 2018. Retraction in: Drug Des Devel Ther. 2024 Jul 03;18:2713-2714. doi: 10.2147/DDDT.S484570. PMID: 29731607 Free PMC article. Retracted.
-
Antitumor effects of all-trans retinoic acid and its synergism with gemcitabine are associated with downregulation of p21-activated kinases in pancreatic cancer.Am J Physiol Gastrointest Liver Physiol. 2019 May 1;316(5):G632-G640. doi: 10.1152/ajpgi.00344.2018. Epub 2019 Mar 7. Am J Physiol Gastrointest Liver Physiol. 2019. PMID: 30844294
-
Cellular Retinoic-Acid Binding Protein 2 in Solid Tumor.Curr Protein Pept Sci. 2020;21(5):507-516. doi: 10.2174/1389203721666200203150721. Curr Protein Pept Sci. 2020. PMID: 32013828 Review.
-
Retinoic acid as cause of cell proliferation or cell growth inhibition depending on activation of one of two different nuclear receptors.Nutr Rev. 2008 Jan;66(1):55-9. doi: 10.1111/j.1753-4887.2007.00006.x. Nutr Rev. 2008. PMID: 18254885 Review.
Cited by
-
Circular RNA hsa_circ_0011298 enhances Taxol resistance of non-small cell lung cancer by regulating miR-486-3p/CRABP2 axis.J Clin Lab Anal. 2022 May;36(5):e24408. doi: 10.1002/jcla.24408. Epub 2022 Apr 8. J Clin Lab Anal. 2022. PMID: 35396749 Free PMC article.
-
Activation of the CRABPII/RAR pathway by curcumin induces retinoic acid mediated apoptosis in retinoic acid resistant breast cancer cells.Oncol Rep. 2017 Apr;37(4):2007-2015. doi: 10.3892/or.2017.5495. Epub 2017 Mar 8. Oncol Rep. 2017. PMID: 28350049 Free PMC article.
-
Five gene probes carry most of the discriminatory power of the 70-gene risk model in multiple myeloma.Leukemia. 2014 Dec;28(12):2410-3. doi: 10.1038/leu.2014.232. Epub 2014 Jul 31. Leukemia. 2014. PMID: 25079174 Free PMC article. No abstract available.
-
GNASR201C Induces Pancreatic Cystic Neoplasms in Mice That Express Activated KRAS by Inhibiting YAP1 Signaling.Gastroenterology. 2018 Nov;155(5):1593-1607.e12. doi: 10.1053/j.gastro.2018.08.006. Epub 2018 Aug 22. Gastroenterology. 2018. PMID: 30142336 Free PMC article.
-
Cellular Retinoic Acid Binding Protein 2 Is Strikingly Downregulated in Human Esophageal Squamous Cell Carcinoma and Functions as a Tumor Suppressor.PLoS One. 2016 Feb 3;11(2):e0148381. doi: 10.1371/journal.pone.0148381. eCollection 2016. PLoS One. 2016. PMID: 26839961 Free PMC article.
References
-
- Altekruse SFKC, Krapcho M, Neyman N, Aminou R, Waldron W, Ruhl J, Howlader N, Tatalovich Z, Cho H, Mariotto A, Eisner MP, Lewis DR, Cronin K, Chen HS, Feuer EJ, Stinchcomb DG, Edwards BK, editors. SEER Cancer Statistics Review. Bethesda, MD: National Cancer Institute; 1975–2007.
-
- Altucci L, Gronemeyer H. The promise of retinoids to fight against cancer. Nat Rev Cancer. 2001;1:181–193. - PubMed
-
- El-Metwally TH, Hussein MR, Pour PM, Kuszynski CA, Adrian TE. High concentrations of retinoids induce differentiation and late apoptosis in pancreatic cancer cells in vitro. Cancer Biol Ther. 2005;4:602–611. - PubMed
-
- Nakagawa T, Shimizu M, Shirakami Y, Tatebe H, Yasuda I, Tsurumi H, et al. Synergistic effects of acyclic retinoid and gemcitabine on growth inhibition in pancreatic cancer cells. Cancer Lett. 2009;273:250–256. - PubMed
Publication types
MeSH terms
Substances
Grants and funding
LinkOut - more resources
Full Text Sources
Medical
Research Materials
Miscellaneous
