. 2011 Nov;14(6):1379-92.
doi: 10.1111/j.1467-7687.2011.01083.x. Epub 2011 Sep 17.

Stronger neural dynamics capture changes in infants' visual working memory capacity over development

Affiliations

Stronger neural dynamics capture changes in infants' visual working memory capacity over development

Sammy Perone et al. Dev Sci. 2011 Nov.

Abstract

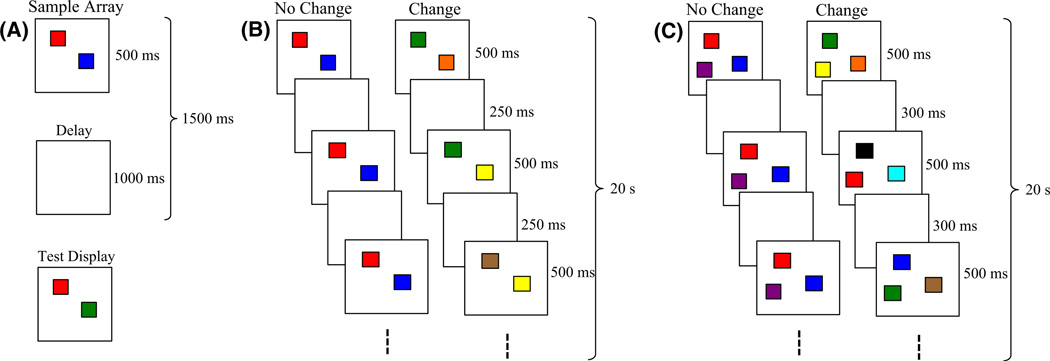
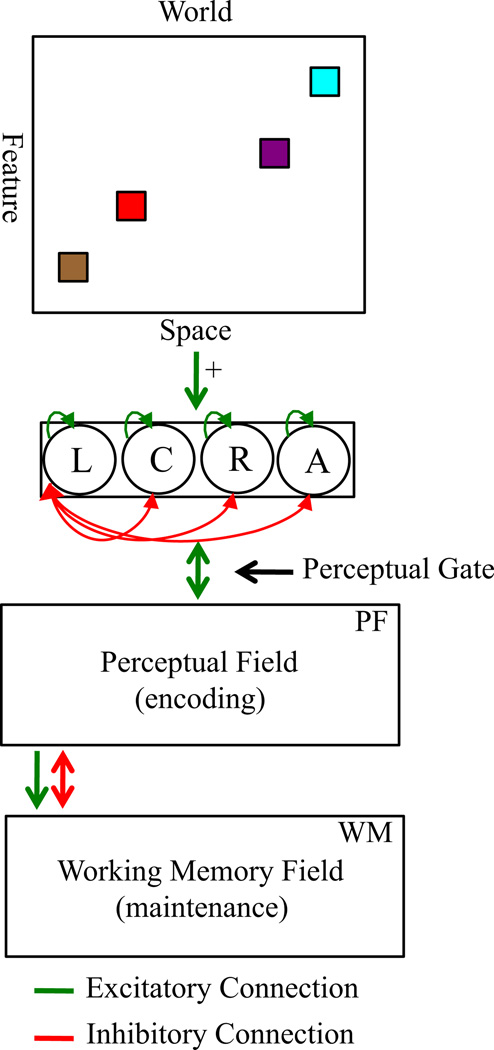
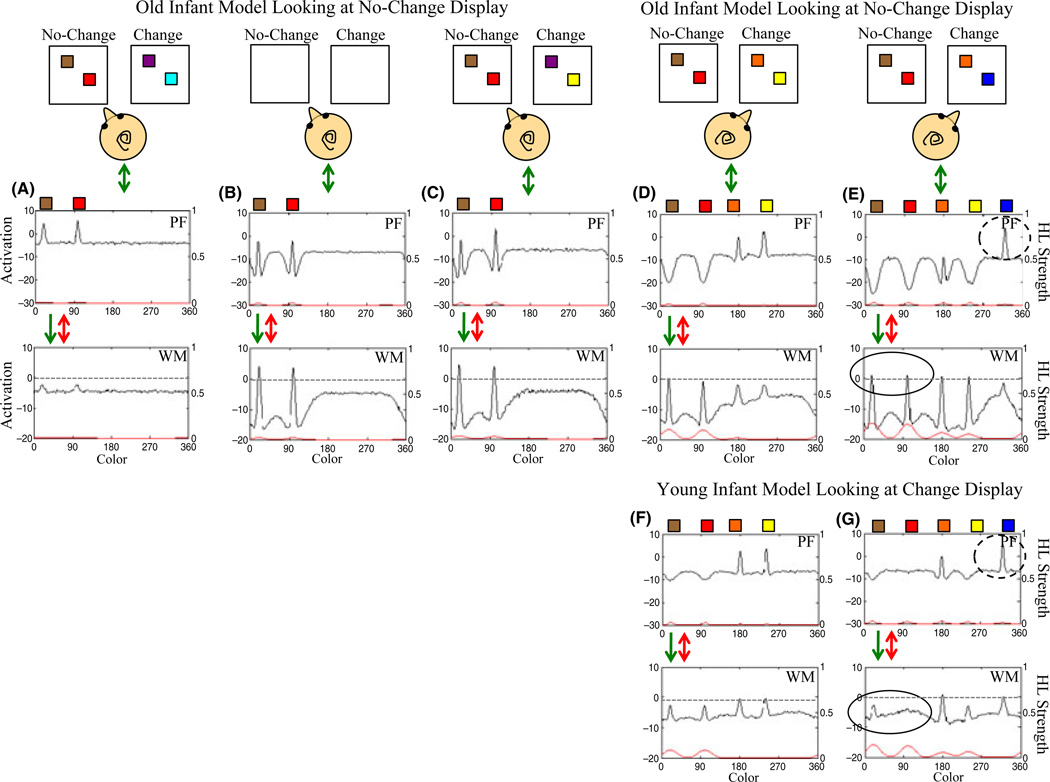
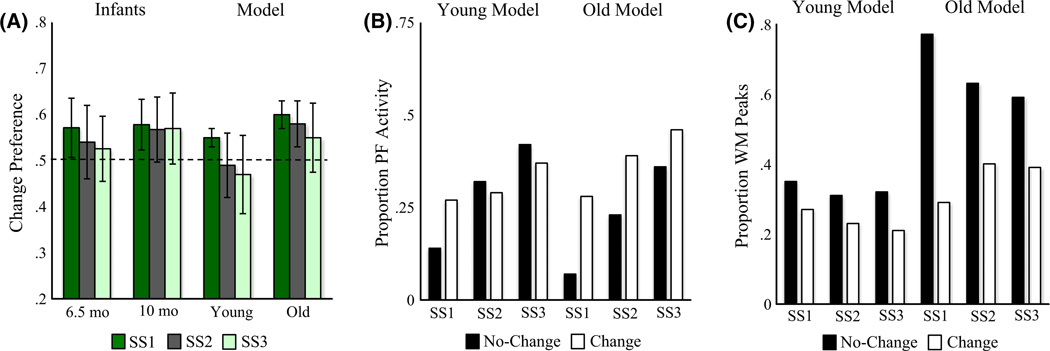
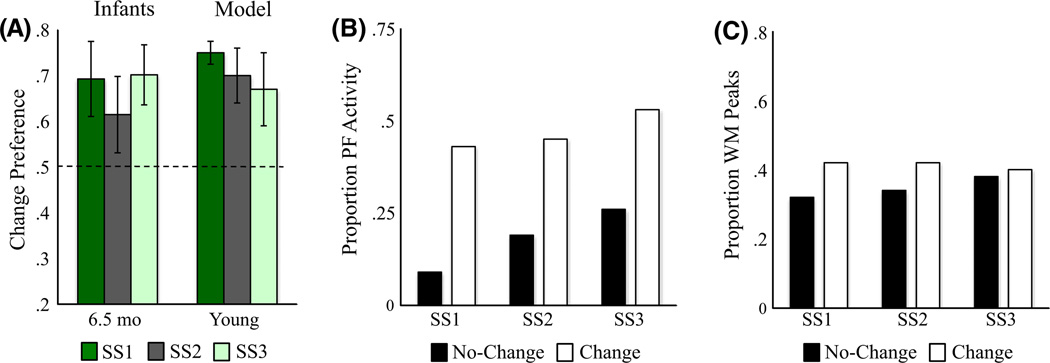
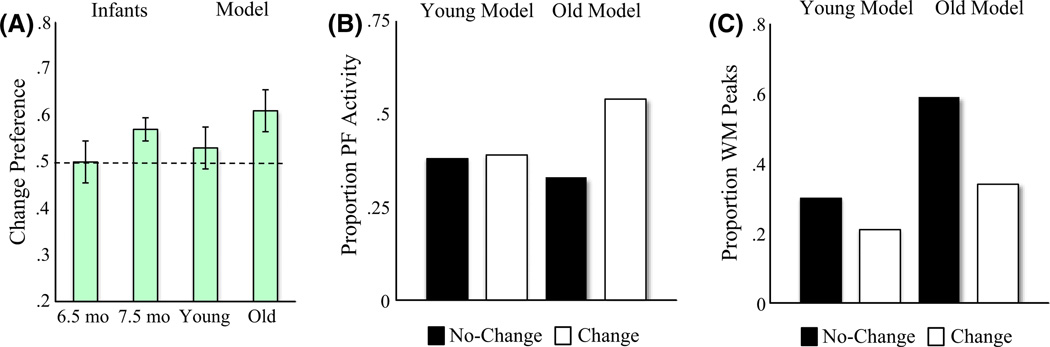
Visual working memory (VWM) capacity has been studied extensively in adults, and methodological advances have enabled researchers to probe capacity limits in infancy using a preferential looking paradigm. Evidence suggests that capacity increases rapidly between 6 and 10 months of age. To understand how the VWM system develops, we must understand the relationship between the looking behavior used to study VWM and underlying cognitive processes. We present a dynamic neural field model that captures both real-time and developmental processes underlying performance. Three simulation experiments show how looking is linked to VWM processes during infancy and how developmental changes in performance could arise through increasing neural connectivity. These results provide insight into the sources of capacity limits and VWM development more generally.


Figures

Figure 1
Figure 1
Behavioral tasks used to test capacity. (A) The change-detection task, which is used primarily with adults. (B) The change-preference task, modeled after the change-detection task for studying capacity in infants. (C) All-change condition.
Figure 2
Figure 2
DNF model architecture. The top panel shows the ‘world’ at which the model looks, which can contain the multiple features on the change and no-change displays at left and right locations in the task space. The presence of these displays signals to the fixation system that a stimulus is present in the task space (green ⊇ excitatory arrow to fixation system), biasing the system to look left or right (L = left; R = right; C = center; A = away). Fixating a display acts as a perceptual gate, allowing the metric details of the stimulus at the fixated location to excite neurons within the cognitive system (green bi-directional arrow). The cognitive system includes two excitatory layers, the perceptual field (PF) and working memory field (WM), which are coupled to an inhibitory layer (Inhib, not shown). Activity in PF sustains looking and also passes activation to WM (green arrow from PF to WM). Strong WM peaks suppress activity in PF via Inhib (red bi-directional arrow), weakening support for fixation. Activation in PF and WM is strengthened via Hebbian learning, which strengthens excitatory connections among previously active neurons. Functionally, this facilitates encoding in PF and the maintenance of items in WM.
Figure 3
Figure 3
Illustration of the mechanisms underlying change preferences and development. Panels A–E show the old infant model while looking at the no-change (A–C) and change (D–E) displays, and panels F–G show the young infant model while looking at the change display. Along the x-axis of PF and WM is the color value (in degrees). The left y-axis shows activation in PF and WM, and the right y-axis shows the Hebbian contributions to PF and WM. Initially, the old infant model is looking at the no-change display (A) and begins to encode and form WM peaks for the two items on the display. This supports fixation through activation in PF feeding excitation back to the fixation system. During the delay (B), the model is maintaining the items on the no-change display in WM. This inhibits associated neural sites in PF, which continues when the no-change display reappears (C) and leads to little support for fixation. When the model looks to the change display (D), it encodes the two items not held in memory. The related activity in PF supports fixation. When the change display reappears (E), one item has changed. The model encodes the novel item, continuing to support fixation. Note that the old model maintains items from the no-change display while looking at the change display. Stochastic looking between the two displays results in recognition of the items on the no-change display and encoding of novel items on the change display, giving rise to a change preference. For the young model, the processes of encoding items on the no-change and changes displays are comparable to the old infant model (see A–C). When the young model looks at the change display (F–G), however, the WM peaks maintaining the items from the no-change display spontaneously decay. This arises due to implementation of the Spatial Precision Hypothesis, specifically, weaker excitatory and inhibitory interactions for the young model. In contrast to the old model, the young model must re-encode items on the no-change display upon re-fixation. This leads to no preference across displays.
Figure 4
Figure 4
Results of Simulation Experiment 1. (A) Change preference scores for infants in Ross-Sheehy et al. (2003) Experiment 1 and our DNF model (error bars show one standard deviation). The x-axis shows the age of infants or developmental stage of the model, the y-axis shows change preference scores (chance = 0.50), and bars represent different set sizes. (B) The proportion of time strong activation (> .5) from PF is feeding into the fixation system while looking at the change (white bars) and no-change (black bars) displays relative to total looking across both displays, averaged across simulations. The x-axis shows set sizes separately for the young versus old model. (C) The proportion of WM peaks maintaining items across delays for the change (white bars) and no-change (black bars) displays, averaged across simulations. The x-axis shows set sizes separately for the young versus old model. Note that the maximum number of items that can be maintained for the no-change display is equal to the set size. As set size increases, the same proportion of items maintained in WM reflects a higher number of items. The maximum number of unique items that can be maintained for the change display is on average slightly less than the set size because, on each "blink", colors were randomly selected from a set of nine. Occasionally, one or more items present on the change display were also on the no-change, which were not included when calculating the number of items maintained for the change display.
Figure 5
Figure 5
Results of Simulation Experiment 2. Panels are the same as in Figure 4. Note that the proportion of WM peaks across SS1–3 for the no-change display is comparable to the proportion of WM peaks for the no-change display across SS1–3 in Simulation Experiment 1 for the same young infant model. However, the proportion of WM peaks for the change display increased, due both to the absence of a delay and a small bias to look at the change display (see text for additional details).
Figure 6
Figure 6
Results of Simulation Experiment 3. Panels are the same as in Figures 4 and 5.

References

    1. Abbott LF, Regehr WG. Synaptic computation. Nature. 2004;431:796–803. - PubMed
    1. Amari SI. Dynamics of pattern formation in lateral-inhibition type neural fields. Biological Cybernetics. 1977;27:77–87. - PubMed
    1. Baddeley AD. Working memory. New York: Oxford University Press; 1986.
    1. Bastian A, Schçner G, Riehle A. Preshaping and continuous evolution of motor cortical representations during movement preparation. European Journal of Neuroscience. 2003;18:2047–2058. - PubMed
    1. Cohen LB. Infant attention: an information processing approach. In: Weiss MJ, Zelazo PR, editors. Newborn attention: Biological constraints and the influence of experience. Norwood, NJ: Ablex; 1991. pp. 1–21.

Publication types