

Unit mass baseline resolution for an intact 148 kDa therapeutic monoclonal antibody by Fourier transform ion cyclotron resonance mass spectrometry
- PMID: 22011246
- PMCID: PMC3215840
- DOI: 10.1021/ac202429c
Unit mass baseline resolution for an intact 148 kDa therapeutic monoclonal antibody by Fourier transform ion cyclotron resonance mass spectrometry
Abstract
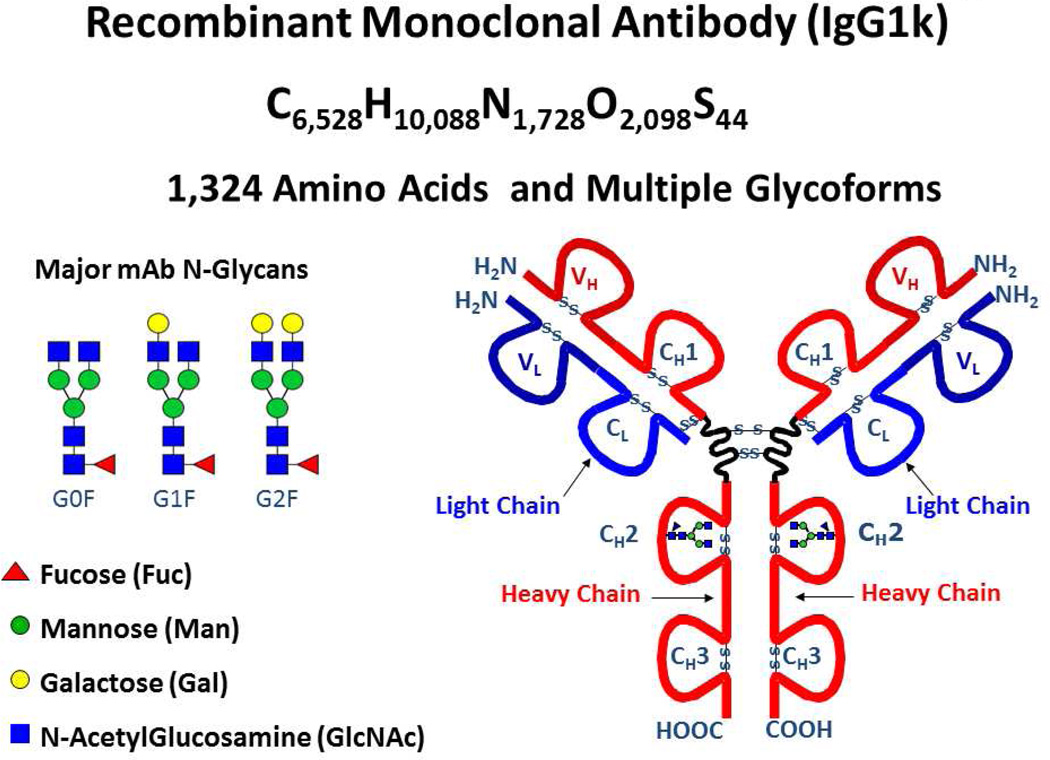
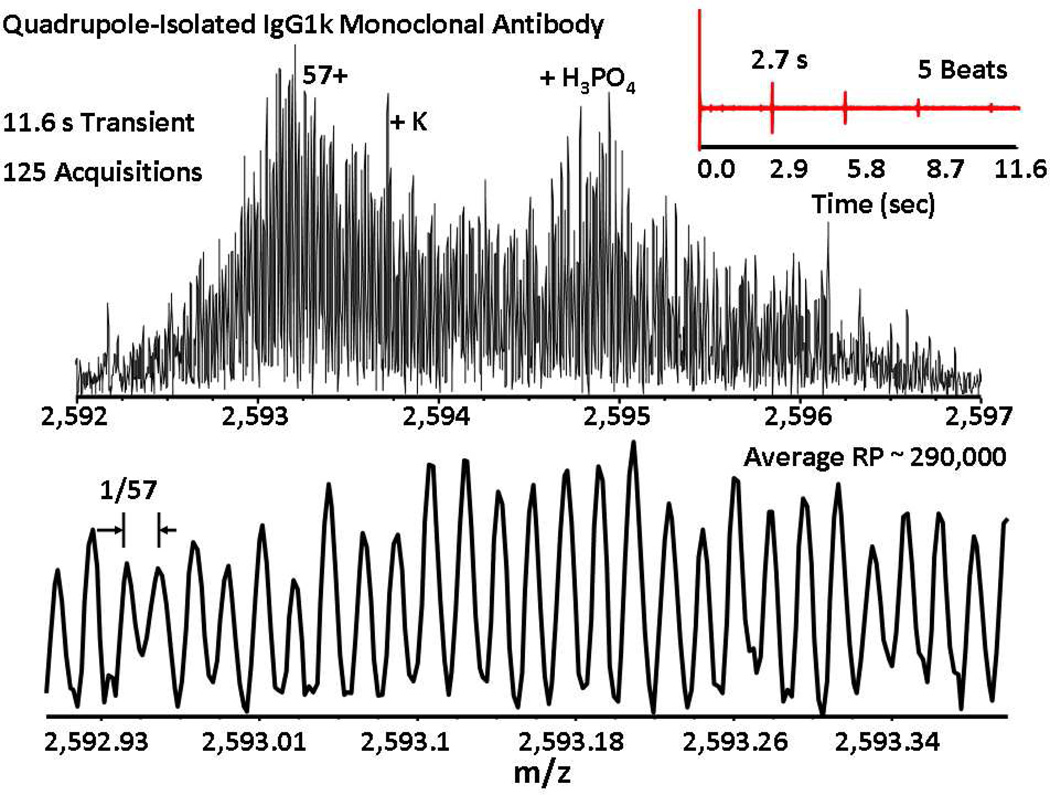
Fourier transform ion cyclotron resonance mass spectrometry (FTICR MS) provides the highest mass resolving power and mass measurement accuracy for unambiguous identification of biomolecules. Previously, the highest-mass protein for which FTICR unit mass resolution had been obtained was 115 kDa at 7 T. Here, we present baseline resolution for an intact 147.7 kDa monoclonal antibody (mAb), by prior dissociation of noncovalent adducts, optimization of detected total ion number, and optimization of ICR cell parameters to minimize space charge shifts, peak coalescence, and destructive ion cloud Coulombic interactions. The resultant long ICR transient lifetime (as high as 20 s) results in magnitude-mode mass resolving power of ~420,000 at m/z 2,593 for the 57+ charge state (the highest mass for which baseline unit mass resolution has been achieved), auguring for future characterization of even larger intact proteins and protein complexes by FTICR MS. We also demonstrate up to 80% higher resolving power by phase correction to yield an absorption-mode mass spectrum.
Figures


References
-
- Fenn JB, Mann M, Meng CK, Wong SF, Whitehouse CM. Science. 1989;246:64–71. - PubMed
-
- Marshall AG, Hendrickson CL, Jackson GS. Mass Spectrom. Rev. 1998;17:1–35. - PubMed
-
- Amster IJ. J. Mass Spectrom. 1996;31:1325–1337.
-
- Aebersold R, Mann M. Nature. 2003;422:198–207. - PubMed
-
- Wunschel DS, Pasa-Tolic L, Feng B, Smith RD. J. Am. Soc. Mass Spectrom. 2000;11:333–337. - PubMed
Publication types
MeSH terms
Substances
Grants and funding
LinkOut - more resources
Full Text Sources
