. 2011 Nov 1;108(44):18061-6.
doi: 10.1073/pnas.1114946108. Epub 2011 Oct 19.

Deletion of the de novo DNA methyltransferase Dnmt3a promotes lung tumor progression

Affiliations

Deletion of the de novo DNA methyltransferase Dnmt3a promotes lung tumor progression

Qing Gao et al. Proc Natl Acad Sci U S A. .

Abstract

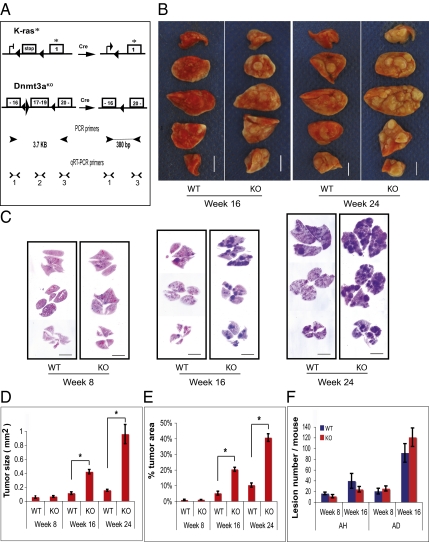
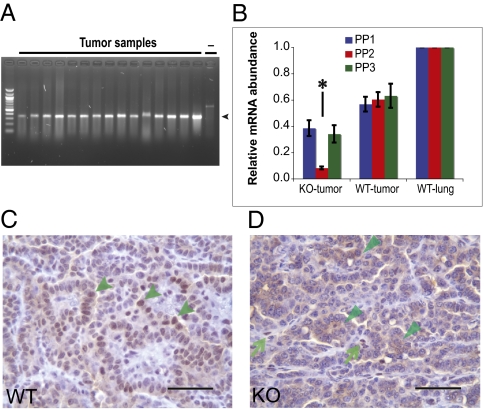
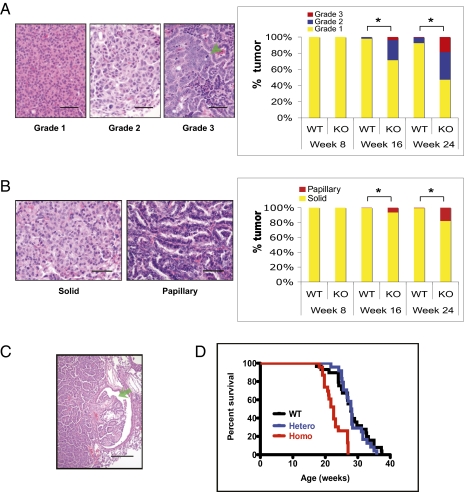
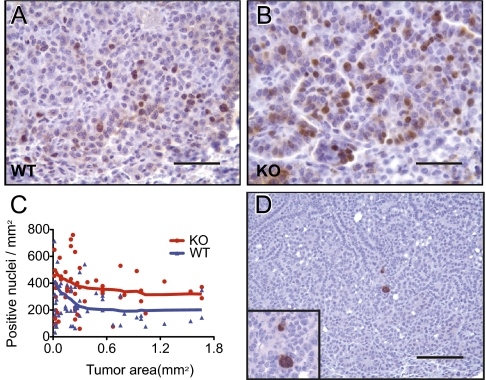
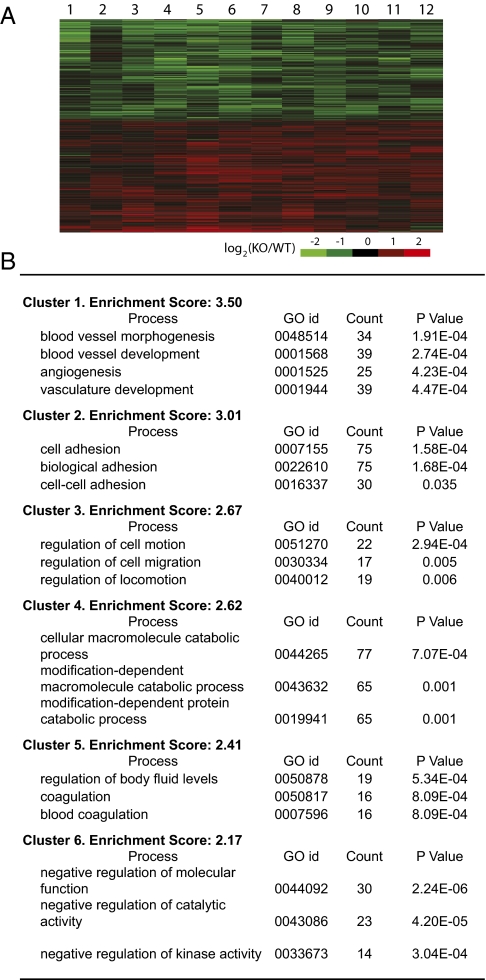
Alterations in DNA methylation have been associated with genome-wide hypomethylation and regional de novo methylation in numerous cancers. De novo methylation is mediated by the de novo methyltransferases Dnmt3a and 3b, but only Dnmt3b has been implicated in promoting cancer by silencing of tumor-suppressor genes. In this study, we have analyzed the role of Dnmt3a in lung cancer by using a conditional mouse tumor model. We show that Dnmt3a deficiency significantly promotes tumor growth and progression but not initiation. Changes in gene expression show that Dnmt3a deficiency affects key steps in cancer progression, such as angiogenesis, cell adhesion, and cell motion, consistent with accelerated and more malignant growth. Our results suggest that Dnmt3a may act like a tumor-suppressor gene in lung tumor progression and may be a critical determinant of lung cancer malignancy.


Conflict of interest statement

The authors declare no conflict of interest.

Figures

Fig. 1.
Fig. 1.
Dnmt3a deficiency accelerates lung tumor growth in K-rasG12D mice. (A) Schematic representation of the engineered locus in K-ras conditional knock-in and Dnmt3a conditional deletion mice before and after Cre-mediated recombination (modified from refs. and 21). Positions of the PCR primers to detect recombination and the positions of three pairs of qRT-PCR primers to detect Dnmt3a mRNA expression are also indicated. stop, silencing element; boxed numerals indicate exon and its number. *G12D mutation; left-pointing black triangle indicates loxP site; right-pointing black triangle indicates frt site; arrowheads indicate PCR primers; > and < indicate qRT-PCR primers. (B) Tumors in lungs of Dnmt3a-deficient mice were significantly larger than those in Dnmt3a WT mice at weeks 16 and 24 after Ad-Cre infection. (Scale bar: 5 mm.) (C) Representative H&E-stained sections of lungs in Dnmt3a-deficient and WT mice at weeks 8, 16, and 24 after Ad-Cre infection. The tumors are seen as blue areas because of crowded nuclei stained blue by hematoxylin. Dnmt3a-deficient mice had an increased number of large tumors. (Scale bar: 6 mm.) (D and E) Comparison of tumor size (area) and fraction of lung area occupied by tumors. Both tumor size and tumor area fraction were significantly larger in Dnmt3a-deficient mice than in WT mice at weeks 16 and 24. *Comparisons that are significantly different. (Tumor size: wk 16, P < 0.0001; wk 24, P = 0.0012; tumor area fraction at weeks 16 and 24, P < 0.0001). (F) Comparison of number of tumor (adenoma and adenocarcinoma; AD) and atypical adenomatous hyperplasia (AH) at weeks 8 and 16. No significant difference was detected; n = 4 for both Dnmt3a KO and WT at weeks 8 and 24; n = 5 for both KO and WT mouse at week 16. Error bars indicate SEM.
Fig. 2.
Fig. 2.
Deletion and expression of Dnmt3a. (A) The targeted segment of Dnmt3a is deleted in Dnmt3a-deficient tumors. The expected 380-bp recombination bands (arrowhead) were detected in all tumors tested (40 tumors from nine Dnmt3a-KO mice). Dash indicates negative control. (B) Relative Dnmt3a mRNA abundance by qRT-PCR. Primer pairs (PP) 1 to 3 are located to the 5′ side, within, and to the 3′ side of the targeted deletion, respectively (Fig. 1A). Primer pair 2, which detects the segment removed in the deleted mRNA, gave a significantly lower signal (asterisk) in Dnmt3a-deficient tumors than those in normal lungs and WT tumors (P < 0.0001), indicating efficient deletion of the targeted segment. Primer pairs 1 and 3 detected a relatively high level of Dnmt3a mRNA in Dnmt3a-deficient tumors, suggesting production of a shortened Dnmt3a mRNA. Tumor numbers: KO, n = 19; WT, n = 20. Error bar indicates SEM. (C and D) Immunohistochemical staining for Dnmt3a protein with an Ab recognizing the aminoterminal region of Dnmt3a. In WT tumors (C), positive cells showed strong nuclear staining (indicated by arrowheads) with weak cytoplasmic signals, whereas in Dnmt3a-KO tumor cells (D), no typical nuclear signal was detected, with only occasional weak cytoplasmic staining (indicated by arrowheads). Strong nuclear signals were observed in 78 of 170 WT tumors (n = 6 mice) and no typical nuclear staining was detected in 160 Dnmt3a-KO tumors (n = 6 mice). Also note that some stromal cells in Dnmt3a-deficient tumor tissue display nuclear signals indicated by arrows (D). (Scale bar: 50 μm.)
Fig. 3.
Fig. 3.
Dnmt3a deficiency leads to more advanced tumors. (A) Dnmt3a-deficient mice had more grade 2 and grade 3 tumors than WT mice. Photomicrographs show the morphology of tumors of the three histological grades (arrowhead, mitotic figure). Bar graph demonstrates that Dnmt3a-deficient mice had a significantly higher percentage of grade 2 and 3 tumors at weeks 16 and 24 (week 16, P = 0.0019; week 24, P < 0.0001) and grade 3 tumors at week 24 (P = 0.0034). (B) Dnmt3a-deficient mice had more papillary tumors than WT mice. Photomicrographs show the morphology of solid and papillary growth pattern. Bar graph demonstrates that Dnmt3a-deficient mice had a significantly higher percentage of papillary tumors at weeks 16 and 24 (week 16, P = 0.026; week 24, P = 0.0062); n = 4 for Dnmt3a KO and WT at week 8 and 24; n = 5 for KO and WT mice at week 16. (C) Representative section showing invasion into a bronchiole (arrow) in a Dnmt3a-deficient tumor. (D) Dnmt3a-deficient (i.e., homozygous KO) mice have a significantly shorter lifespan than Dnmt3a heterozygous and WT mice (P < 0.0001). No significant difference was detected between Dnmt3a heterozygous and WT mice (P = 0.63). WT, Dnmt3a WT, n = 29; Homo, Dnmt3a homozygous KO, n = 23; Hetero, Dnmt3a heterozygous, n = 24. *Comparisons that are significantly different (at aforementioned P values). Photomicrographs show H&E staining. (Scale bars: A and B, 50 μm; C, 200 μm.)
Fig. 4.
Fig. 4.
Dnmt3a-deficient tumors have a higher proliferation index. (A and B) Representative photomicrographs of immunohistochemical staining for the proliferation marker Ki-67 in Dnmt3a WT (A) and KO mice (B). The positive signal localizes to the nuclei. (C) Plotting of proliferation index (positive nuclei/mm2) against tumor size (mm2). Dnmt3a-deficient tumors had a significantly higher proliferation index compared with WT tumors (P = 0.0006; the proliferation index was also influenced by tumor size, P = 0.032). (D) Representative photomicrograph of immunohistochemical staining for the apoptosis marker cleaved caspase-3 shows that positive cells are rare in Dnmt3a-deficient and WT tumors. (Inset) Details of two positive cells with cytoplasmic staining. (Scale bars: A and B, 50 μm; C, 200 μm.)
Fig. 5.
Fig. 5.
Gene expression in Dnmt3a-deficient and WT tumor. (A) Global expression profiling using whole mouse-genome microarrays. Heat map shows the top 1,967 differentially expressed genes between Dnmt3a-deficient and WT tumors (FDR < 0.05). Columns represent 12 matched KO/WT tumor pairs, and rows differentially expressed genes. (B) Gene enrichment analysis of the differentially expressed genes (FDR < 0.05) by the functional annotation tool in the Database for Annotation, Visualization, and Integrated Discovery using default thresholds. Shown are the top six clusters in biological process. Only the top three annotation terms are shown in cluster 4–6.

References

    1. Feinberg AP. Phenotypic plasticity and the epigenetics of human disease. Nature. 2007;447:433–440. - PubMed
    1. Jones PA, Baylin SB. The epigenomics of cancer. Cell. 2007;128:683–692. - PMC - PubMed
    1. Gaudet F, et al. Induction of tumors in mice by genomic hypomethylation. Science. 2003;300:489–492. - PubMed
    1. Chen RZ, Pettersson U, Beard C, Jackson-Grusby L, Jaenisch R. DNA hypomethylation leads to elevated mutation rates. Nature. 1998;395:89–93. - PubMed
    1. Sharma S, Kelly TK, Jones PA. Epigenetics in cancer. Carcinogenesis. 2010;31:27–36. - PMC - PubMed

Publication types

Associated data