. 2011 Oct 19:5:169.
doi: 10.1186/1752-0509-5-169.

Removing bias against membrane proteins in interaction networks

Affiliations

Removing bias against membrane proteins in interaction networks

Glauber C Brito et al. BMC Syst Biol. .

Abstract

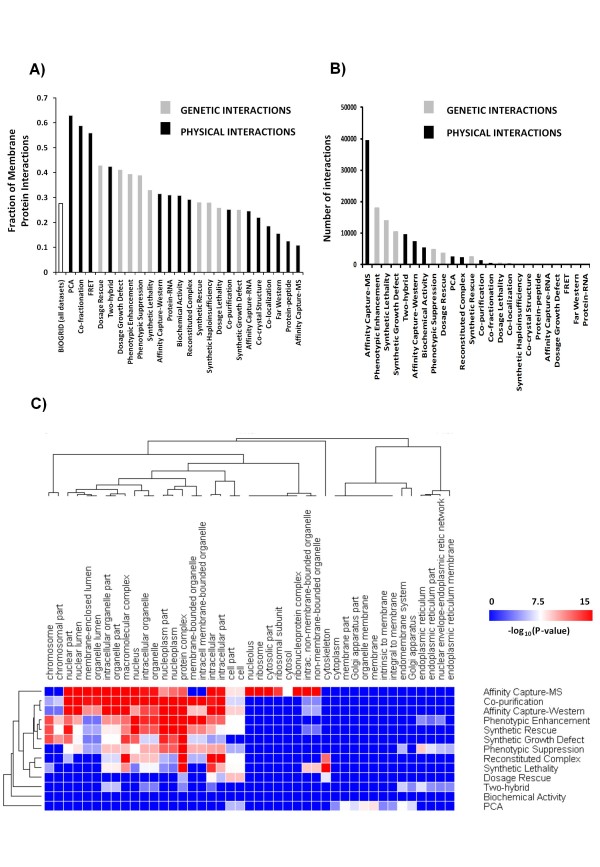
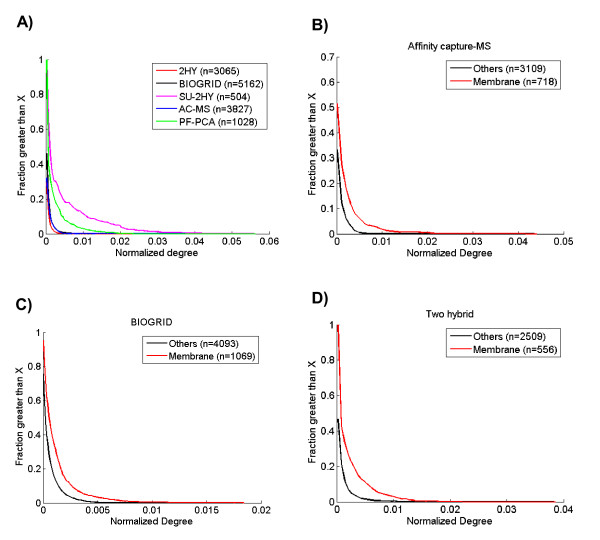
Background: Cellular interaction networks can be used to analyze the effects on cell signaling and other functional consequences of perturbations to cellular physiology. Thus, several methods have been used to reconstitute interaction networks from multiple published datasets. However, the structure and performance of these networks depends on both the quality and the unbiased nature of the original data. Due to the inherent bias against membrane proteins in protein-protein interaction (PPI) data, interaction networks can be compromised particularly if they are to be used in conjunction with drug screening efforts, since most drug-targets are membrane proteins.

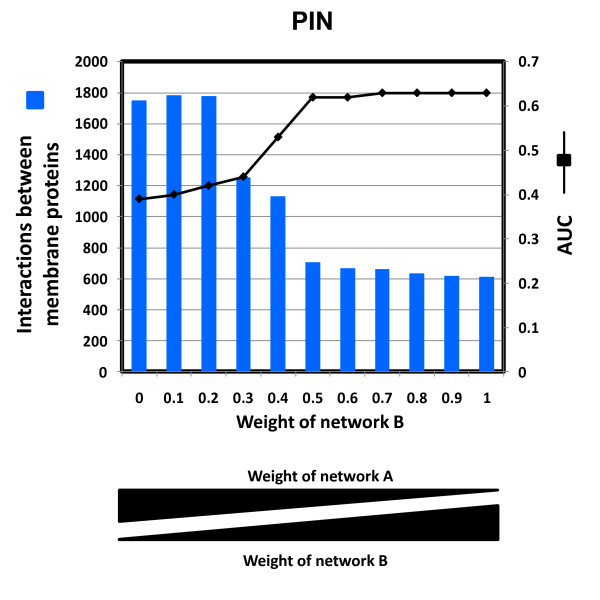
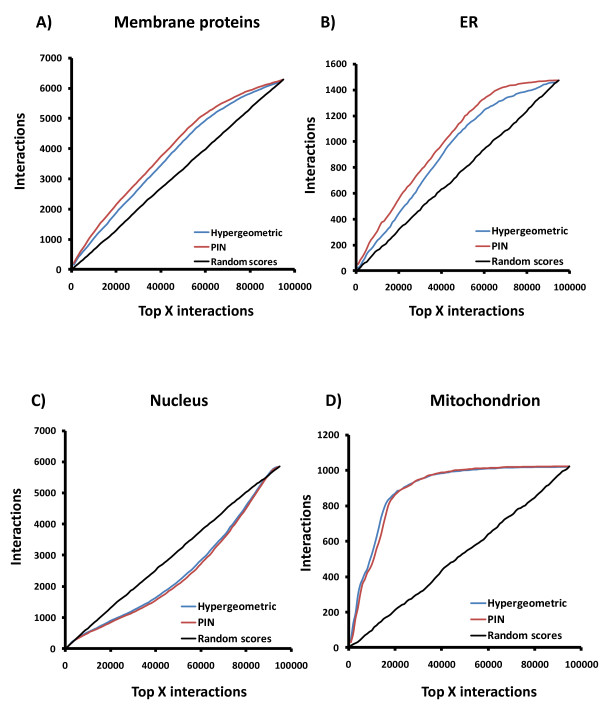
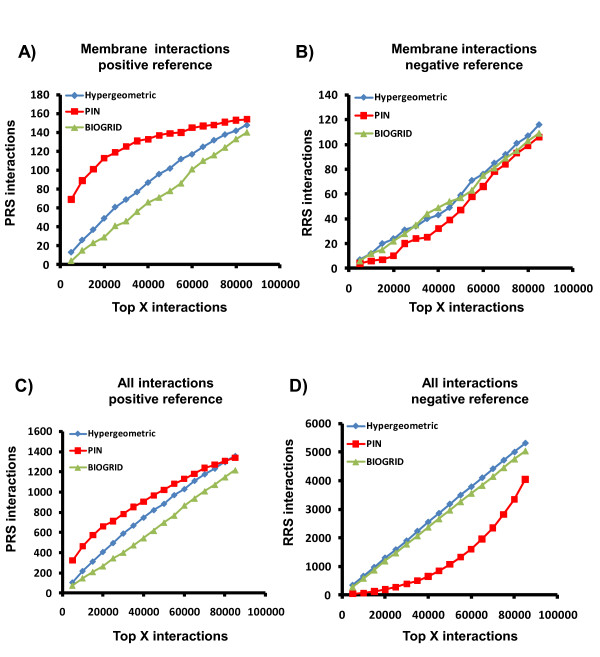
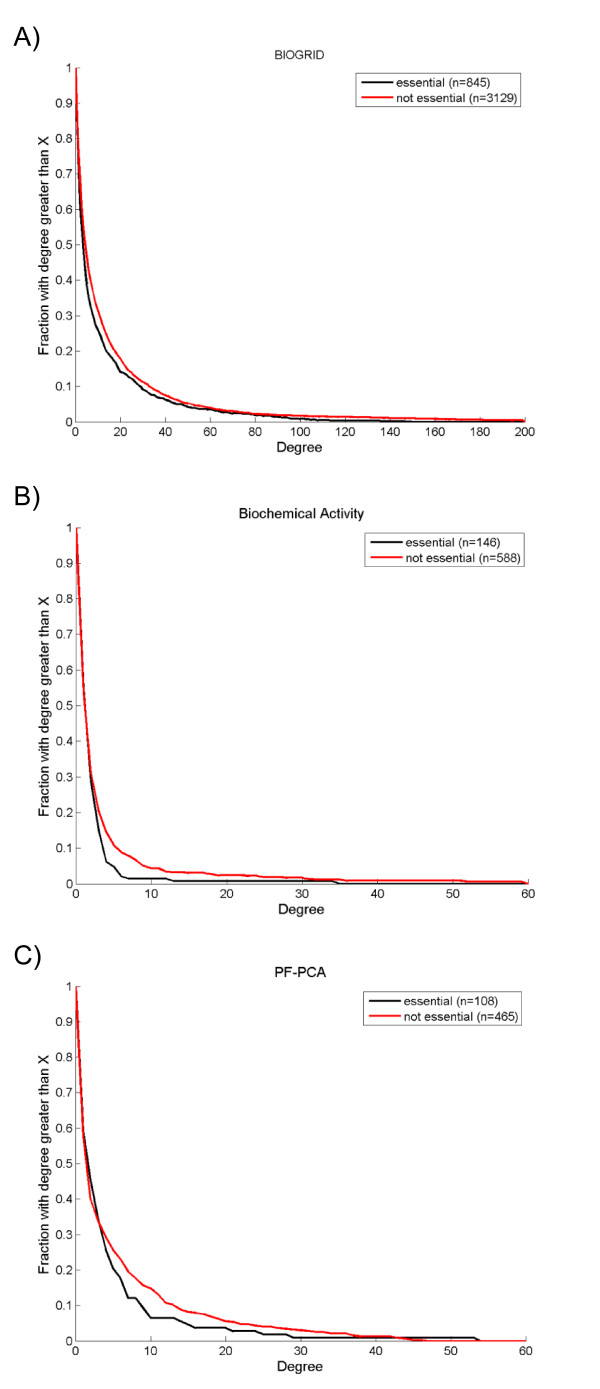
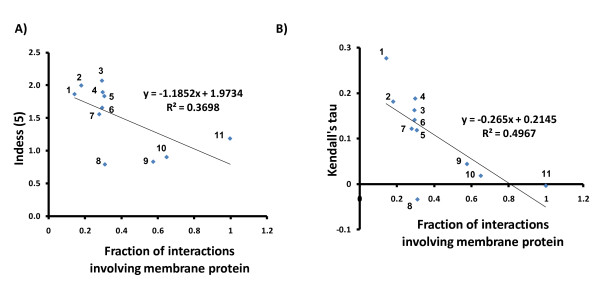
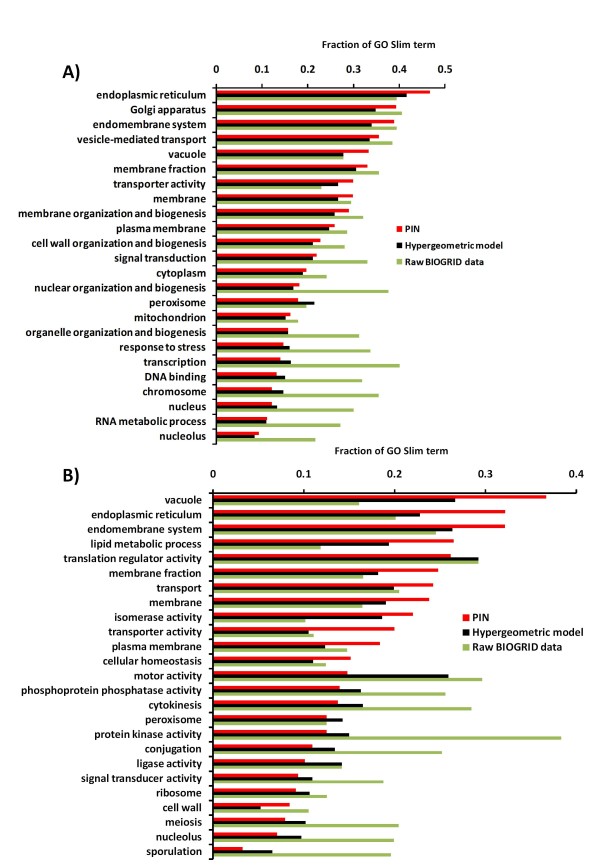
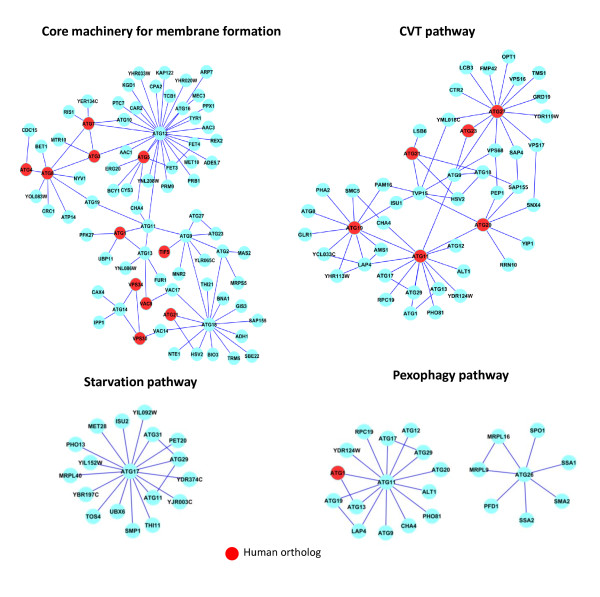
Results: To overcome the experimental bias against PPIs involving membrane-associated proteins we used a probabilistic approach based on a hypergeometric distribution followed by logistic regression to simultaneously optimize the weights of different sources of interaction data. The resulting less biased genome-scale network constructed for the budding yeast Saccharomyces cerevisiae revealed that the starvation pathway is a distinct subnetwork of autophagy and retrieved a more integrated network of unfolded protein response genes. We also observed that the centrality-lethality rule depends on the content of membrane proteins in networks.

Conclusions: We show here that the bias against membrane proteins can and should be corrected in order to have a better representation of the interactions and topological properties of protein interaction networks.


Figures

Figure 1
Figure 1
Interactions involving membranes are under-represented in the BIOGRID database. A) Fraction of the interactions identified using the method specified (below the bars) that involve at least one membrane protein. B) The total number of interactions reported by the method specified. C) Identification of ontology defined cell compartments that are over-represented by different methods for capturing interaction data. The extent of over-representation for different ontology defined cell compartments was quantified using BINGO for the specified methods. The cell compartments and methods were hierarchically clustered according to enrichment (P-values). Many of the over-represented compartments (red) relate to nuclear localization.
Figure 2
Figure 2
Membrane associated interactions have a higher normalized node degree than other nodes in yeast. A) Comparison of the cumulative distribution of normalized degree for membrane associated and other nodes from different datasets. Datasets with a higher proportion of membrane associated interactions (PF-PCA and SU-2HY) have higher normalized node degree. B-D) Comparison of membrane nodes with other nodes within single datasets B) Affinity capture-MS, C) BIOGRID, D) Two hybrid used to generate interaction data. 2HY, Two hybrid; BIOGRID, raw data from BIOGRID; SU-2HY, Split-ubiquitin two hybrid; AC-MS, Affinity capture-mass spectrometry; PF-PCA, protein-fragment complementation assay. Between parentheses is the number of nodes.
Figure 3
Figure 3
Optimization of the weighting of the two networks in PIN. A) PIN was constructed by the optimized combination of two networks: A (enriched in membrane interactions) and B (the rest of BIOGRID). The Area Under Curve (AUC) of Precision-Recall plots for the top 5,000 interactions was used for selecting the optimum weight for network B using membrane proteins from GO Slim as an established benchmark dataset. The AUC was calculated for different weights for network B, and the weight corresponding to highest prediction performance and higher number of membrane interactions (AUC = 0.62) was chosen (weight of network B = 0.5). The increased coverage of membrane interactions reflected as the weight of network A (B) in the logistic regression is increased (decreased).
Figure 4
Figure 4
PIN increases the proportion of membrane associated interactions in the network compared to a hypergeometric model or random scoring. Coverage of interactions by PIN in different cell compartments: A) Membranes, All membranes; B) ER, endoplasmic reticulum; C) Nucleus; D) Mitochondrion.
Figure 5
Figure 5
PIN provides higher coverage of authentic interactions and increased rejection of spurious interactions. A) PIN (RED) permits Identification of more positive reference set (PRS) membrane interactions than the Hypergeometric (blue) and BIOGRID (green) networks. B) PIN rejects Identification of slightly more random reference set (RRS) membrane interactions than the Hypergeometric and BIOGRID networks. C) PIN permits Identification of more positive reference set (PRS) interactions than the Hypergeometric model and BIOGRID networks. D) PIN rejects identification of more random reference set (RRS) interactions than the Hypergeometric and BIOGRID networks.
Figure 6
Figure 6
Contrary to the centrality-lethality rule, the distribution of degree for membrane associated genes is similar or higher for non-essential compared to essential nodes. Membrane associated genes were identified in each dataset by Gene Ontology and divided into essential (black) and not-essential (red) gene sets. Each plot shows the cumulative distribution of node degree for a network constructed using interaction data from the technique specified. A) BIOGRID, B) Biochemical Activity, C) PF-PCA. Between parentheses is the number of nodes.
Figure 7
Figure 7
Membrane associated gene interaction data does not support the centrality-lethality rule. A) The Indess (5), an ad hoc indicator of the centrality-lethality rule, is negatively correlated with the content of membrane interactions (Spearman correlation = -0.72, p = 0.012). Each data point represents a different PPI technique. B) The correlation between Kendall's tau, another ad hoc indicator of the centrality-lethality rule, and the content of membrane interactions using different techniques to generate interaction data (Spearman correlation = -0.83, p = 0.003). 1) Affinity capture - MS, 2) Colocalization, 3) Reconstituted complex, 4) Affinity capture - Western, 5) Affintiy capture - RNA, 6) Two hybrid, 7) Copurification, 8) Bioactivity, 9) Cofractionation, 10) PF-PCA, 11) SU-2HY.
Figure 8
Figure 8
Analysis of coverage of genes involved in unfolded protein response (UPR) and autophagy in PIN compared to hypergeometric and raw BIOGRID data. For the 13 GO Slim terms with the highest and lowest interactions with UPR or ATG genes in PIN, the fraction of GO Slim terms was compared for each network. We used the top 20% interactions in each network. A) The distribution of GO Slim terms suggests that for the UPR network, PIN has many fewer false positives than raw BIOGRID data (e.g. terms related to nucleus). B) The distribution of GO Slim terms suggests that for the ATG network PIN has many more true positives than the other methods and less false negatives than the raw BIOGRID data.
Figure 9
Figure 9
Autophagy networks identified in PIN. The nodes (cyan, red) were spread manually to ease visualization and identified with the corresponding SGD gene symbol. Yeast genes with identified corresponding human orthologs (red).

Similar articles

Cited by

References

    1. Tan S, Tan HT, Chung MC. Membrane proteins and membrane proteomics. Proteomics. 2008;8(19):3924–3932. doi: 10.1002/pmic.200800597. - DOI - PubMed
    1. Van Engelenburg SB, Palmer AE. Fluorescent biosensors of protein function. Current opinion in chemical biology. 2008;12(1):60–65. doi: 10.1016/j.cbpa.2008.01.020. - DOI - PubMed
    1. Moffat J, Sabatini DM. Building mammalian signalling pathways with RNAi screens. Nature reviews mol cell biol. 2006;7(3):177–187. doi: 10.1038/nrm1860. - DOI - PubMed
    1. Costanzo M, Baryshnikova A, Bellay J, Kim Y, Spear ED, Sevier CS, Ding H, Koh JL, Toufighi K, Mostafavi S. et al.The genetic landscape of a cell. Science. 2010;327(5964):425–431. doi: 10.1126/science.1180823. - DOI - PMC - PubMed
    1. Zhou X, Arita A, Ellen TP, Liu X, Bai J, Rooney JP, Kurtz AD, Klein CB, Dai W, Begley TJ. et al.A genome-wide screen in Saccharomyces cerevisiae reveals pathways affected by arsenic toxicity. Genomics. 2009;94(5):294–307. doi: 10.1016/j.ygeno.2009.07.003. - DOI - PMC - PubMed

Publication types

MeSH terms

Substances

LinkOut - more resources