

Abuse risks and routes of administration of different prescription opioid compounds and formulations
- PMID: 22011626
- PMCID: PMC3213066
- DOI: 10.1186/1477-7517-8-29
Abuse risks and routes of administration of different prescription opioid compounds and formulations
Abstract
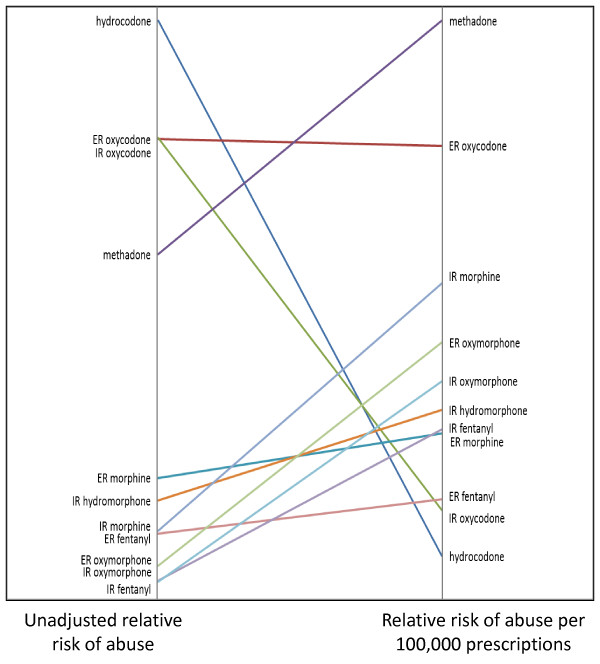
Background: Evaluation of tamper resistant formulations (TRFs) and classwide Risk Evaluation and Mitigation Strategies (REMS) for prescription opioid analgesics will require baseline descriptions of abuse patterns of existing opioid analgesics, including the relative risk of abuse of existing prescription opioids and characteristic patterns of abuse by alternate routes of administration (ROAs). This article presents, for one population at high risk for abuse of prescription opioids, the unadjusted relative risk of abuse of hydrocodone, immediate release (IR) and extended release (ER) oxycodone, methadone, IR and ER morphine, hydromorphone, IR and ER fentanyl, IR and ER oxymorphone. How relative risks change when adjusted for prescription volume of the products was examined along with patterns of abuse via ROAs for the products.
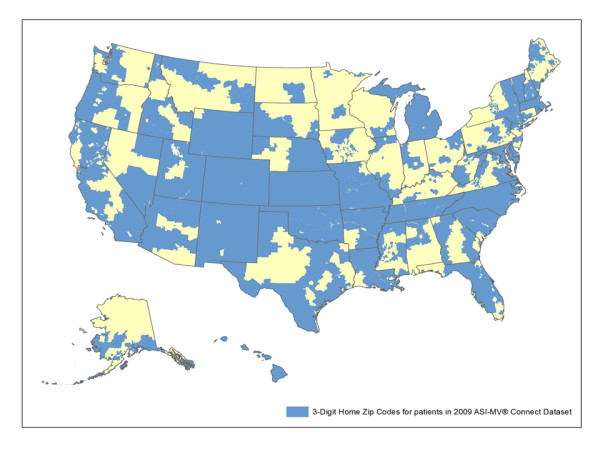
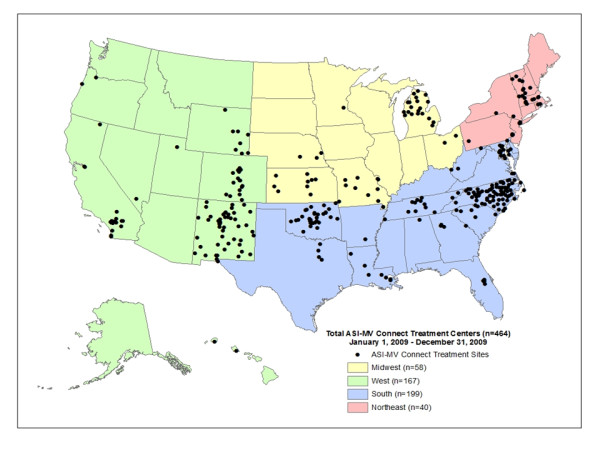
Methods: Using data on prescription opioid abuse and ROAs used from 2009 Addiction Severity Index-Multimedia Version (ASI-MV®) Connect assessments of 59,792 patients entering treatment for substance use disorders at 464 treatment facilities in 34 states and prescription volume data from SDI Health LLC, unadjusted and adjusted risk for abuse were estimated using log-binomial regression models. A random effects binary logistic regression model estimated the predicted probabilities of abusing a product by one of five ROAs, intended ROA (i.e., swallowing whole), snorting, injection, chewing, and other.
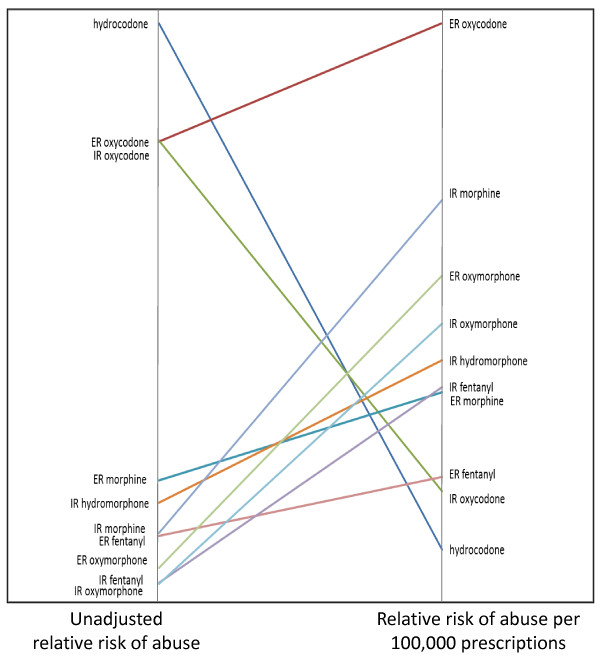
Results: Unadjusted relative risk of abuse for the 11 compound/formulations determined hydrocodone and IR oxycodone to be most highly abused while IR oxymorphone and IR fentanyl were least often abused. Adjusting for prescription volume suggested hydrocodone and IR oxycodone were least often abused on a prescription-by-prescription basis. Methadone and morphine, especially IR morphine, showed increases in relative risk of abuse. Examination of the data without methadone revealed ER oxycodone as the drug with greatest risk after adjusting for prescription volume. Specific ROA patterns were identified for the compounds/formulations, with morphine and hydromorphone most likely to be injected.
Conclusions: Unadjusted risks observed here were consistent with rankings of prescription opioid abuse obtained by others using different populations/methods. Adjusted risk estimates suggest that some, less widely prescribed analgesics are more often abused than prescription volume would predict. The compounds/formulations investigated evidenced unique ROA patterns. Baseline abuse patterns will be important for future evaluations of TRFs and REMS.
Figures
References
-
- Substance Abuse and Mental Health Services Administration. NSHUD Series H-36. Rockville, MD: Office of Applied Studies; 2009. Results from the 2008 National Survey on Drug Use and Health: National Findings.
-
- Centers for Disease Control and Prevention. Morbidity and Mortality Weekly Report. 2010.
-
- Centers for Disease Control and Prevention. Unintentional Drug Poisoning in the United States. 2010.
LinkOut - more resources
Full Text Sources
