. 2012 May;19(5):576-81.
doi: 10.1038/gt.2011.138. Epub 2011 Oct 20.

Bovine AAV transcytosis inhibition by tannic acid results in functional expression of CFTR in vitro and altered biodistribution in vivo

Affiliations

Bovine AAV transcytosis inhibition by tannic acid results in functional expression of CFTR in vitro and altered biodistribution in vivo

G Di Pasquale et al. Gene Ther. 2012 May.

Abstract

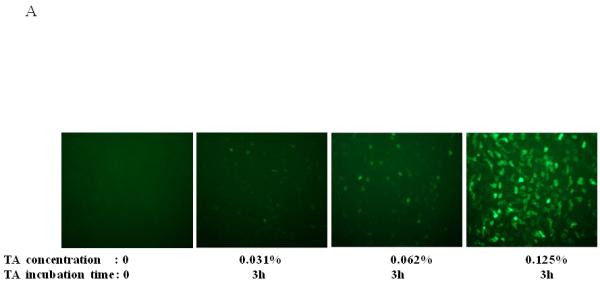
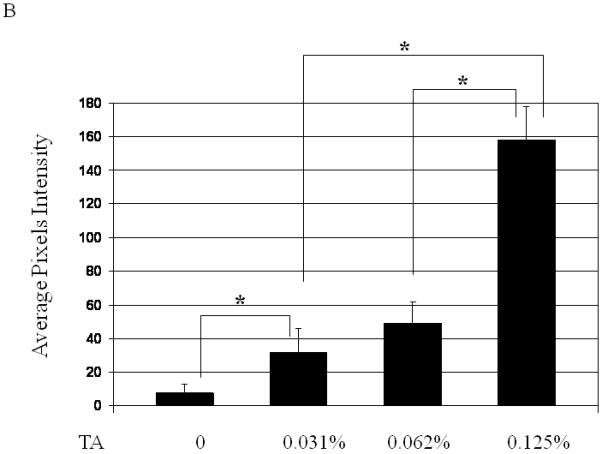
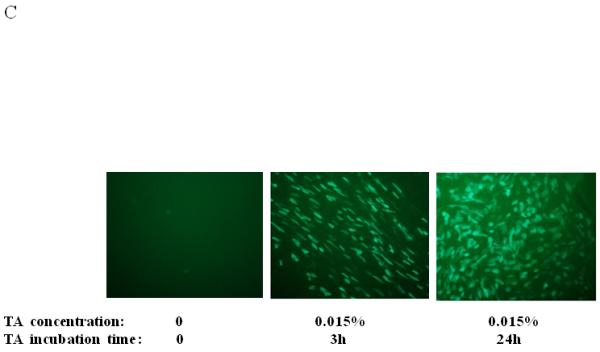
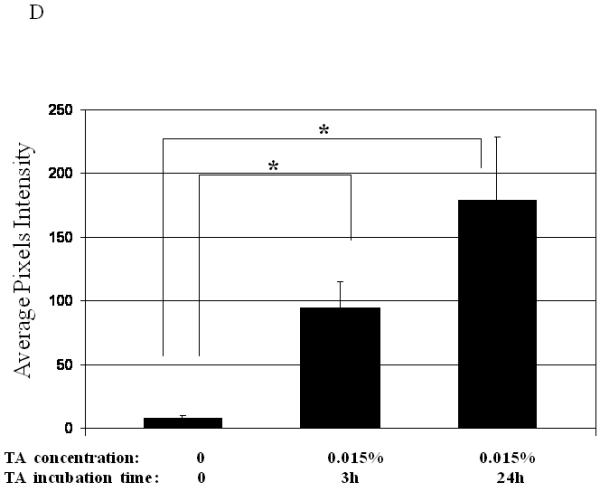
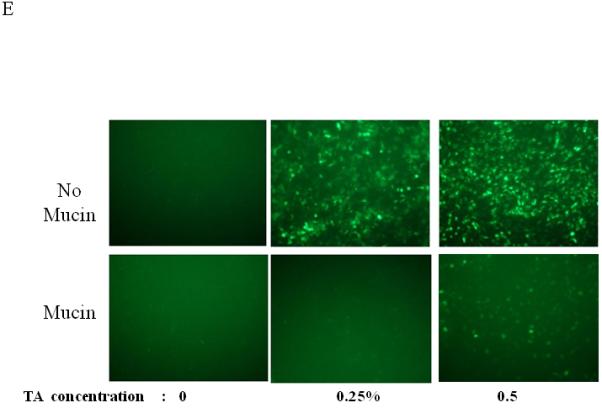
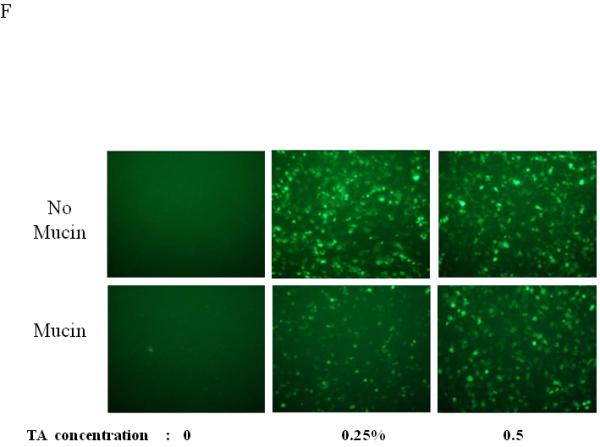
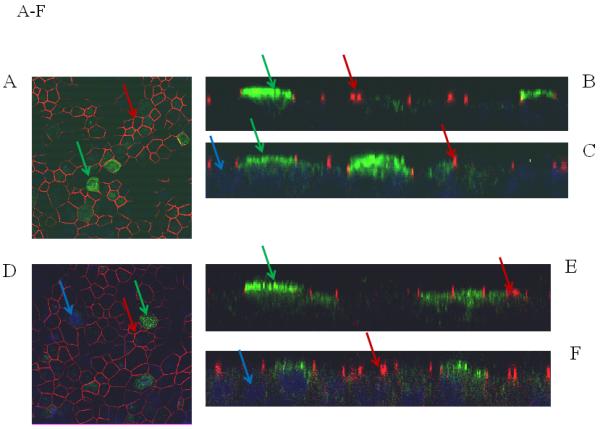
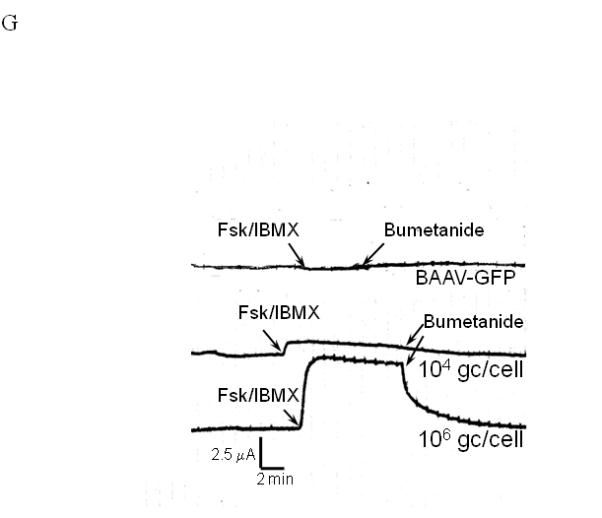
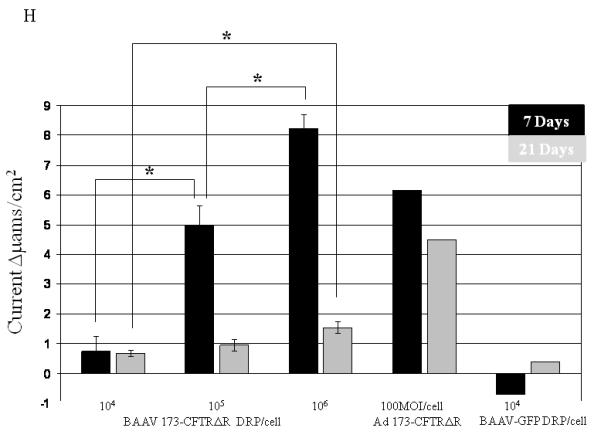
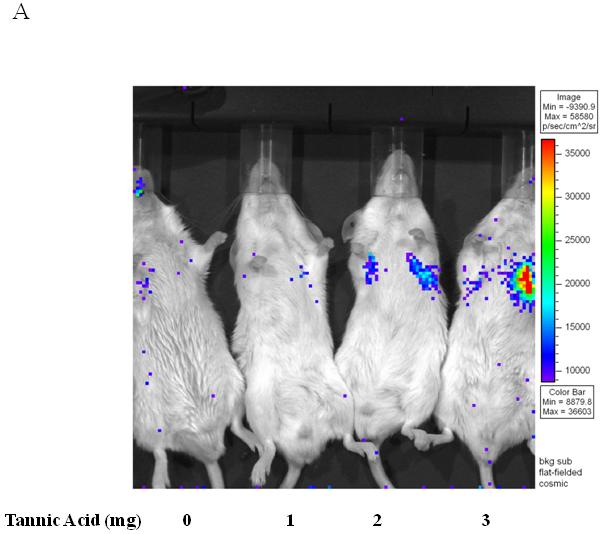
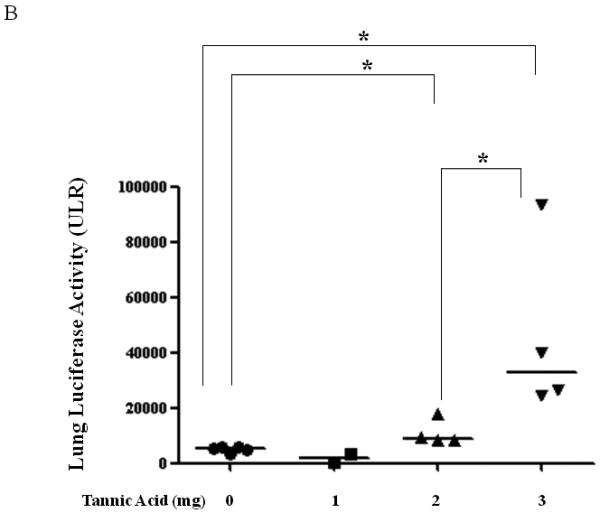
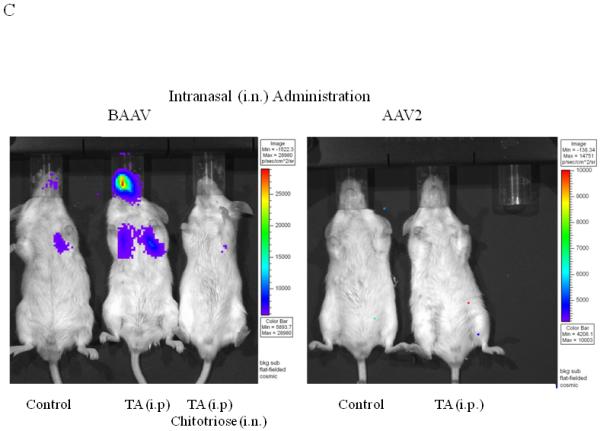
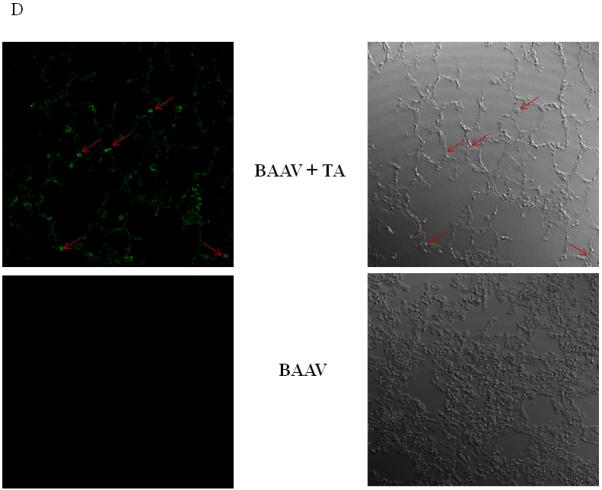
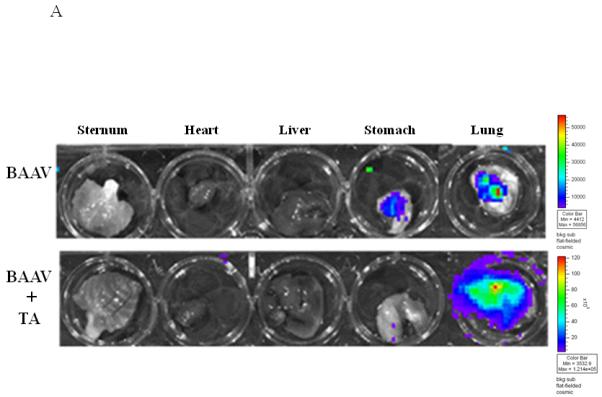
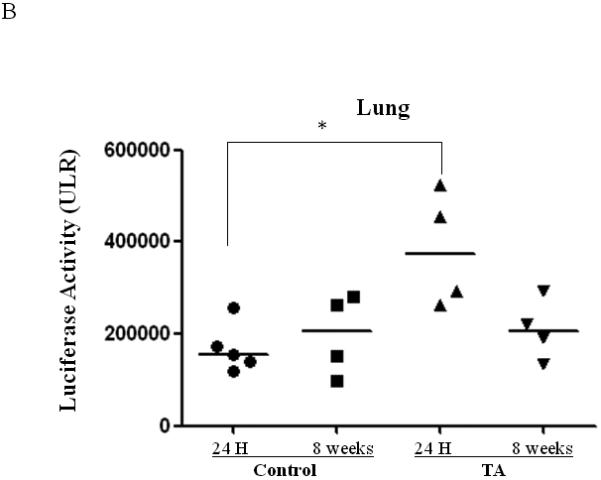
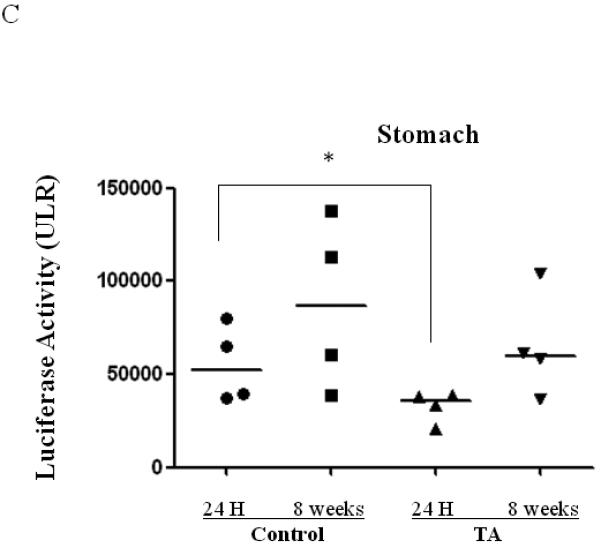
Bovine adeno-associated virus (BAAV) can enter a cell either through a transcytosis or transduction pathway. We previously demonstrated that particles entering via the transcytosis pathway can be redirected to transduce the cell by blocking particle exocytosis with tannic acid (TA). To investigate whether this approach is useful in lung gene therapy applications, we tested the effect of TA on BAAV transduction in cystic fibrosis airway epithelia in vitro, and in mouse lung in vivo. Our findings suggest that BAAV transcytosis can occur in vivo and that treatment with TA reduces transcytosis and increases lung transduction. TA treatment did not impair the sorting and the activity of the BAAV expressed cystic fibrosis transmembrane regulator membrane protein.


Figures

FIG. 1
FIG. 1
Dose, time and mucins effects on primary HAE BAAV TA mediated transduction. (A and B) Monolayer of differentiated HAE, plated in 6mm transwell filters, were incubated apically with 108 DNAse resistant particles (DRP) of BAAV-GFP and treated on the basolateral surface with 0, 0.031, 0.062 or 0.125, % w/v of TA for 3 hrs. 48 hrs post incubation, GFP positive cells were observed by fluorescent microscopy and fluorescence quantified using the ImageJ software. (C and D) As above, cells were incubated apically with BAAV-GFP but treated with 0.015% w/v of TA for 3 or 24 h respectively. 96 hrs later GFP positive cells were observed and quantified. (E, F and G) HAE cultures secreting mucins were extensively washed with cell medium or left untreated. BAAV was applied apically and cell treated on the basolateral surface with 0.25 or 0.5% w/v TA for 3 hrs. 48 (E) and 96 (F) hrs later positive cell were observed and quantified. N=2 in duplicate. Student’s t-test * (P value <0.05). Positive cells of 4 random fields in experiment A were also counted and similar fold changes compared with control were measured (data not shown).
FIG. 1
FIG. 1
Dose, time and mucins effects on primary HAE BAAV TA mediated transduction. (A and B) Monolayer of differentiated HAE, plated in 6mm transwell filters, were incubated apically with 108 DNAse resistant particles (DRP) of BAAV-GFP and treated on the basolateral surface with 0, 0.031, 0.062 or 0.125, % w/v of TA for 3 hrs. 48 hrs post incubation, GFP positive cells were observed by fluorescent microscopy and fluorescence quantified using the ImageJ software. (C and D) As above, cells were incubated apically with BAAV-GFP but treated with 0.015% w/v of TA for 3 or 24 h respectively. 96 hrs later GFP positive cells were observed and quantified. (E, F and G) HAE cultures secreting mucins were extensively washed with cell medium or left untreated. BAAV was applied apically and cell treated on the basolateral surface with 0.25 or 0.5% w/v TA for 3 hrs. 48 (E) and 96 (F) hrs later positive cell were observed and quantified. N=2 in duplicate. Student’s t-test * (P value <0.05). Positive cells of 4 random fields in experiment A were also counted and similar fold changes compared with control were measured (data not shown).
FIG. 2
FIG. 2
Immunostaining and current tracing of TA BAAV-CFTRΔR transduced CF HAE. Immunostaining of differentiated airway epithelia expressing BAAV-CFTRΔR (10×106 genomes (gc)/cell) (panels A-C) or ad5-CFTRΔR (100MOI) (D-F). Data are X-Y confocal images (B-C and E-F) or en face images (A and D). CFTR is shown in green, tight junction protein zonula occludens-1 (ZO-1) in red and indicated by arrows of the same color respectively. DAPI nuclear stain is in blue. (G) Current tracings of CF airway epithelia transduced with the indicated amounts of BAAV-173CMV-CFTRΔR (106 or 104 gc/cell). Millicells were treated sequentially with, amiloride (10−4M), forskolin (10−4M)/IBMX (10−5M), and bumetanide (10−4M) as indicated. Asterisk indicates a change in the recorder scale. (H) Bumetanide-sensitive forskolin-stimulated current (in μamps/cm2) in well-differentiated CF epithelia expressing the indicated amount of BAAV-CFTRΔR at 7 or 21 days post-transduction. N=3 for each AAV viral titer; N=1 for ad5-GFP control at 7 and 21 day time points. One-way ANOVA with Bonferroni post test * (P value <0.05).
FIG. 2
FIG. 2
Immunostaining and current tracing of TA BAAV-CFTRΔR transduced CF HAE. Immunostaining of differentiated airway epithelia expressing BAAV-CFTRΔR (10×106 genomes (gc)/cell) (panels A-C) or ad5-CFTRΔR (100MOI) (D-F). Data are X-Y confocal images (B-C and E-F) or en face images (A and D). CFTR is shown in green, tight junction protein zonula occludens-1 (ZO-1) in red and indicated by arrows of the same color respectively. DAPI nuclear stain is in blue. (G) Current tracings of CF airway epithelia transduced with the indicated amounts of BAAV-173CMV-CFTRΔR (106 or 104 gc/cell). Millicells were treated sequentially with, amiloride (10−4M), forskolin (10−4M)/IBMX (10−5M), and bumetanide (10−4M) as indicated. Asterisk indicates a change in the recorder scale. (H) Bumetanide-sensitive forskolin-stimulated current (in μamps/cm2) in well-differentiated CF epithelia expressing the indicated amount of BAAV-CFTRΔR at 7 or 21 days post-transduction. N=3 for each AAV viral titer; N=1 for ad5-GFP control at 7 and 21 day time points. One-way ANOVA with Bonferroni post test * (P value <0.05).
FIG. 3
FIG. 3
Lung TA mediated BAAV-Luc transduction in vivo. (A and B) BAAV-Luc (5.109 DRP) was administered to the lungs of 2-5 mice as indicated for each TA concentration tested, by nasal instillation. Transduction was imaged (A) 24 hrs later using a Xenogen camera 15 min following administration of luciferin substrate. (B) Luciferase activity was quantified 24 to72 hrs post BAAV administration, by Living Image (R), version 2.60.1. Medians represented by horizontal lines. Student’s t-test * P value <0.05. (C) BAAV or AAV2-Luc (5.109 DRP) was delivered to the lungs of mice via an intranasal route with or without chitotriose (20mg/ml). In the indicated mice, prior to vector delivery, mice were treated with TA as described above. Transduction was imaged 24 hrs later using a Xenogen camera 15 min following injection of luciferin. (D) Lungs of mice were removed 4 days post-transduction, inflated with agarose prior to imbedding in paraffin. Luciferase positive cells were detected by immunostaining and pseudocolored in green (left panel). The bright field image is shown on the right. Original magnification 63X.
FIG. 3
FIG. 3
Lung TA mediated BAAV-Luc transduction in vivo. (A and B) BAAV-Luc (5.109 DRP) was administered to the lungs of 2-5 mice as indicated for each TA concentration tested, by nasal instillation. Transduction was imaged (A) 24 hrs later using a Xenogen camera 15 min following administration of luciferin substrate. (B) Luciferase activity was quantified 24 to72 hrs post BAAV administration, by Living Image (R), version 2.60.1. Medians represented by horizontal lines. Student’s t-test * P value <0.05. (C) BAAV or AAV2-Luc (5.109 DRP) was delivered to the lungs of mice via an intranasal route with or without chitotriose (20mg/ml). In the indicated mice, prior to vector delivery, mice were treated with TA as described above. Transduction was imaged 24 hrs later using a Xenogen camera 15 min following injection of luciferin. (D) Lungs of mice were removed 4 days post-transduction, inflated with agarose prior to imbedding in paraffin. Luciferase positive cells were detected by immunostaining and pseudocolored in green (left panel). The bright field image is shown on the right. Original magnification 63X.
FIG. 4
FIG. 4
Biodistribution of i.n. administered BAAV–Luc. Four mice per group were injected with 200ul of PBS containing none or 3mg of TA prior to i.n. delivery of 5.109 DRP of BAAV-Luc. 24 hrs or 8 weeks post treatment respectively mice received luciferin substrate then were sacrificed and expression quantified. (A) Luciferase activity of representative mice receiving BAAV alone or BAAV+TA 24 hrs post transduction. (B and C) Average luciferase activity of whole lung or stomach respectively of mice receiving BAAV alone (control) or BAAV+TA (TA), 24 hrs or 8 weeks post treatment respectively. Medians represented by horizontal lines. Student’s t-test * P value <0.05.
FIG. 4
FIG. 4
Biodistribution of i.n. administered BAAV–Luc. Four mice per group were injected with 200ul of PBS containing none or 3mg of TA prior to i.n. delivery of 5.109 DRP of BAAV-Luc. 24 hrs or 8 weeks post treatment respectively mice received luciferin substrate then were sacrificed and expression quantified. (A) Luciferase activity of representative mice receiving BAAV alone or BAAV+TA 24 hrs post transduction. (B and C) Average luciferase activity of whole lung or stomach respectively of mice receiving BAAV alone (control) or BAAV+TA (TA), 24 hrs or 8 weeks post treatment respectively. Medians represented by horizontal lines. Student’s t-test * P value <0.05.

Similar articles

Cited by

References

    1. Di Pasquale G, Chiorini JA. AAV transcytosis through barrier epithelia and endothelium. Mol Ther. 2006;13(3):506–16. - PubMed
    1. Walters RW, Pilewski JM, Chiorini JA, Zabner J. Secreted and transmembrane mucins inhibit gene transfer with AAV4 more efficiently than AAV5. J Biol Chem. 2002;277(26):23709–13. - PubMed
    1. Polishchuk R, Di Pentima A, Lippincott-Schwartz J. Delivery of raft-associated, GPI-anchored proteins to the apical surface of polarized MDCK cells by a transcytotic pathway. Nat Cell Biol. 2004;6(4):297–307. - PubMed
    1. Yui N, Okutsu R, Sohara E, Rai T, Ohta A, Noda Y, et al. FAPP2 is required for aquaporin-2 apical sorting at trans-Golgi network in polarized MDCK cells. Am J Physiol Cell Physiol. 2009;297(6):C1389–96. - PubMed
    1. Ostedgaard LS, Rokhlina T, Karp PH, Lashmit P, Afione S, Schmidt M, et al. A shortened adeno-associated virus expression cassette for CFTR gene transfer to cystic fibrosis airway epithelia. Proc Natl Acad Sci U S A. 2005;102(8):2952–7. Epub 2005 Feb 9. - PMC - PubMed

Publication types

Substances