. 2012 Feb;132(2):401-9.
doi: 10.1038/jid.2011.317. Epub 2011 Oct 20.

Identification and characterization of tumor-initiating cells in human primary cutaneous squamous cell carcinoma

Affiliations

Identification and characterization of tumor-initiating cells in human primary cutaneous squamous cell carcinoma

Girish K Patel et al. J Invest Dermatol. 2012 Feb.

Abstract

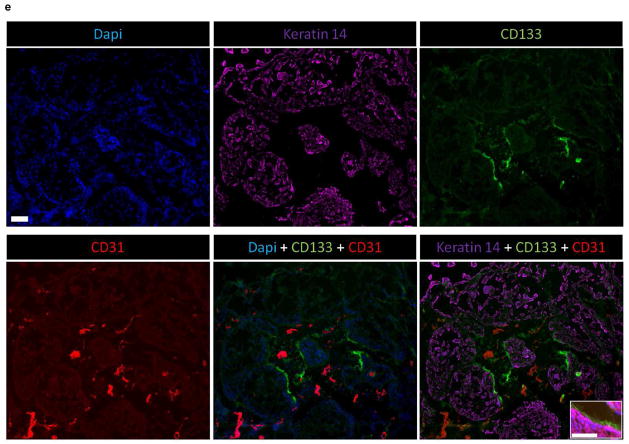
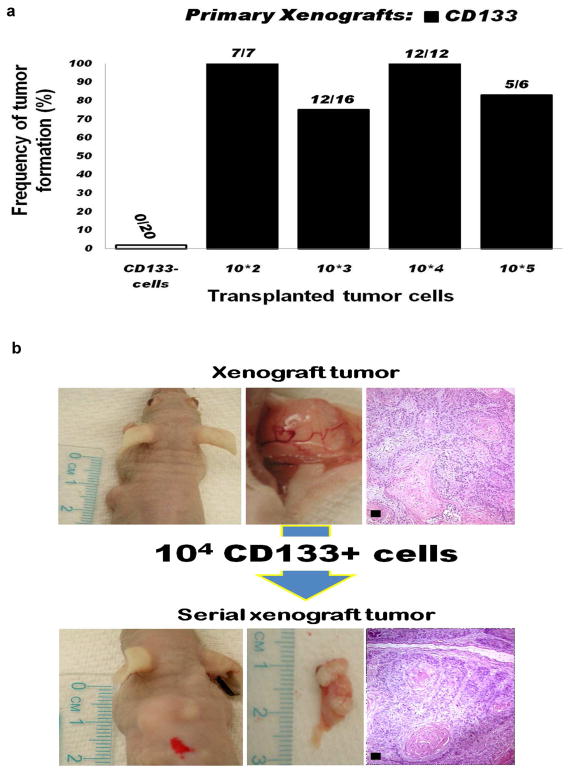
Primary human squamous cell carcinomas (SCCas) are heterogeneous invasive tumors with proliferating outer layers and inner differentiating cell masses. To determine if tumor-initiating cells (TICs) are present in SCCas, we utilized newly developed reliable in vitro and in vivo xenograft assays that propagate human SCCas, and demonstrated that a small subset of SCCa cells (∼1%) expressing Prominin-1 (CD133) in the outer layers of SCCas were highly enriched for TICs (∼1/400) compared with unsorted SCCa cells (TICs ∼1/10(6)). Xenografts of CD133+ SCCas recreated the original SCCa tumor histology and organizational hierarchy, whereas CD133- cells did not, and only CD133+ cells demonstrated the capacity for self-renewal in serial transplantation studies. We present a model of human SCCas in which tumor projections expand with outer leading edges that contain CD133+ TICs. Successful cancer treatment will likely require that the TICs identified in cancers be targeted therapeutically. The demonstration that TICs are present in SCCas and are enriched in a CD133- expressing subpopulation has not been, to our knowledge, previously reported.


Figures

Figure 1
Figure 1. Characterization of SCCa cellular subsets
a, Schematic of a primary human SCCa and stained section. Immunofluorescence of a SCCa tumor section labeled for, b, involucrin (green) and KI67 (purple), and c, CD71 (green), involucrin (red) and counterstained with DAPI (blue). d, FACS of primary human SCCa’s demonstrating cell surface marker expression together with isotype controls. The red arrows indicate the CD45 negative tumor subpopulation of interest. Also shown is a FACS plot of CD133 and CD71 of a CD45− subpopulation. e, Immunofluorescence of an SCCa section labeled with CD133 (green), CD31 (red), keratin 14 (purple) and DAPI (blue). All scale bars are 100 μm. f, CD133+ CD45− percentages from total cell suspensions derived from 32 different histological grades of primary human SCCa.
Figure 2
Figure 2. A CD133+ subpopulation in human SCCa with increased colony forming efficiency in vitro
a, A schematic showing how normal keratinocytes form adherent colonies while SCCa tumor keratinocytes form spheriodal colonies in our in vitro assay. b The number of colonies emerging from culture was dependent upon the number of cells plated. c, Spheroids were then dissociated and after cytospin onto a slide, were labeled with anti– pancytokeratin antibody, revealing the presence of keratinocytes within the spheroids. d, These cell culture colonies formed tumors, when xenografted onto the backs of prepared athymic nude mice. e, FACS for purity following magnetic bead separation (Macs) or FACS of CD133+ CD45− (red arrow) primary human squamous cell carcinoma subpopulations (above panels). FACS for purity of the CD71+ CD45− (red arrow, left panel) and CD71− CD45− (red arrow, right panel) sorted subpopulation (lower panels). f and g, CD133 sorted cells demonstrate a statistically significant increased colony forming efficiencies as compared to equivalent numbers of unsorted and CD133− sorted cells (n=6, the two experiments utilized different primary tumor samples) (p<0.01). h, Fold change in colony forming efficiencies for CD133+, CD133−, CD71+ and CD71− subpopulations compared with unfractionated SCCa controls.
Figure 3
Figure 3. Creation of a SCCa in-vivo xenograft model that can accurately recapitulate and propagate human SCCa
a, Successful generation of primary human SCCa xenografts from cell suspensions required pre-implantation of either a glass disc or a Gelfoam dressing, combined with 106 primary human fibroblasts suspended in Matrigel. After 14 days, SCCa tumor cells were combined with 106 primary human fibroblasts in Matrigel and implanted into either the Gelfoam dressing or the glass disc site. b, Xenograft tumor growth (n=82) following implantation of different doses of total unfractionated SCCa cells.
Figure 4
Figure 4. The CD133+ SCCa subpopulation is enriched for TIC
a, Xenograft tumor frequencies (n=42) after inoculation of CD133+ and CD133− sorted cells from 28 different primary human SCCa at varying doses, shown as a percentage and total. No xenograft tumors developed from SCCa CD133− cell suspensions (n=20; far left column) at doses of: 3×10⁶ (n=1), 2×10⁶ (n=1), 4×10⁵ (n=1), 2×10⁵ (n=1), 105 (n=16). b, Eight human SCCa xenografts were removed and CD133+ and CD133− cells were isolated for serial passage (secondary xenografts) into athymic nude mice. c, serial passage secondary xenograft tumor frequency (n=14) for CD133+ cells isolated from primary SCCa xenografts. No secondary xenograft tumors developed from CD133− sorted cells (n=8; far left column), despite doses of: 106 (n=2), 2×10⁵ (n=1), 105 (n=5).
Figure 5
Figure 5. Primary and secondary xenografts generated from CD133+ CD45− human SCCa cells resemble the original SCCa tumors
Parent tumor histologies are compared to both primary and secondary xenografts derived from implantation of CD133+ SCCa cells. The initial passage represents a xenograft generated from the injection of 104 CD133+ CD45− primary human SCCa cells. The secondary xenograft was generated from the injection 104 CD133+ SCCa cells isolated from the primary CD133+ CD45− xenograft. The histology of the three tumors shows a well to moderately differentiated SCCa. The immunohistochemical markers AE1/3, involucrin, KI67 (MIB-1), and p53 reveal comparable staining patterns in both the primary and secondary CD133+ CD45− xenografts, as compared to the parent tumor. All scale bars are 100 μm.

Comment in

Similar articles

Cited by

References

    1. Al-Hajj M, Wicha MS, Benito-Hernandez A, Morrison SJ, Clarke MF. Prospective identification of tumorigenic breast cancer cells. Proc Natl Acad Sci USA. 2003;100:3983–3988. - PMC - PubMed
    1. Benton EC, Kerr OA, Fisher A, Fraser SJ, McCormack SKA, Tidman MJ. The changing face of dermatological practice: 25 years’ experience. Br J Dermatol. 2008;159:413–418. - PubMed
    1. Bidlingmaier S, Zuy X, Liu B. The utility and limitations of glycosylated human CD133 epitopes in defining cancer stem cells. J Mol Med. 2008;86:1025–1032. - PMC - PubMed
    1. Boukamp P. Non-melanoma skin cancer: what drives tumor development and progression? Carcinogenesis. 2005;26:1657–1667. - PubMed
    1. Brash DE, Rudolph JA, Simon JA, Lin A, McKenna GJ, Baden HP, Halperin AJ, Ponten J. A role for sunlight in skin cancer: UV-induced p53 mutations in squamous cell carcinoma. Proc Natl Acad Sci USA. 1991;88:10124–10128. - PMC - PubMed

Publication types