. 2011 Dec 22;118(26):e192-208.
doi: 10.1182/blood-2011-04-345330. Epub 2011 Oct 19.

Transcriptomic analyses of murine resolution-phase macrophages

Affiliations

Transcriptomic analyses of murine resolution-phase macrophages

Melanie J Stables et al. Blood. .

Abstract

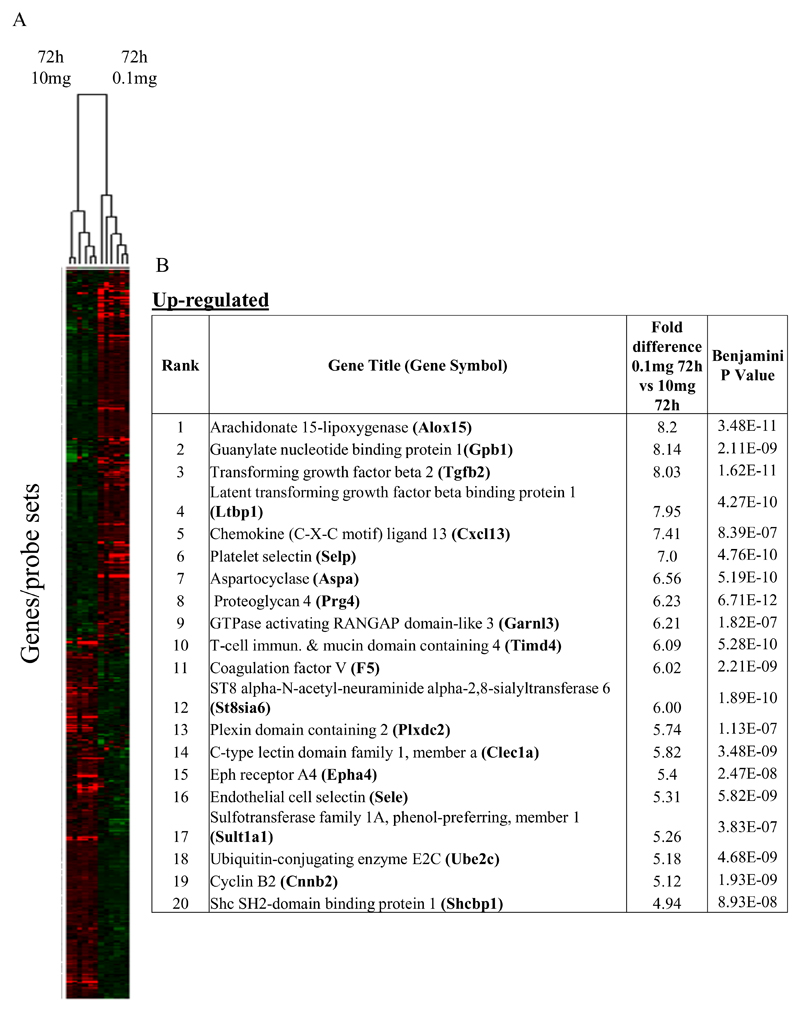
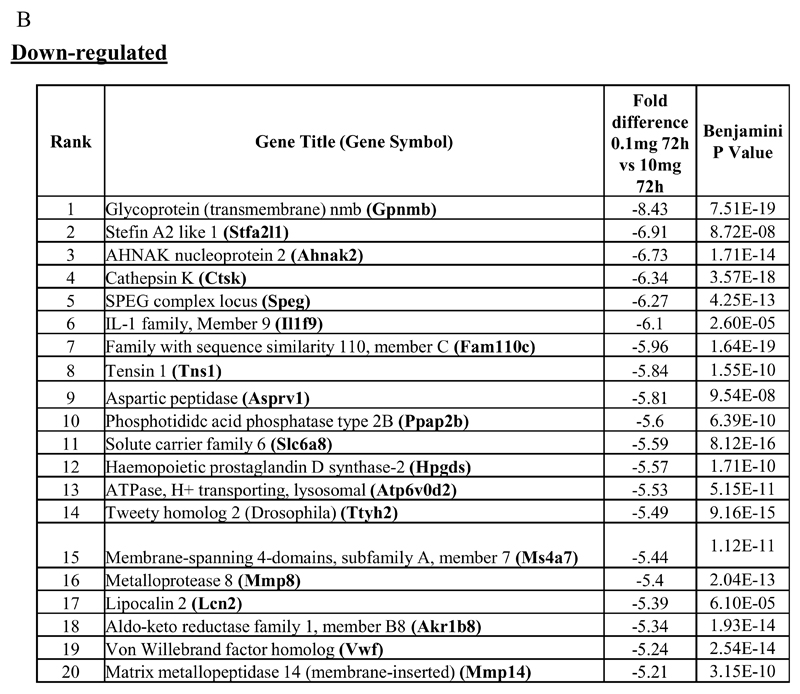
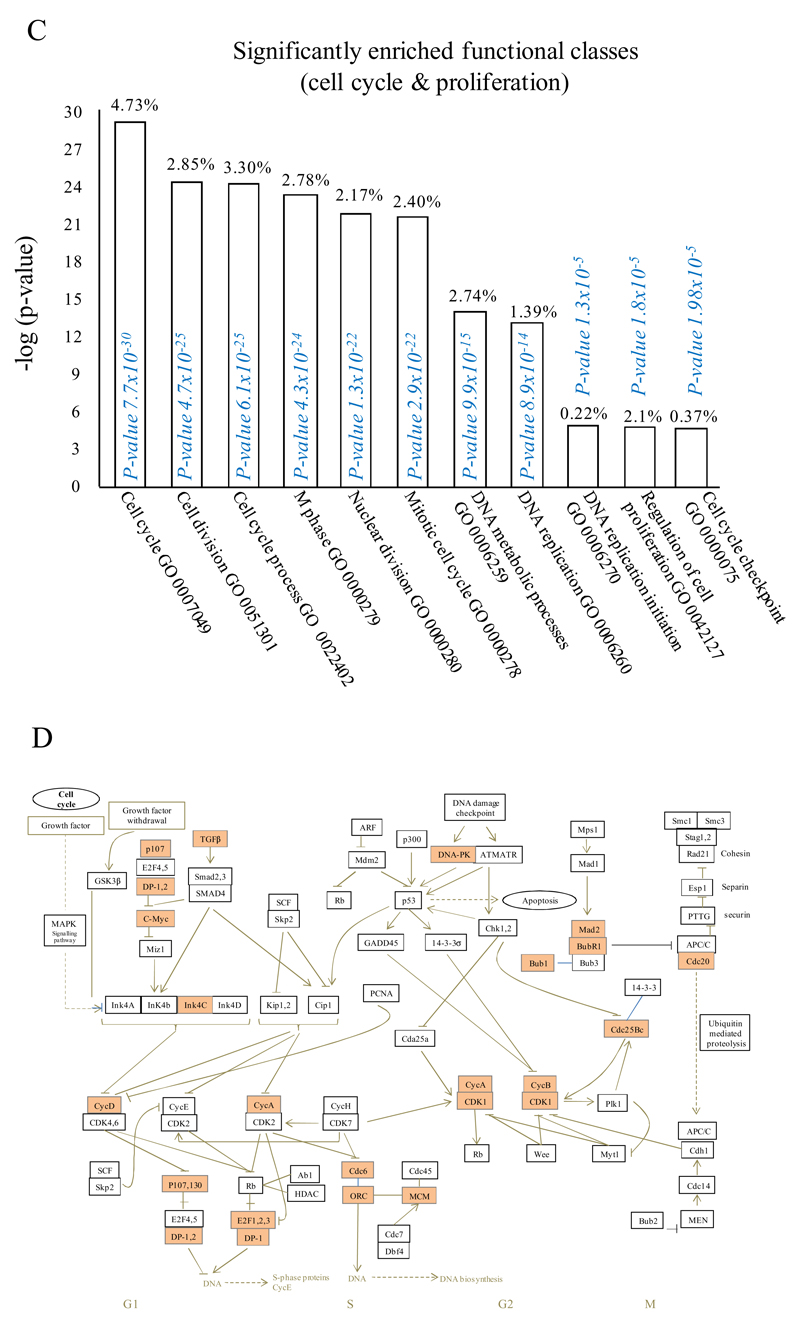
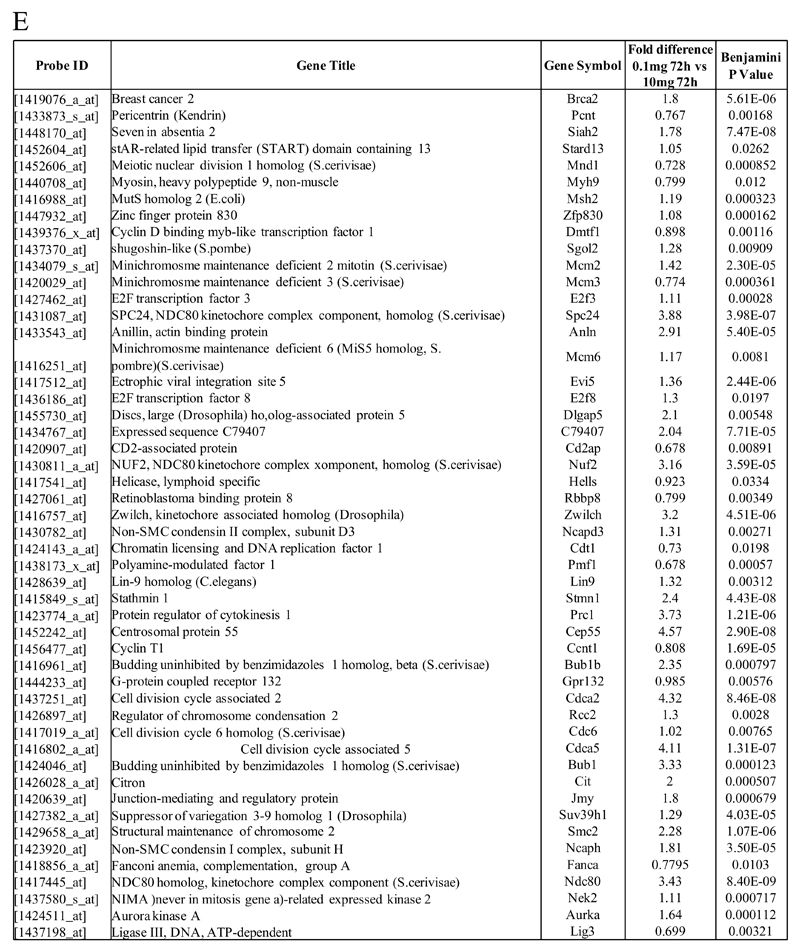
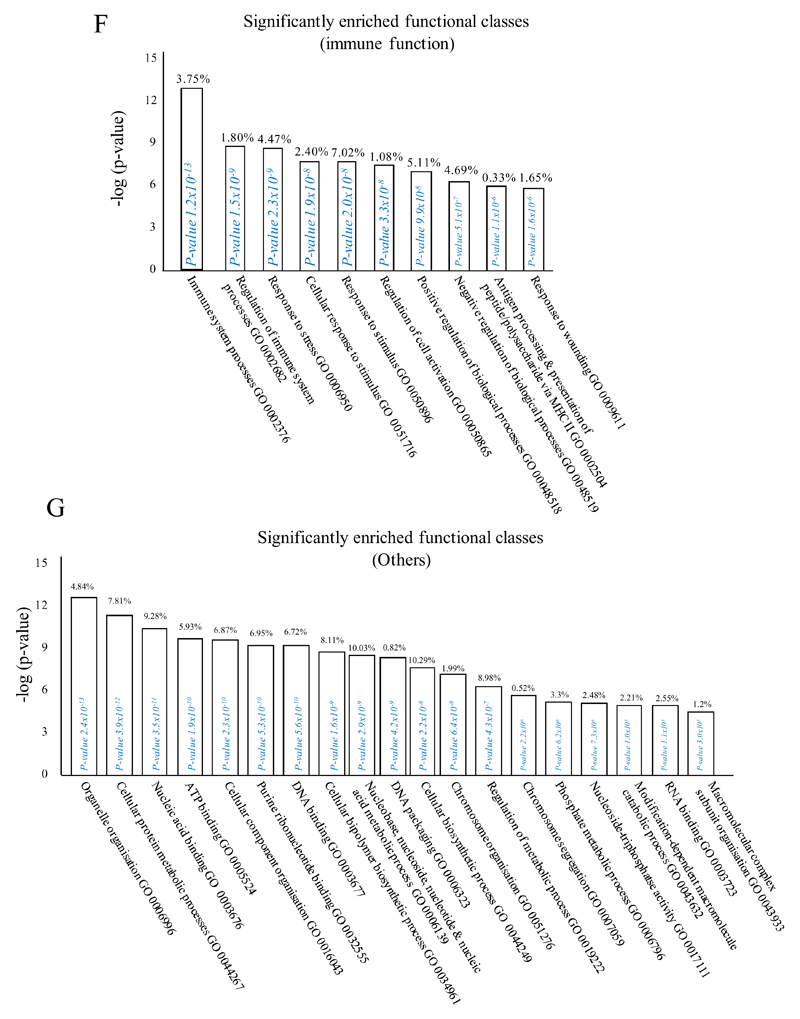
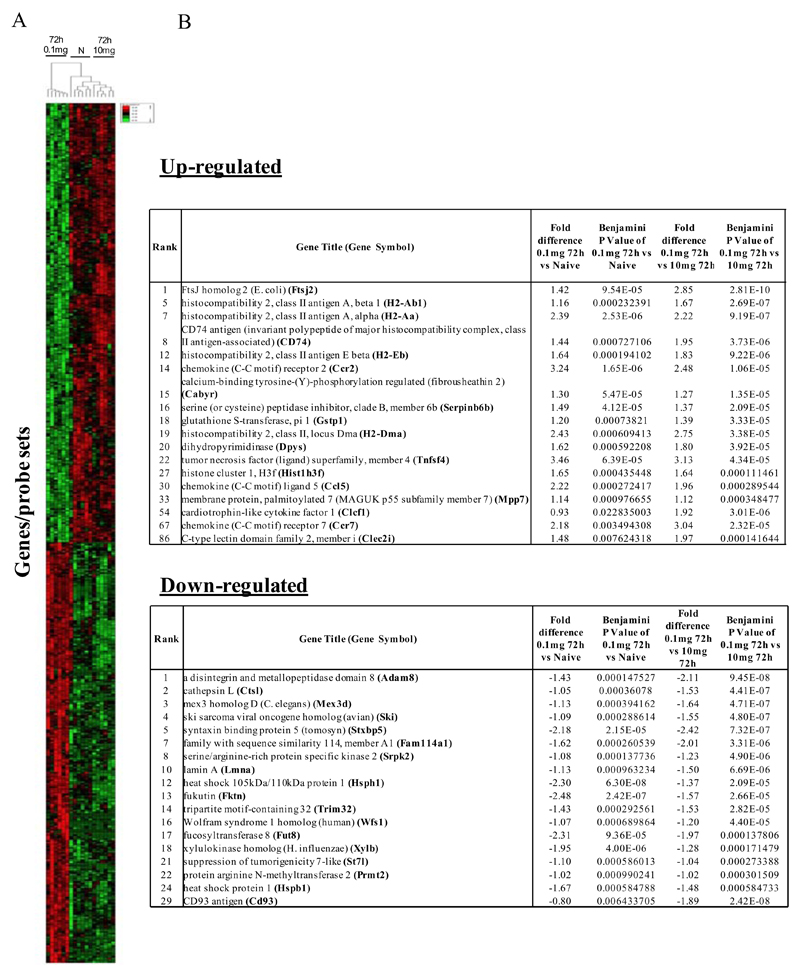
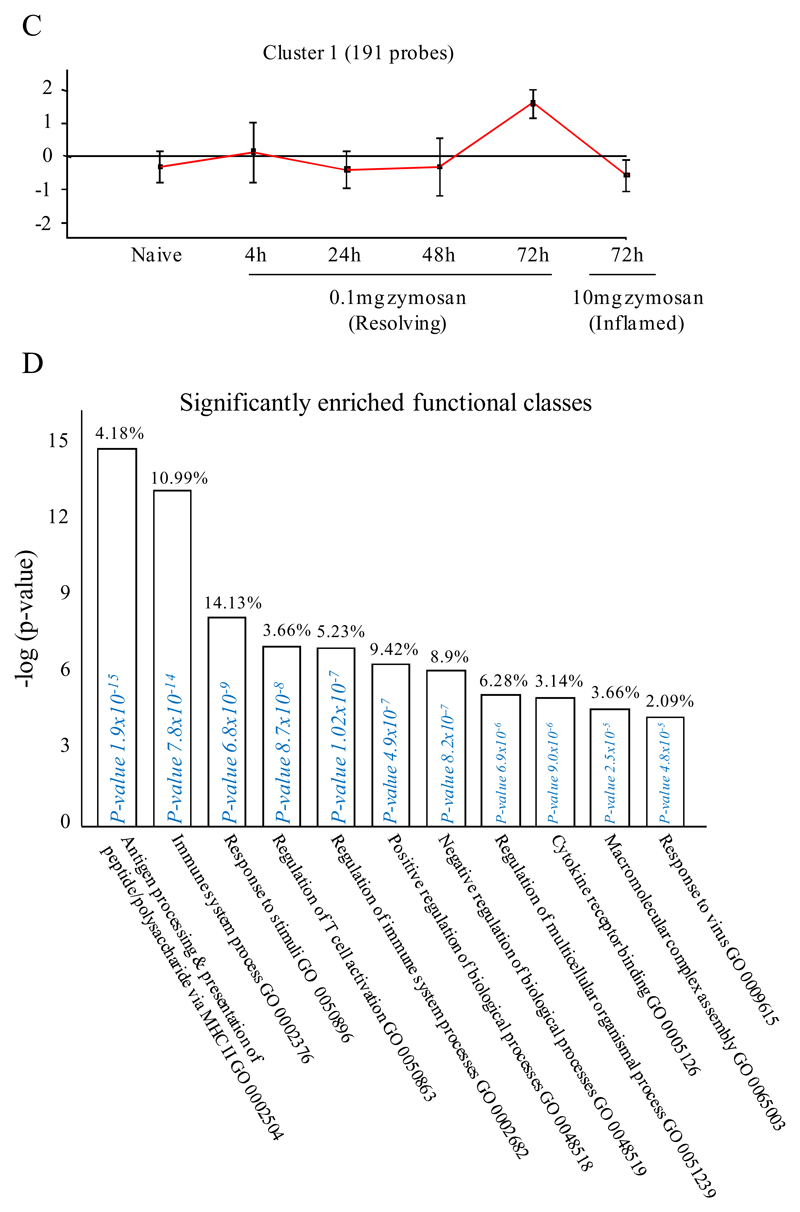
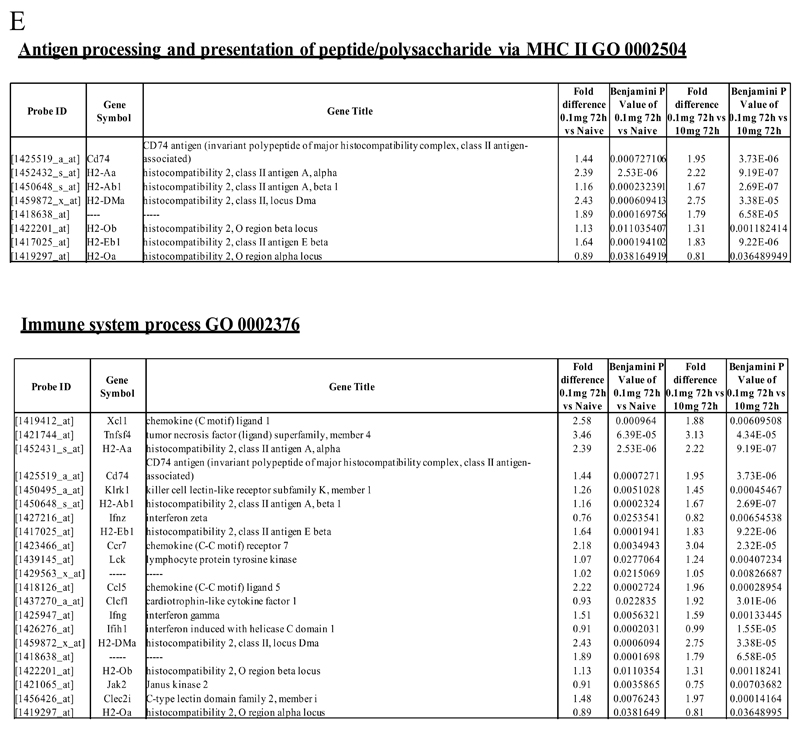
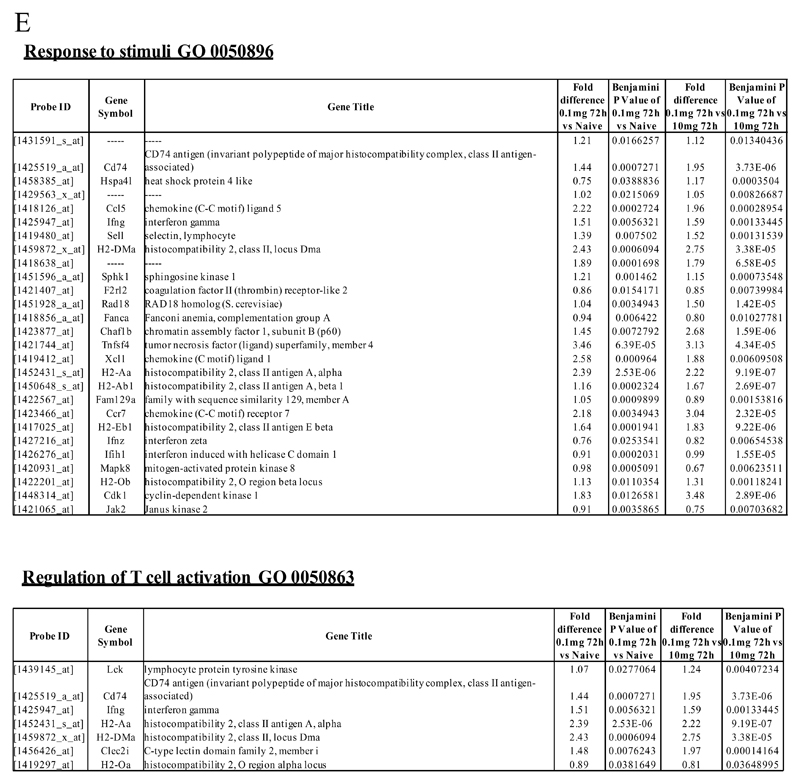
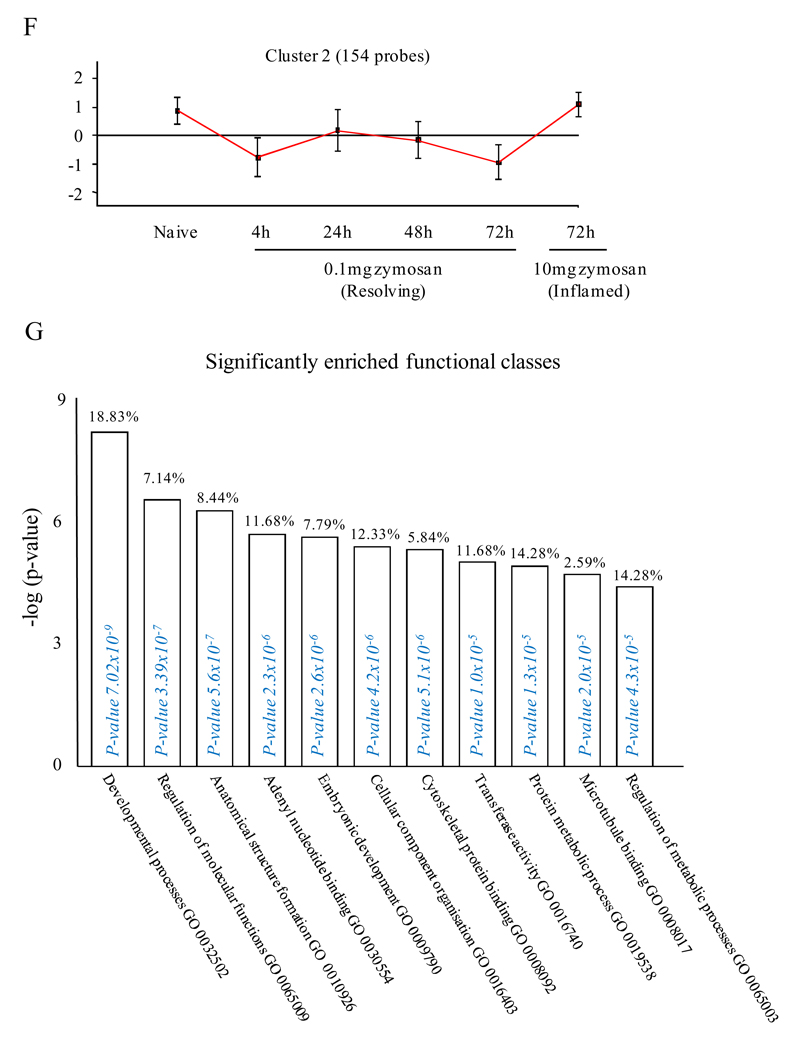
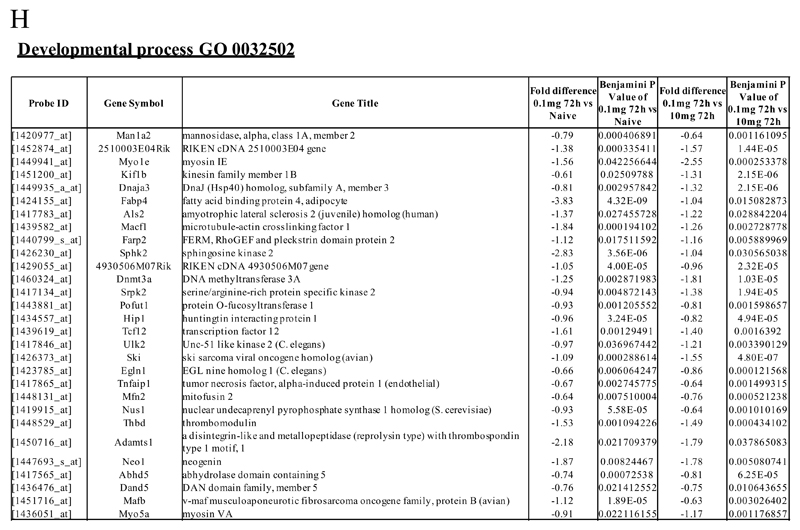
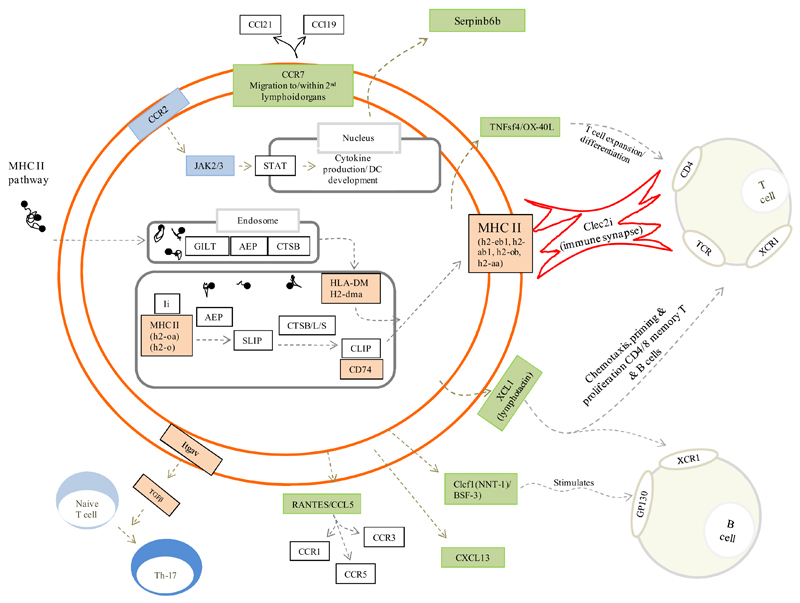
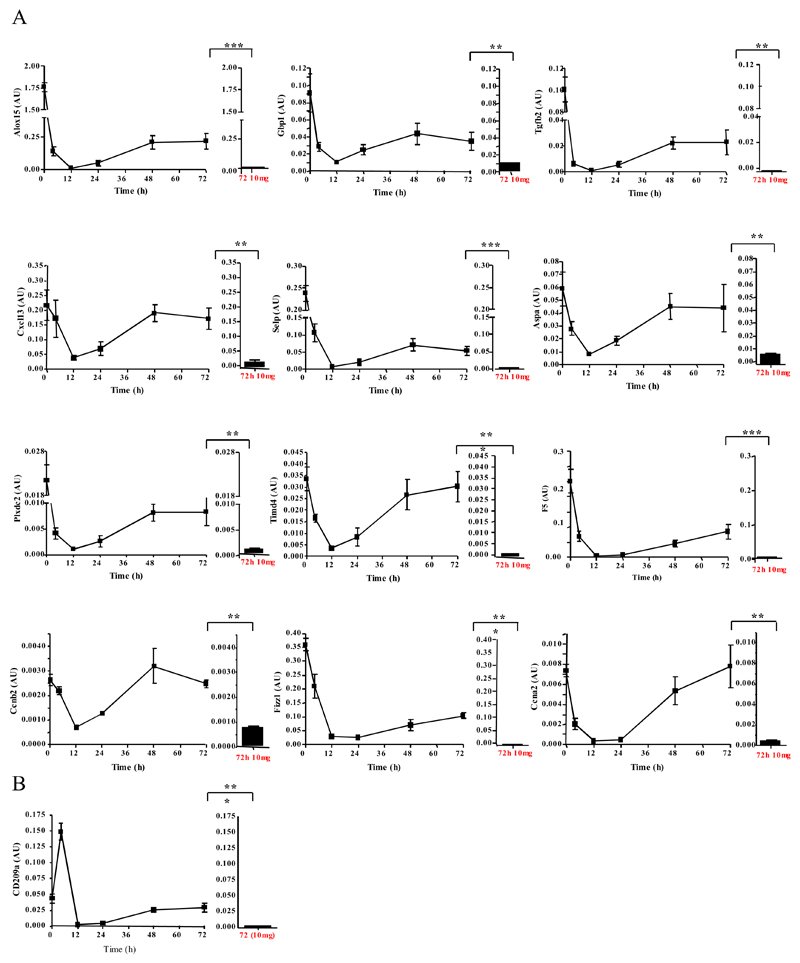
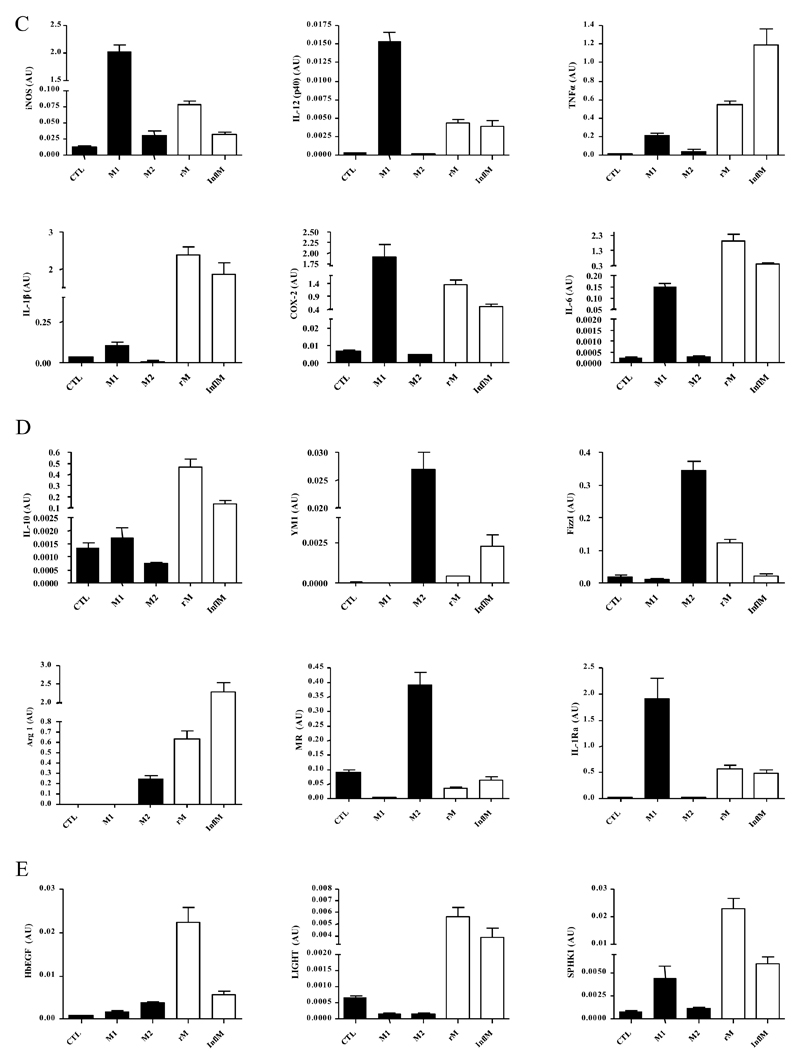
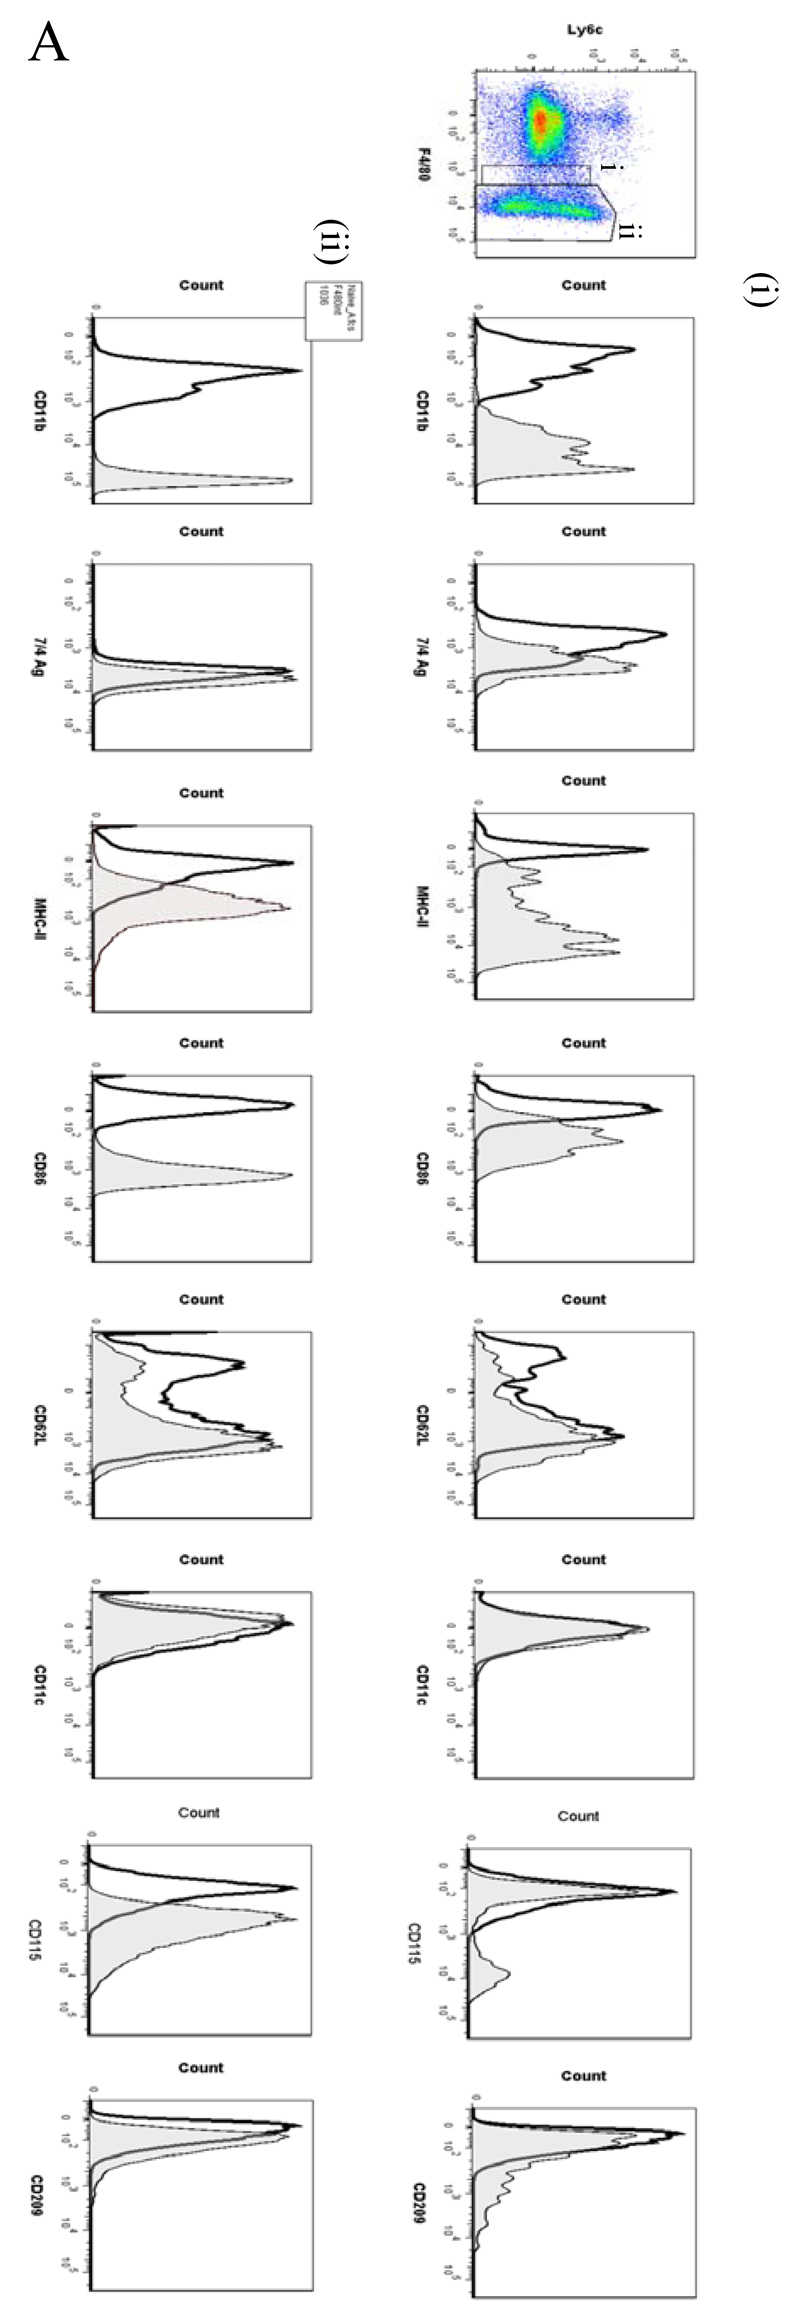
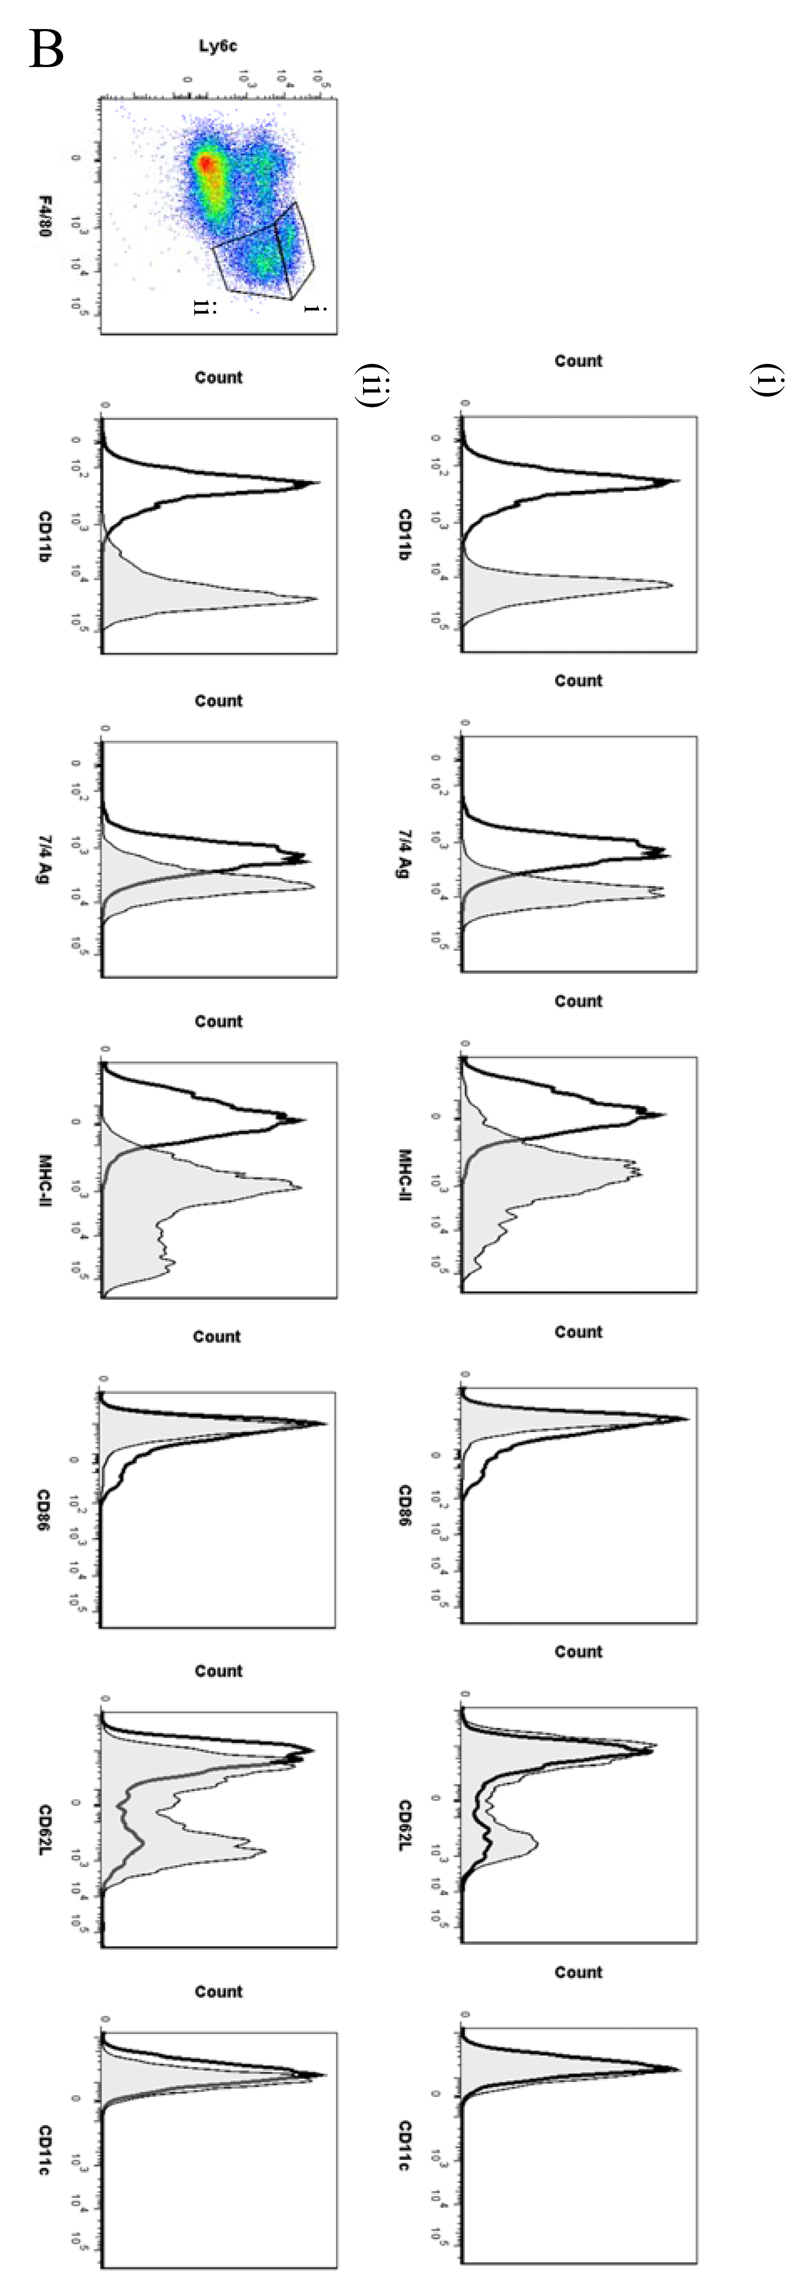
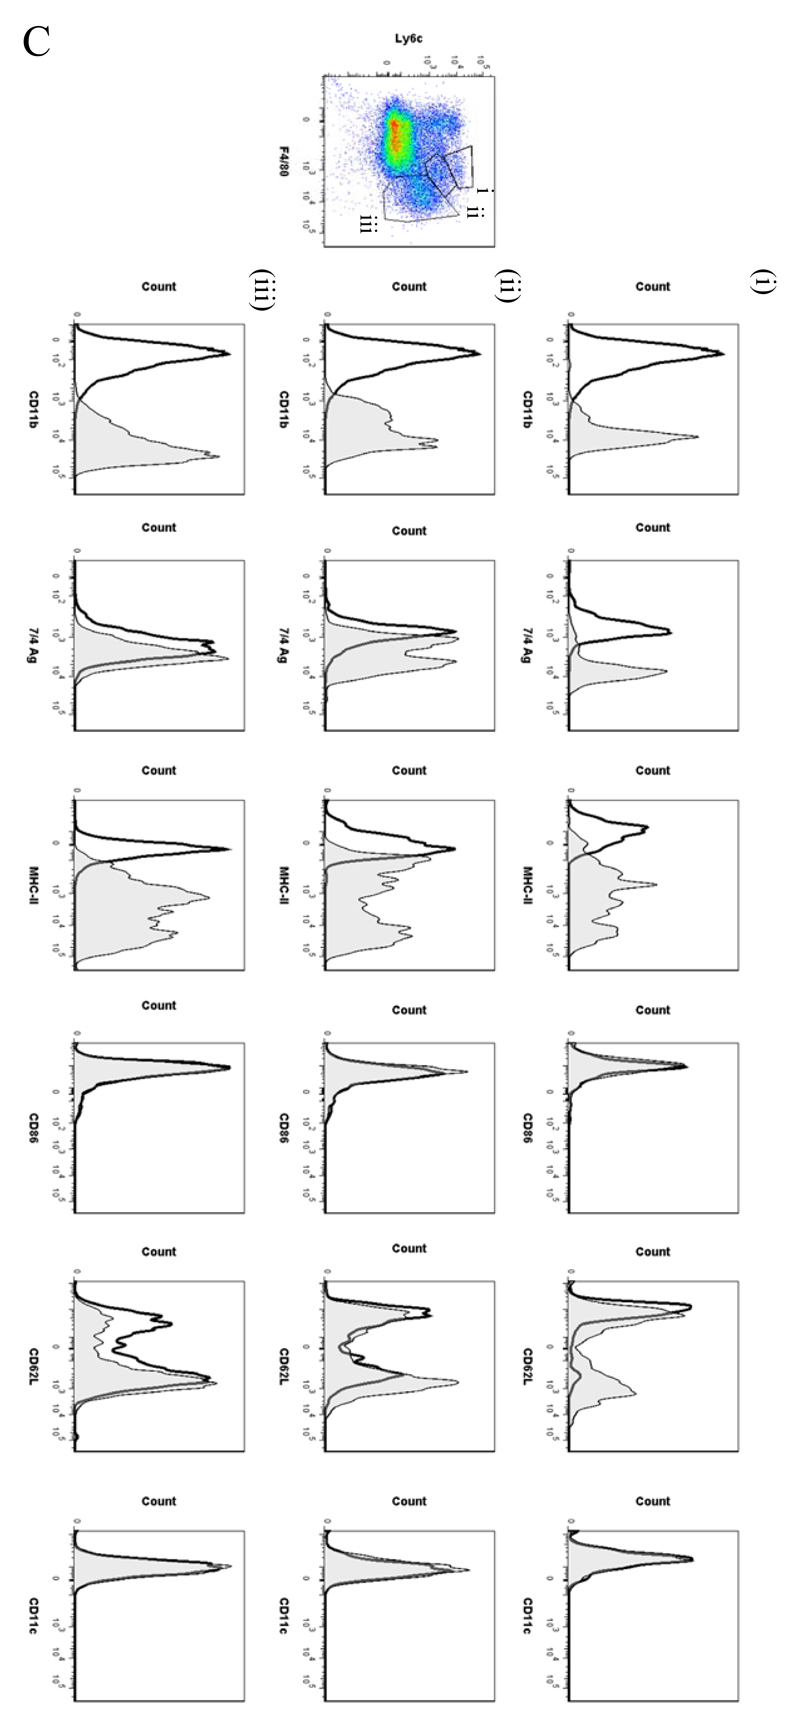
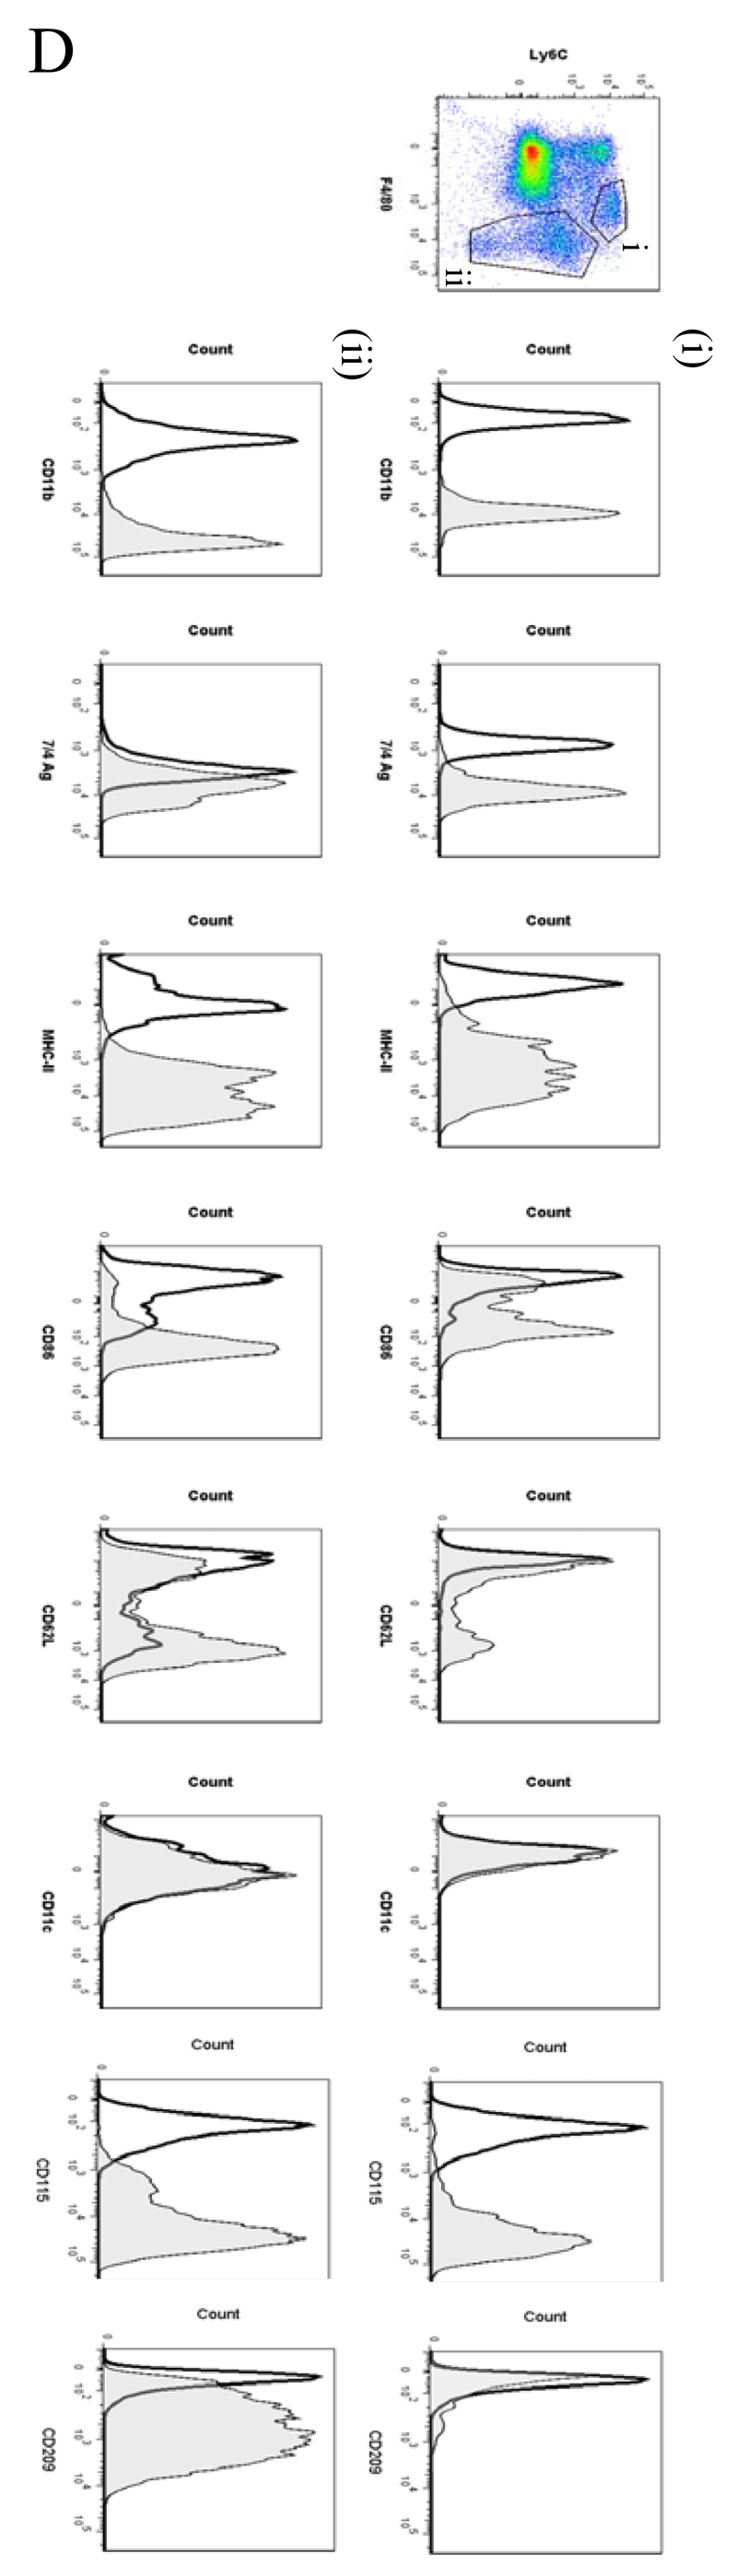
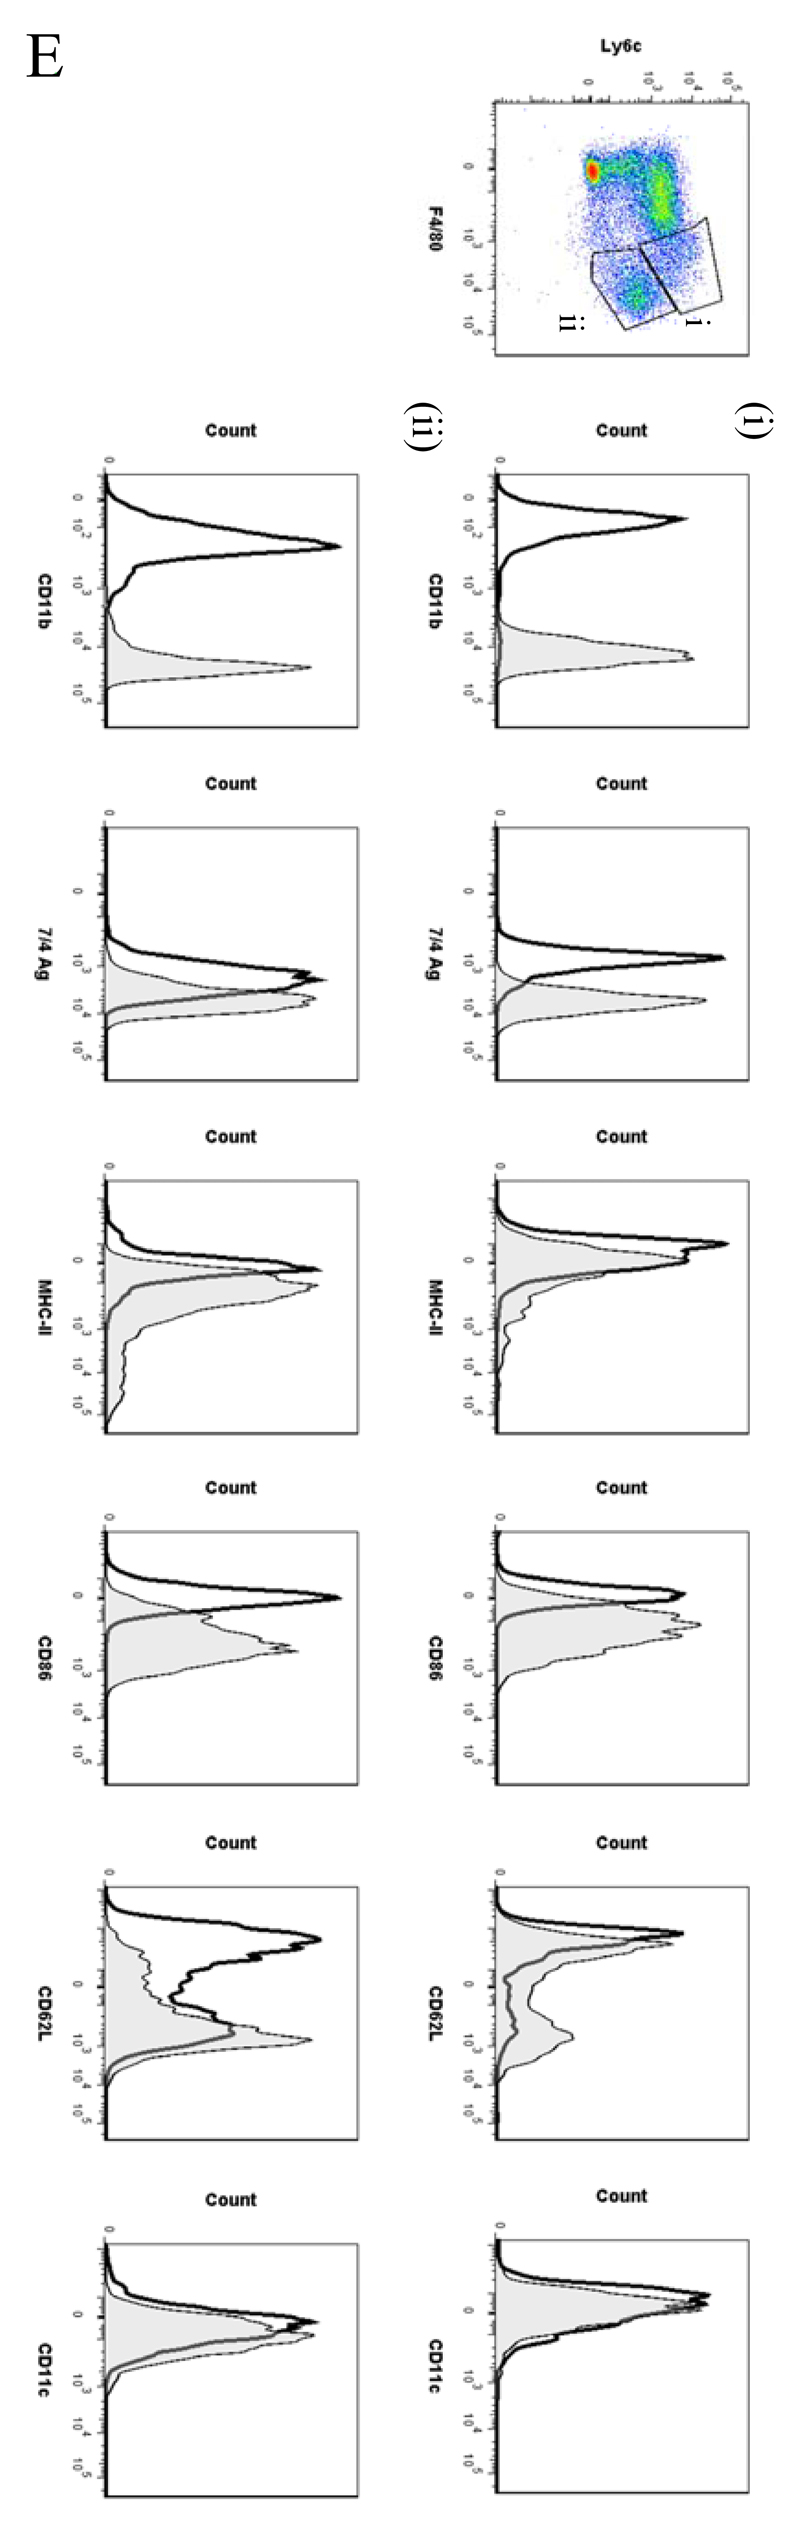
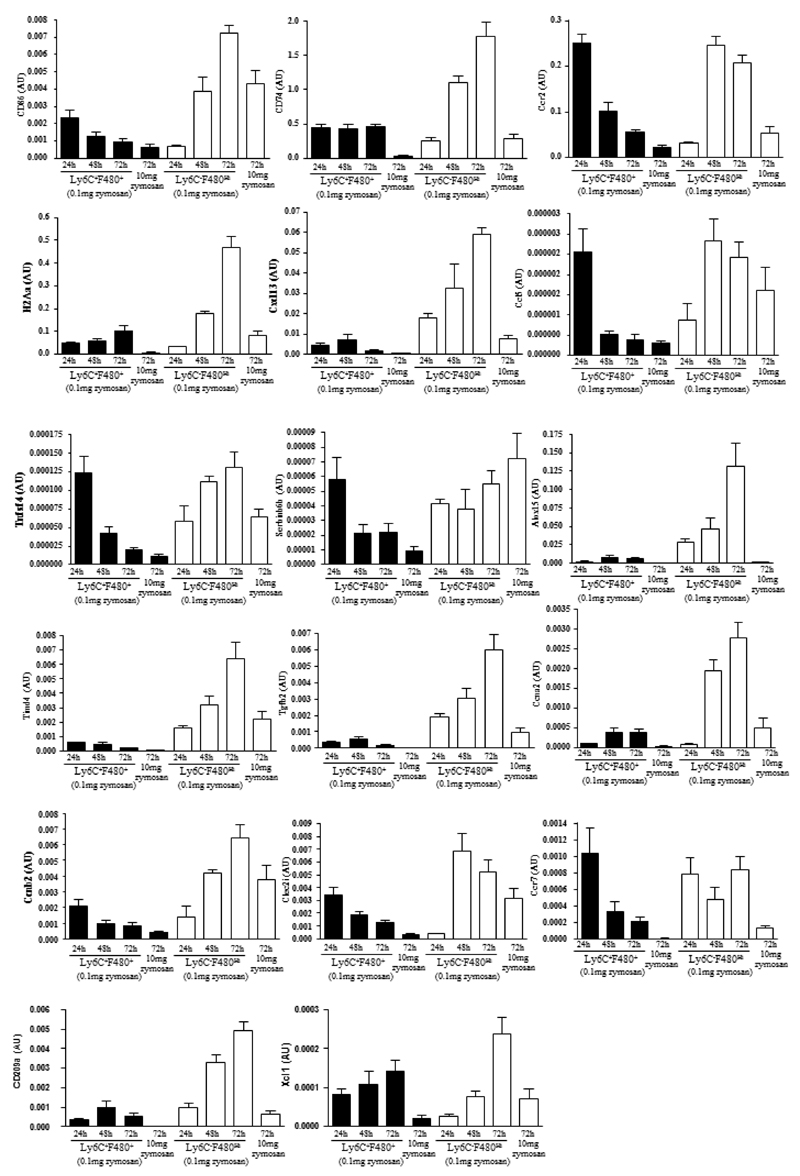
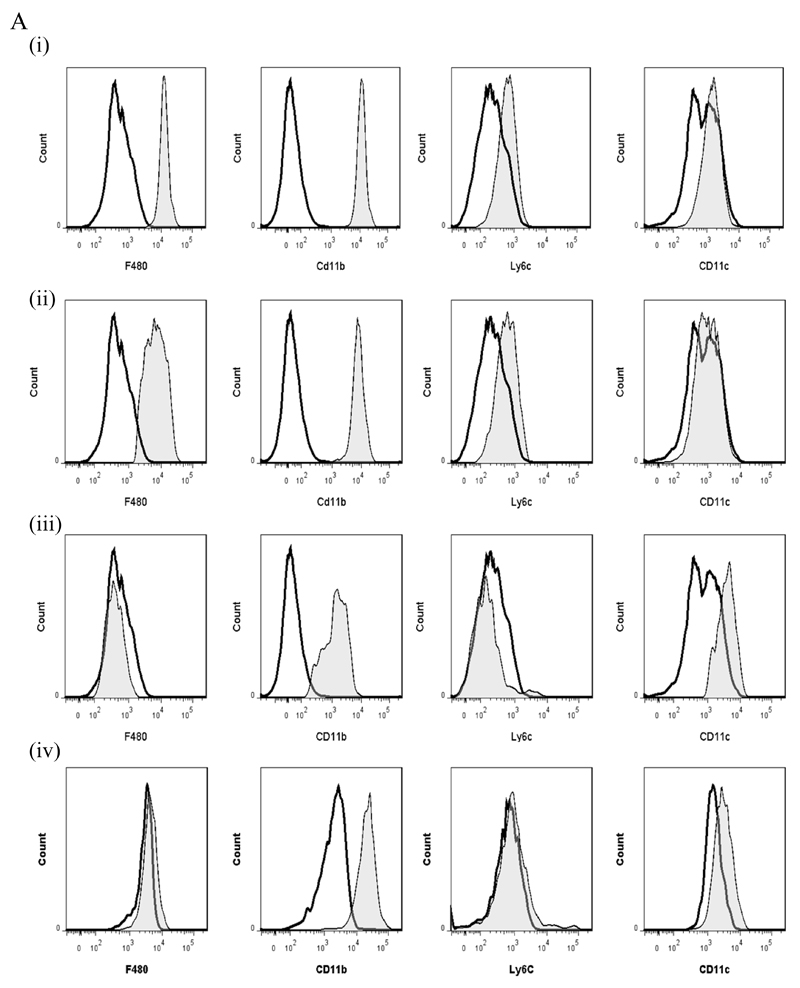
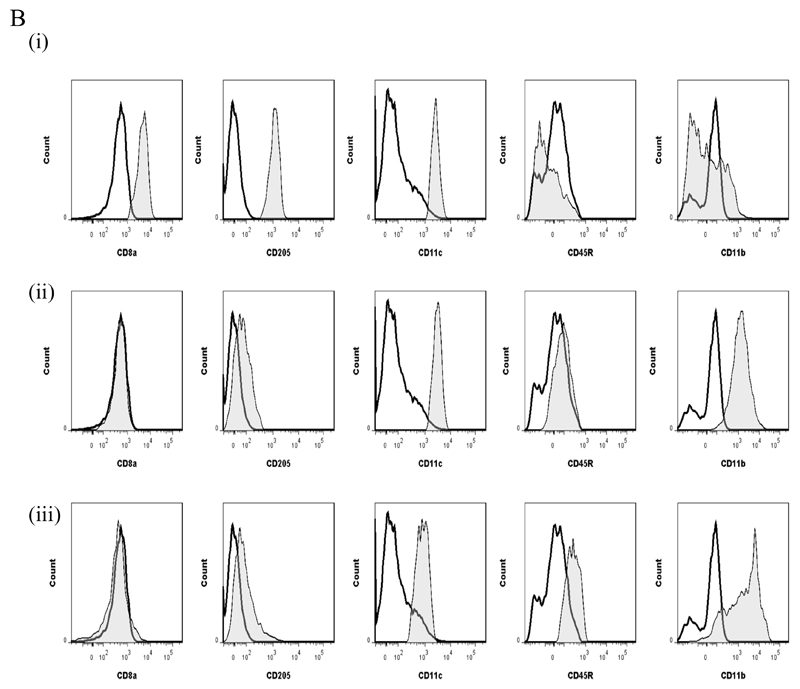
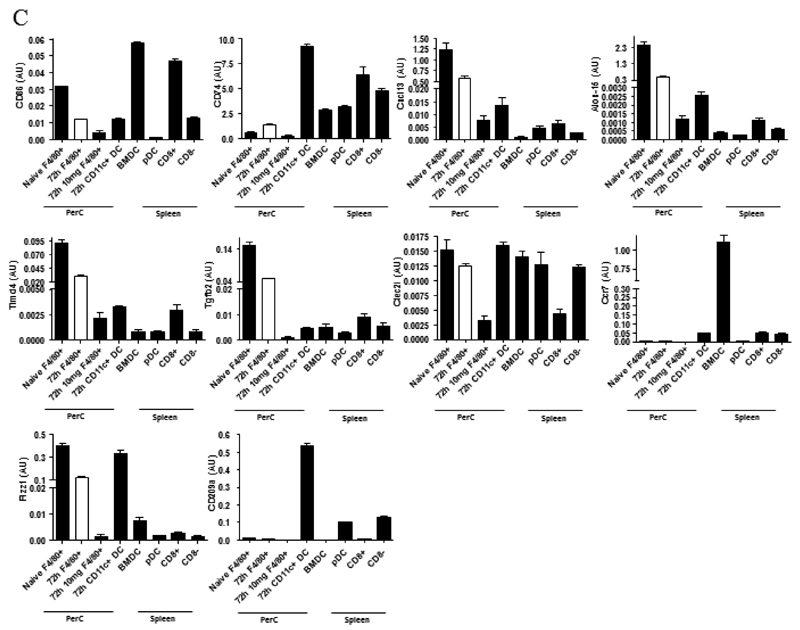
Macrophages are either classically (M1) or alternatively-activated (M2). Whereas this nomenclature was generated from monocyte-derived macrophages treated in vitro with defined cytokine stimuli, the phenotype of in vivo-derived macrophages is less understood. We completed Affymetrix-based transcriptomic analysis of macrophages from the resolution phase of a zymosan-induced peritonitis. Compared with macrophages from hyperinflamed mice possessing a pro-inflammatory nature as well as naive macrophages from the uninflamed peritoneum, resolution-phase macrophages (rM) are similar to monocyte-derived dendritic cells (DCs), being CD209a positive but lacking CD11c. They are enriched for antigen processing/presentation (MHC class II [H2-Eb1, H2-Ab1, H2-Ob, H2-Aa], CD74, CD86), secrete T- and B-lymphocyte chemokines (Xcl1, Ccl5, Cxcl13) as well as factors that enhance macrophage/DC development, and promote DC/T cell synapse formation (Clec2i, Tnfsf4, Clcf1). rM are also enriched for cell cycle/proliferation genes as well as Alox15, Timd4, and Tgfb2, key systems in the termination of leukocyte trafficking and clearance of inflammatory cells. Finally, comparison with in vitro-derived M1/M2 shows that rM are neither classically nor alternatively activated but possess aspects of both definitions consistent with an immune regulatory phenotype. We propose that macrophages in situ cannot be rigidly categorized as they can express many shades of the inflammatory spectrum determined by tissue, stimulus, and phase of inflammation.


Figures

Figure 1
Figure 1. Phenotype of rM compared to pro-inflammatory macrophages.
In (A), gene expression of rM is compared to pro-inflammatory macrophages using cells from 6 animals showing a stark contrast in macrophage phenotypes while (B) reveals a sample of the top up- and down-regulated genes in rM cells versus pro-inflammatory macrophages based upon FDR of 0.05 and fold expression difference of 1.5. The software package Expander detected significantly enriched functional gene sets in rM versus pro-inflammatory macrophages including those for (C) proliferation with key genes enriched for cell cycling depicted in (D) and a list if these genes displayed in (E). In addition to proliferation, other pathways were enriched in rM compared to pro-inflammatory macrophages namely (F) immune function and a range of other (G) significantly enriched functional classes.
Figure 2
Figure 2. Genes enriched in rM cells compared to naive and pro-inflammatory macrophages.
An FDR of 0.05 and fold difference of 1.5 revealed (A) 342 genes up- and down-regulated in rM compared to pro-inflammatory (10mg zymosan) and naive macrophages, a sample of the most differentially expressed genes is presented in (B). The software package Expander detected (C) 191 probesets significantly up-regulated in rM cells with these gene sets enriched for (D) aspect of antigen uptake/presentation and immune function with a list of the genes involved in antigen processing and presentation of peptide/polysaccharide via MHC-II (GO 0002504), immune system process (GO 0002376), response to stimuli (GO 0050896) and regulation of T cell activation (GO 0050863) shown in (E). There was significant enrichment for (F) 154 down regulated probesets with their significantly enriched functional classes presented in (G). Genes involved in developmental processes (GO 0032502) are listed in (H).
Figure 3
Figure 3. Unique phenotype of rM.
Author’s interpretation of key pathways defining rM are highlighted in colour. In gold, for example, are those genes central to antigen uptake and processing (all other genes in this pathway are in white and not enriched in rM) while green highlights chemokines and their receptors expressed/secreted by rM that trigger T/B cell chemoattraction or that which facilitate lymphocyte expansion/differentiation or T cell/rM interaction such as Clec2i, TNFsf4/OX and XCL1.
Figure 4
Figure 4. Validation of microarray analyses and phenotype of rM compared to in vitro-derived M1 and M2 macrophages.
Quantitative PCR for (A) genes most differentially expressed in rM versus pro-inflammatory macrophages validating original microarray findings including (B) CD209a, the monocytes-derive DC marker, which was included arising from the DC-like phenotype deduced in Figure 3. For comparisons to established M1/M2 cells, BMDMs were incubated with either LPS/INFγ (M1) and or IL-4 (M2) for 24h. RNA was extracted and probed for a range of typical (C) M1, (D) M2, and (E) M2b markers. Data are represented and analysed by ANOVA followed by Bonferroni multiple comparison tests. Values are expressed as means ± SEM of n=5-6 mice per group. ** P value < 0.01 and *** P value < 0.001.
Figure 5
Figure 5. Temporal profile of monocytes and monocyte-derived macrophages during resolving inflammation.
Cells from the (A) naive peritoneum were labelled with Ly6c and F4/80, which identified two regions (i-ii) by FACS. Each region was further probed for the expression of CD11b, 7/4 antigen, MHC-II, CD86, CD62L, CD11c, CD115 and CD209. A similar approach was used on samples obtained from (B) 24, (C) 48h and (D) 72h resolving inflammation as well as (E) inflammation at 72h triggered by 10mg zymosan. Representative figures of four replicates are shown from each time point.
Figure 6
Figure 6. Phenotype of monocytes/macrophage sub-population throughout resolving inflammation.
There are two broad categories of monocytes/macrophages namely Ly6cposF4/80pos and Ly6cnegF4/80hi revealed in Figure 5B-E. These were isolated using FACSaria at 24, 48 and 72h from resolving peritonitis as well as at 72h from peritonitis triggered by 10mg zymosan. mRNA was extracted and quantitative PCR carried out for the relative expression of genes enriched in each population. Data is expressed as means ± SEM for n=3-6 replicates per group. Note, cells from these each of these replicates are pooled from 3-5 animals prior to FACS cell sort
Figure 7
Figure 7. Phenotype of rM compared to conventional dendritic cells.
In panel (A) levels of CD11c expression among other markers was examine on (i) naïve peritoneal macrophages and (ii) rM cells compared to (iii) CD11c-positive cells-FACS-sorted from a 72h resolving peritoneal cavity as well as (iv) GMCSF/IL-4 generated bone marrow-derived dendritic cells stimulated with LPS. In (B) we characterised (i) CD8pos, (ii) CD8neg and (iii) plasmacytoid dendritic cells for their (C) comparison of with rM at message level for MHC-II as well as co-stimulatory molecules (CD74 and CD86), monocyte-derived dendritic cells marker (CD209a) and the immune synapse mediator Clec2i among other key rM markers summarised in Figure 3. PerC = peritoneal cavity.

References

    1. Bowdish DM, Loffredo MS, Mukhopadhyay S, Mantovani A, Gordon S. Macrophage receptors implicated in the "adaptive" form of innate immunity. Microbes Infect. 2007;9(14-15):1680–1687. - PubMed
    1. Savill J. Phagocyte recognition of apoptotic cells. Biochem Soc Trans. 1996;24(4):1065–1069. - PubMed
    1. van Furth R. Mycobacteria and macrophage activation. Res Microbiol. 1990;141(2):256–261. - PubMed
    1. Rosenthal AS, Lipsky PE, Shevach EM. Macrophage-lymphocyte interaction and antigen recognition. Fed Proc. 1975;34(8):1743–1748. - PubMed
    1. Shapiro SD. Diverse roles of macrophage matrix metalloproteinases in tissue destruction and tumor growth. Thromb Haemost. 1999;82(2):846–849. - PubMed

Publication types