Review
. 2011 Nov;240(11):2405-31.
doi: 10.1002/dvdy.22756.

Axonemal positioning and orientation in three-dimensional space for primary cilia: what is known, what is assumed, and what needs clarification

Affiliations
Review

Axonemal positioning and orientation in three-dimensional space for primary cilia: what is known, what is assumed, and what needs clarification

Cornelia E Farnum et al. Dev Dyn. 2011 Nov.

Abstract

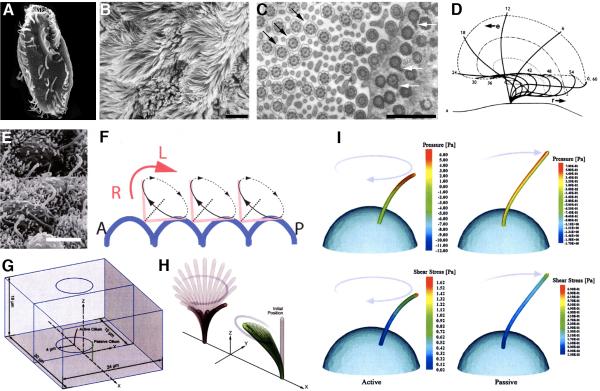
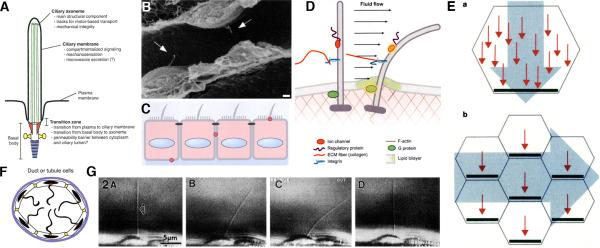
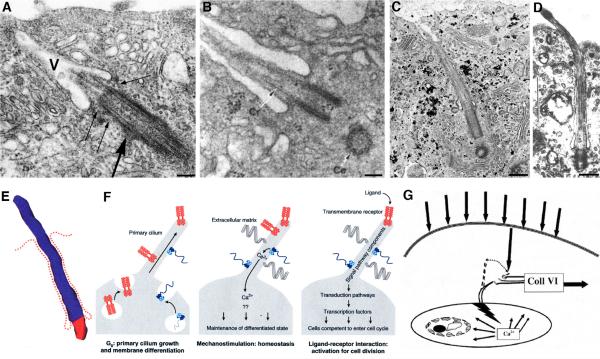
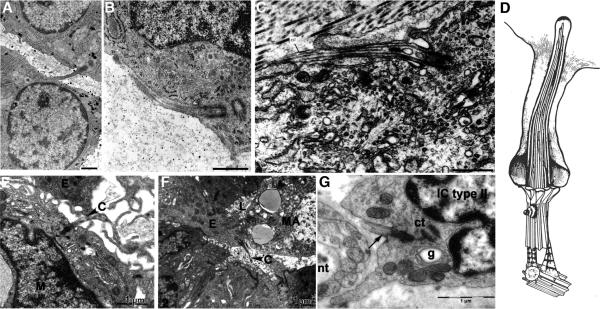
Two positional characteristics of the ciliary axoneme--its location on the plasma membrane as it emerges from the cell, and its orientation in three-dimensional (3D) space--are known to be critical for optimal function of actively motile cilia (including nodal cilia), as well as for modified cilia associated with special senses. However, these positional characteristics have not been analyzed to any significant extent for primary cilia. This review briefly summarizes the history of knowledge of these two positional characteristics across a wide spectrum of cilia, emphasizing their importance for proper function. Then the review focuses what is known about these same positional characteristics for primary cilia in all major tissue types where they have been reported. The review emphasizes major areas that would be productive for future research for understanding how positioning and 3D orientation of primary cilia may be related to their hypothesized signaling roles within different cellular populations.


Figures

Figure 1
Figure 1. Position of emergence of cilia from polarized epithelial cells
1A. Scanning electron micrographs of the fimbriae of the uterine tube of a rabbit demonstrate the luminal positioning of axonemes emerging from both multiciliated cells, as well as from cells with a single solitary cilium (white arrowheads, bar = 25μm). As shown at higher magnification in 1B, primary cilia are positioned centrally on the luminal face of individual cells (bar = 1μm). IC, ID, IE. Nodal cilia emerge from the exposed surface of the node and initially are positioned essentially centrally on each nodal cell, seen here in the ventral node of the medakafish. 1C is an image of the entire node (bar = 50μm; the area enclosed by the white box is seen at higher magnification in 1D (bar = 5μm). The transmission electron micrograph in the inset in 1D demonstrates the characteristic 9 + 0 microtubular organization of the axoneme of these cilia (bar = 0.05μm). For flow generation resulting in establishment of the left/right axis, a subset of nodal cilia in the murine ventral node are positioned posteriorly on individual cells (arrow, 1E; bar = 1μm). In Figure 1F the relative shifting of the position of emergence of the cilium from individual nodal cells over time, changing from a central localization (1F, left) to a posterior localization (1F, right) is shown diagrammatically for the murine nodal pit. The schematic in Figure 1G shows the positional relationships of the multiple cilia of individual olfactory neurons of murine olfactory epithelium. (OSN = olfactory sensory neuron; SC = sustenacular cell (or supporting cell); BC = basal cell). The scanning electron micrograph of an olfactory receptor cell neuron in an E20 rat embryo (Fig. 1H) shows multiple cilia (black arrow indicates one ciliary axoneme) radiating from a single neuron onto the nasal olfactory epithelium (bar = 1μm). Figure 1I is an electron micrograph of the position of docking of the cilium to the chondrocytic plasma membrane in porcine growth plate cartilage. Note the complexity of structures (alar sheets) associated with the positioning of the basal body to the plasma membrane (bar = 0.1 μm). Figures 1A,B from Rumery and Eddy, 1974 (Figures 7,8) used with permission from John Wiley and Sons; Figures 1C,D from Okada et al.,2005 (Figures 1K,1L) used with permission from Elsevier; Figures 1E,F from Lee and Anderson,2008 (Figures 2A,2B) used with permission from John Wiley and Sons; Figure 1G from McEwen et al.,2008 (Figure 12.1B) used with permission from Elsevier; Figure 1H from Menco,1997 (Figure 4) used with permission from Oxford University Press.
Figure 2
Figure 2. Position of emergence of cilia from non-epithelial cells
Articular cartilage chondrocytes have clearly defined major and minor cellular axes. The primary cilium (arrowheads) emerges from the cell from a juxtanuclear position associated with the Golgi (Fig. 1A; bar = 1μm). Similarly, in tenocytes the ciliary axoneme emerges from a juxtanuclear position centered on one of the long axes of the cell (arrow, Fig. 2B; bar = 2μm). In growth plate chondrocytes (Fig. 2C), axonemes from cilia on adjacent cells emerge from the either side of the long axis of the cell, so that adjacent chondrocytes may have axonemes pointing in opposite directions (bar = 3μm). In Figure 2D, z-stack data were used to reconstruct the position of the cilium (red) in a hippocampal neuron. Note its position adjacent to the axon. When cells have a complex irregular shape, the position of emergence of the ciliary axoneme is difficult to define, even in epithelia, as shown in Fig. 2E of a basal cell of the gingiva (bar = 1μm). The complexity of defining the position of emergence of the axoneme from cells with a highly irregular shape is demonstrated by the images in Figures 2F,G,H of sinus adventitial reticular cells of the bone marrow stroma. In Figure 2F, E = endothelial cell, R = nucleus of a reticular cell, and the arrow points to the ciliary axoneme (bar = 0.2μm). Figure 2G shows the ciliary axoneme emerging from a reticular cell in the hematopoietic parenchyma (bar = 1μm). At higher magnification (Fig. 2G; bar = 0.2μm), the complexity of the relationship of the axoneme to adjacent hematopoietic cells is shown. The series of images in Figure 2, by contrast to those in Figure 1, emphasize that axonemal positioning on the parent cell has multiple levels of complexity, depending upon the cell type and its shape. It is only in highly polarized epithelia as shown in Figure 1 that positioning of the cilium is highly predicable from one cell to the other in a cellular population. Figure 2A from Farnum et al.,2009 (Figure 1A) used with permission from Elsevier; Figure 2B from Gardner et al., 2011 (Figure 3B) used with permission from John Wiley and Sons; Figure 2C from Ascenzi et al.,2007 (Figure 2b) used with permission from Elsevier; Figure 2D from Breunig et al.,2008 (Figure 2C,2C') used with permission from the National Academy of Sciences; Figure 2E, from Warfvinge and Elofsson,1988 (Figure 3) used with permission from Springer; Figures 2F,G,H from Yamazaki,1988 (Figures 3,1,2 respectively) used with permission from Elsevier.
Figure 3
Figure 3. Orientation of the axoneme in 3-D space
The diagram at the left in Figure 3 demonstrates co-ordinates for defining the position of the axoneme (x,y,z), and two angles of tilt: Θ relative to the x/y plane; Φ relative to the x/z plane. Theoretically the axoneme could reorient by rotating around its own long axis (Ψ), but this has not been demonstrated in any biological system for primary cilia. This kind of co-ordinate system has been used to make a quantitative characterization of centriolar orientation in Chlamydomonas mutants (Figs. 3A-H). The differential interference contrast images in B,C,D compare the morphology of the wild type (B) to two mutants (C,D). Using 3-D co-ordinates for centriolar orientation (E) and then plotting the data specifically for Θcentriole demonstrates that the mean Θcentriole for the wild type (F, black line) is significantly lower than that seen in the two mutants (black line in G, H). Thus, the use of 3-D co-ordinates allows one to make a quantitative analysis of what was previously a qualitative description (mother-daughter centriole pairs randomly localized on the surface (C); mother-daughter centriole pairs positioned independently on the surface and no longer found in pairs (D)). Figure (left panel) from Marshall and Kintner,2008 (Figure 1) used with permission from Elsevier; Figure 3A-H from Feldman et al.,2007 (Figure 1) used with permission of the Public Library of Science.
Figure 4
Figure 4. Requirement of precise 3-D orientation of cilia associated with special senses
The structure of the mammalian retina is highly polarized with multiple discrete cellular layers (Fig. 4A). Rods and cones are highly modified cilia in the photoreceptor layer requiring precise 3-D orientation for normal functioning, shown in both a histological image and diagrammatically in Fig. 4A. The special sense of hearing also relies on modified cilia with a precise 3-D orientation. A schematic of hair bundle orientation is shown in Figure 4B, demonstrating the alignment of stereocilia (red, labeled with phalloidin) relative to a kinocilium (green, labeled with anti-acetylated tubulin), sitting on a discoid cuticular plate. As can be seen in Figure 4C, the specific 3-D orientation of the hair bundles differs in the saccule (hair bundles facing away from each other) and the utricle (hair bundles facing toward each other). This precise and complex spatial variability of 3-D orientation is required for normal function. Olfactory receptor neurons have a small cluster of 6-10 cilia positioned to bind odorant molecules from the olfactory mucosa (Fig. 4D). Although they have a 9+2 microtubular configuration, they are not actively motile. They have a characteristic alignment relative to each other, as shown in Fig. 4E, where the basal feet of the basal bodies of the cilia of one cell can be seen in a circular configuration relative to each other (bar = 0.4μm). Olfactory sensory information received via the multiple cilia of a given cell relays through a single axon to be received by second order olfactory neurons (Fig. 4F). Figure 4A from Wright et al.,2010 (Figure 1b,c) used with permission from Nature Publishing Group; Figures 4B,C from Wang et al.,2006 (Figures 4D and 2, respectively) modified and used with permission from Society for Neuroscience; Figure 4D from Louvi et al.,2011 (Figure 2D) used with permission from Elsevier; Figure 4E from Reese,1965 (Figure 46) used with permission from Rockefeller University Press, originally published in J Cell Biol 25:209-230; Figure 4F from Menini et al.,2004, Physiology (Figure 1) used with permission from the American Physiological Society.
Figure 5
Figure 5. Requirement of precise 3-D orientation of actively motile cilia
Ciliated unicellular organisms move via coordinated cillary beating of hundreds of cilia; controlled movement, including turning and phototaxis, depends upon precision of orientation of the 3-D beating pattern of adjacent cilia (Fig. 5A). A similar co-ordination of waveform in 3-D space is required for the metachronal pattern of movement of cilia lining the respiratory tract (Fig. 5B; bar = 10μm). In cross section, the precision of ciliary alignment can be seen both in the parallel positioning of inner singlets of adjacent axonemes (Fig. 5C, black arrows) and identical orientation of basal feet of adjacent basal bodies within the cytoplasm (Fig. 5C, white arrows; bar = 1μm). The details of the complexity of the 3-D waveform remain a subject of analysis (Fig. 5D), but the need for precise co-ordination of movement of adjacent axonemes is known to be critical for appropriate function. A similar precision of positioning and coordinated oriented movement in 3-D space is required for cilia in nodal cells (5E, bar = 5μm). There is a ventro-posterior emergence of individual cilia from the basal body, which itself is positioned posteriorly on the cell (Fig. 4F). Modeling of the relationship of these two kinds of nodal cilia (Figs. 5F,G) to each other has demonstrated that the counterclockwise fluid movement by actively motile cilia generates flow of significant magnitude to cause bending of non-motile primary cilia (Figs. 4H,I), resulting in signal transduction that is critical for establishing left-right asymmetry. This is an elegant example of the critical importance of both precise positioning of the cilium on the cell as well as generation of a precise axonemal waveform in 3-D space for normal functioning. Laterality defects manifested in ciliopathies can result either from disruption of positioning of the cilia or from inappropriate waveform of the motile cilia in 3-D space. Figure 5A: from http://.genome.gov/Images/press_photos/lowres/85-72.jpg; Figure 5D from Sanderson,1984 (Figure 1a) used with kind permission from Springer Science+Business Media: Biology of the Integument, Vol. 1 Invertebrates, Chapter 3, Cilia, by Michael J. Sanderson p. 21; Figures 5E,F from Okada et al.,2005 (Figures 4c,d) used with permission from Elsevier; Figures 5G,H from Chen et al.,2009 (Figures 2,5) used with permission from Elsevier; Figure 5I, Chen et al.,2010 (Figure 12) used with permission from Elsevier.
Figure 6
Figure 6. Axonemal positioning and 3-D orientation for primary cilia in polarized epithelia
Axonemal and basal body structure of the primary cilium are remarkably similar across a wide range of polarized epithelia (Fig. 6A); primary differences in signaling capabilities are associated with specialization of receptors on the axonemal membrane. Both in scanning microscopy images (Fig. 6B, primary cilia of renal tubule cells; bar = 0.5μm) or in diagrams (Fig. 6C), primary cilia in polarized epithelial cells are shown as emerging from essentially the geometrical center of the apical surface of the cell, with a capability of responding to fluid flow within the lumen (Fig. 6F). The response to fluid flow is depicted in diagrams as occurring only in two dimensions (Fig. 6D), with all cells responding in the same manner and with the axoneme lacking any complex 3-D waveform. Although it is assumed that bending can occur in all possible directions, this has not been studied rigorously. This is in contrast to actively motile cilia. It is hypothesized that, for motile nodal cilia and for actively motile cilia on multiciliated cells, ciliary organization within the population of cells results in response both to planar cell polarity signaling as well as cilia-generated fluid flow (Fig. 6E, demonstrates ciliary orientation in multiciliated (a) and nodal (b) cells, and axonemal orientation in relation to fluid flow directions (large arrowheads)). Diagrammatically, bending of primary cilia in response to fluid flow almost always is shown with the point of maximal bending positioned centrally on the axoneme (Fig. 6D). However, in published videos of the primary cilium bending in response to fluid flow, the axoneme does not appear to have either the same degree of curvature or the same positioning of the point of maximal curvature as usually depicted diagrammatically (Fig. 6G; bar = 5μm). Figure 6A,F from Seeley and Nachury,2010 (Figures 1,4) used with permission from the Company of Biologists; Figure 6B from Mykytyn et al.,2004 (Figure 5c) used with permission from the National Academy of Scientists; Figure 6C from Boletta and Germino,2003 (Figure 5) used with modification with permission from Elsevier; Figure 6D from Janmey and McCulloch, 2007 (Figure 6) used with permission from Annual Reviews; Figure 6E from Marshall 2010 (Figure 1) used with permission of the Nature Publishing Group; Figure 6G from Schwartz et al.,1997, Am. J. Physiol. Renal Physiol 272 (Figure 2) used with permission of American Physiological Society.
Figure 7
Figure 7. Additional observations of positional relationships of axonemes of primary cilia in a variety of cellular types
In human arterial endothelial cells, primary cilia can be found emerging from a deep ciliary pit, on the luminal side of the cell (Fig. 7A; v = ciliary pit, small arrows = transitional fibers, large arrow = basal foot; bar = 0.1μm). Similarly, murine odontoblasts have primary cilia, again with the axoneme surrounded almost entirely with the microenvironment of the ciliary pit (Fig. 7B; arrow = ciliary axoneme, Ce = centriole; bar = 0.1μm). The full extent of the ciliary pit associated with an articular chondrocyte is seen in Figure 7C (bar = 0.4μm), where only the axonemal tip actually extends into the extracellular matrix. Similarly, in quiescent 3T3 cells grown to confluence, the ciliary axoneme is surrounded for 3/4 of its length by the ciliary pit, before emerging at an angle (Fig. 7D, bar = 0.4μm). In hippocampal neurons, a ciliary pit surrounds over 2/3 of the ciliary axoneme, before it emerges, as seen in this reconstruction from twelve serial sections (Fig. 7E). In chondrocytes, odontoblasts and other cells of connective tissues, the axoneme extends not into a fluid filled lumen, but into a dense extracellular matrix (ECM), and there is evidence of direct attachments between the axoneme and components of the ECM (Fig. 7F). This has led to hypotheses that deflection of the cilium may occur during joint movement causing deformation of the ECM and resulting in signal transduction through the primary cilium (Fig. 7G). Figure 7A from Haust 1987 (Figure 6) used with permission of Springer; Figure 7B from Garant et al.,1968 (Figure 15) used with permission of Elsevier; Figure 7D from Albrecht-Buehler and Bushnell,1980 (Figure 3) used with permission from Elsevier; Figure 7E from Breunig et al.,2008 (Figure 2F) used with permission from the National Academy of Sciences; Figure 7F from Satir and Christensen 2007 (Figure 4) used with permission from Annual Reviews; Figure 7G from Whitfield,2008 (Figure 2) used with permission from Elsevier.
Figure 8
Figure 8. Potential constraints on axonemal movement for non-epithelial primary cilia
In Figure 8A, the axoneme from the cilium of one articular chondrocyte appears to directly contact the plasma membrane of the adjacent chondrocyte, potentially restricting even passive movement of the axoneme in 3-D space. Two examples of close confinement of the ciliary axoneme, essentially sandwiched between the cellular plasma membrane and collagen fibrils of the ECM, are seen in Figures 8B (articular chondrocyte) and 8C (fibroblast). The non-uniform termination of outer microtubular doublets in these axonemes (Fig. 8D) may result in unequal structural rigidity at different levels of the axoneme, facilitating the sharp axonemal bending seen in these cilia. Figures 8E,F,G demonstrate examples of the complexity of axonemal positioning in cells of irregular shape. The cilium (C) emerging from the myoepithelial cell in Fig. 8E appears to make direct contact with a neighboring endothelial cell. In Fig. 8F, the ciliary axoneme (C) of an irregularly shaped endothelial cell (E) emerges into the lumen (L) of the alveolus adjacent to a macrophage (MA). Figure 8G is of a type II interstitial cell (IC type II) in the rat duodenal enteric plexus. This cell, which serves as a pacemaker within the enteric nervous system, is shown with a centriole (ct) and its associated ciliary axoneme (arrow). The latter emerges from the Golgi (g) region of the cell, in close proximity to a nerve trunk (nt). The basal body of the cilium docks on the plasma membrane in a position such that the axoneme directly touches the cellular plasma membrane. The positional relationships of primary cilia in these cells is difficult to describe, yet may be significant for understanding potential function of the cilium in pacemaker activity. Bar = 1μm in all images. Figure 8B from Wilsman and Fletcher,1978 (Figure 9) used with permission from John Wiley and Sons; Figure 8C from Brooker et al.,1971 (Figure 1) used with permission of Wiley-Blackwell; Figure 8D from Wilsman et al.,1980 (Figure 3) used with modification and with permission of John Wiley and Sons; Figures 8E,F from Nickerson 1989 (Figures 1,2 used with permission from Springer; Figure 8G from Escribano et al.,2011 (Figure 4C) used with permission from Histology and Histopathology.
Figure 9
Figure 9. Axonemal orientation in 3-D space in non-epithelial primary cilia
The ciliary profiles in 9A,B,C show that, in a given population of articular chondrocytes, the 3-D orientation of the ciliary axoneme relative to the cell is highly variable. The sectioning plane of these three cells is the same, but the angle of the axoneme varies from essentially orthogonal to the section plane (Fig. 9A) to parallel to the sectioning plane (Fig. 9C). Note that in all three images, the cilium and its associated centriole are closely associated with the Golgi of the cell. In studies of axonemal positioning in a cell, it is critical to follow any given axonemal profile in adjacent serial sections to demonstrate definitive connection of the axoneme to the parent cell. Thus, while the association of the axoneme to the parent cell is clear in Figs. 9B,C, it would be necessary to examine serial sections to verify the relationship of the axonemal profile in Fig. 9A to its associated cell. The non-uniformity of axonemal orientation in 3-D space is demonstrated in Figure 9D in human bronchiolar smooth muscle cells. These axonemes project into the ECM with a level of deflection and curvature that varies from cell to cell. Similarly, in the field of hypothalamic neurons in Figure 9E, axonemes (green) emerge from the associated cells (red) in multiple directions and with multiple degrees of curvature. This is in contrast to the stereotypic uniformity of 3-D orientation of axonemes of primary cilia described in polarized epithelial cells, such as the in the kidney tubule. Bar = 0.2μm in Figures 9B,C; Bar = 10μm in Figures 9D,E. Figure 9D from Wu et al.,2009 (Figure 2A) used with permission from American College of Chest Physicians; Figure 9E from Fuchs and Schwark 2004 (Figure 1) used with permission from Elsevier.
Figure 10
Figure 10. Axonemal orientation in 3-D space in articular chondrocytes and tenocytes
The orientation of the major axis of the cell to the articular surface varies in superficial zone (Fig. 10A, bar = 1μm) and radiate zone (Fig. 10B, bar = 1μm) chondrocytes, making this an interesting contrasting orientation of cells within a population for the study of axonemal orientation in 3-D space. Co-ordinates for this study followed the convention seen in Figure 3A, with Φaxoneme representing the angle of the ciliary axoneme relative to the plane from the articular cartilage to the subchondral bone, varying from 0°-180°. Θaxoneme is the angle of the axoneme relative to the cranial/caudal and medial/lateral planes, varying from 0°-360° (Fig. 10C). The equatorial plots in Figures 10D-F are as if the viewer were looking at the articular cartilage with the surface uppermost. In the weight-bearing region, the patterns of orientation are strikingly different in the superficial zone (Fig. 10D) compared to the radiate zone (Fig. 10E). In addition, orientation is more uniform for superficial zone cells in the weight-bearing region (Fig. 10D) compared to the non-weight-bearing region (Fig. 10F). These three plots demonstrate that, although it is not possible to predict with precision the 3-D orientation of a given cilium, there is a pattern to the 3-D orientation within the population of chondrocytes studied. The rose plots in Figure 10G confirm the more consistent alignment in both zones of weight-bearing regions compared to non-weight-bearing regions. Tenocytes form a synctium of cells, highly aligned with the collagen fibers of the tissue (Figure 10H; bar = 15μm). Analysis through serial-z sections by multiphoton microscopy with axonemes identified by staining with anti-acyl-tubulin (Figure 10J) demonstrated that axonemes for these cells are highly aligned in 3-D space. Θaxoneme parallels the alignment of the collagen in the proximal/distal and medial/lateral planes, and Φaxoneme has a very restricted range, meaning minimal elevation of the axoneme in the anterior/posterior plane (Fig. 10I). Again, although it is not possible to predict the 3-D orientation of the ciliary axoneme for a given cell, the 3-D orientation of axonemes for the population of tenocytes can be defined. Figures 10A,B,C,D,E,F,G from Farnum and Wilsman 2011 (Figures 3c,3f,2a5a,3c,6a,7 respectively); Figure 10I from Donnelly et al.,2008 (Figures 7c,1 respectively); Figure 10J from Donnelly et al.,2009 (Figure 1).
Figure 11
Figure 11. Axonemal positioning and 3-D orientation in ciliopathies
Loss of appropriate positioning and/or 3-D orientation is a characteristic of ciliopathies in sensory and motile cilia, including nodal cilia. Figure 11A shows the resulting lack of appropriate positioning of basal bodies in PCP and IFT Drosophila mutants, even though disruption occurs at different points along the pathway (red boxes). Improper positioning disrupts signaling through the mechanosensory hair cells of the cochlea. The requirement for precision of positioning of the basal body for appropriate axonemal orientation and hence appropriate function also is seen in motile cilia of the mucociliary epidermis of amphibian embryos. In Figure 10B, controls show the polarized morphology of labeled basal bodies, all oriented in the same direction and parallel to each other (white arrows). In disheveled mutants, this organized parallelism is lost (right hand frame). Plots of the angular measurement of individual basal bodies emphasize the difference in degree of alignment in the controls (left) compared to randomness in the mutants (right). Randomized docking leads to inability to generate a proper waveform and loss of motility. Figure 11C (left) shows that, in normal growth plates, the differentiation of chondrocytes is visualized spatially as a highly ordered column of cells and axonemes emerge from adjacent cells along a virtual columnar axis, which is thought to be established post proliferation. The loss of columnation and appropriate shape of chondrocytes in a growth plate chondroma (Fig. 11C, right) correlates with randomization of the position of emergence of the primary cilium from cells. An important line of investigation is to test the hypothesis that this correlation of loss of tissue anisotropy with loss of axonemal positioning relates to the function of the primary cilium in the establishment of tissue anisotropy in growth plates. An example of loss of tissue anisotropy in growth plate ciliary mutants is seen in Figure 11D, contrasting the highly organized columnar arrangement of chondrocytes in a wild type growth plate (top), with the rounding of cells and relative loss of columnation in polaris mutants (bottom). Ciliary positioning and 3-D orientation have not been studied in these mutants, but this would be an appropriate experimental system to analyze the relationship between cellular shape, tissue anisotropy and ciliary positioning and 3-D orientation characteristics. Figure 11A from Goetz and Anderson,2010 (Figure 4) used with permission of the Nature Publishing Group; Figure 11B from Park et al.,2008 (Figure 7a,b,c,d) used with permission of the Nature Publishing Group; Figure 11C from de Andrea et al.,2010 (Figure 6) used with permission of the Nature Publishing Group; Figure 11D from Ochiai et al. 2009 (Figure 4A,B) used with permission of Sage Publishing.

Similar articles

Cited by

References

    1. Abdul-Majeed S, Moloney BC, Nauli SM. Mechanisms regulating cilia growth and cilia function in endothelial cells. Cell Mol Life Sci. 2011 Epub ahead of print. - PMC - PubMed
    1. Absalon S, Kohl L, Branche C, Blisnick T, Toutirais G, Rusconi F, Cosson J, Bonhivers M, Robinson D, Bastin P. Basal body positioning is controlled by flagellum formation in Trypanosoma brucei. PloS ONE. 2007;2:e437. - PMC - PubMed
    1. Afzelius BA. The immotile-cilia syndrome: a microtubule-associated defect. CRC Crit Rev Biochem. 1985;19:63–87. - PubMed
    1. Afzelius BA. Cilia-related diseases. J Pathol. 2004;204:470–477. - PMC - PubMed
    1. Ahrens MJ, Li Y, Jiang H, Dudley AT. Convergent extension movements in growth plate chondrocytes require gpi-anchored cell surface proteins. Development. 2009;136:3463–3474. - PMC - PubMed

Publication types

LinkOut - more resources