. 2011 Dec 15;71(24):7398-409.
doi: 10.1158/0008-5472.CAN-11-2427. Epub 2011 Oct 19.

A framework to select clinically relevant cancer cell lines for investigation by establishing their molecular similarity with primary human cancers

Affiliations

A framework to select clinically relevant cancer cell lines for investigation by establishing their molecular similarity with primary human cancers

Garrett M Dancik et al. Cancer Res. .

Abstract

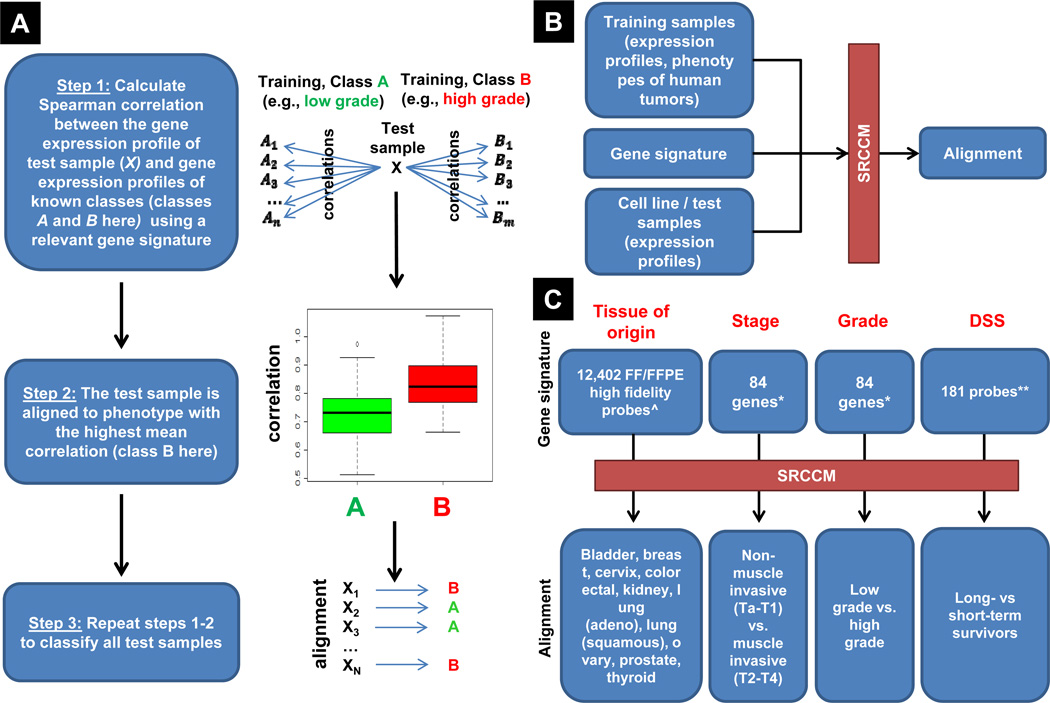
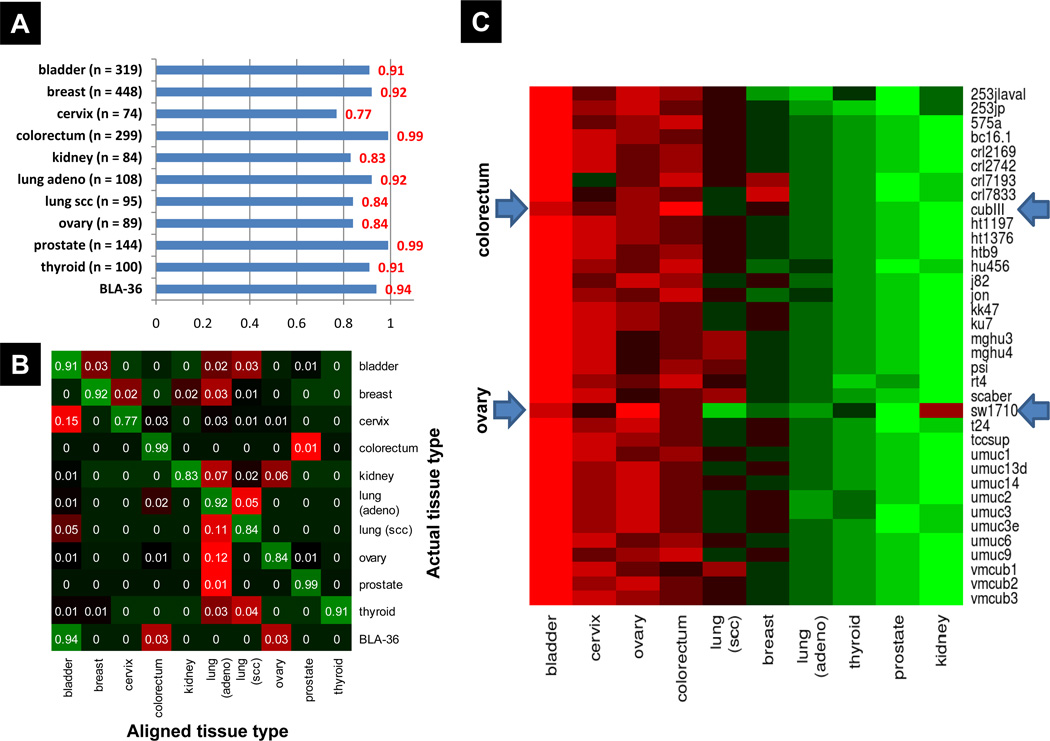
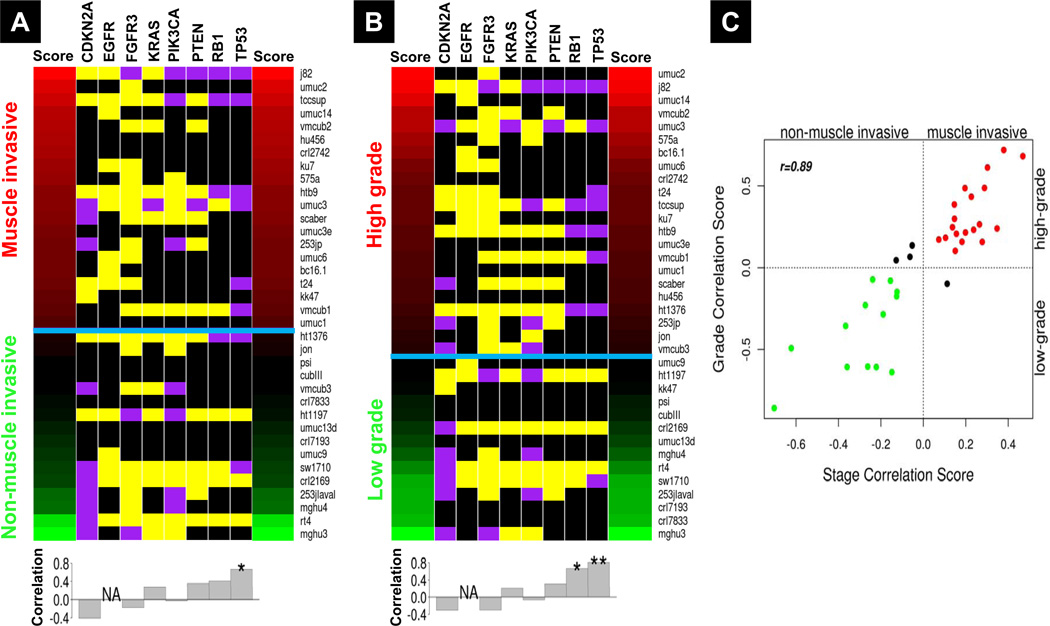
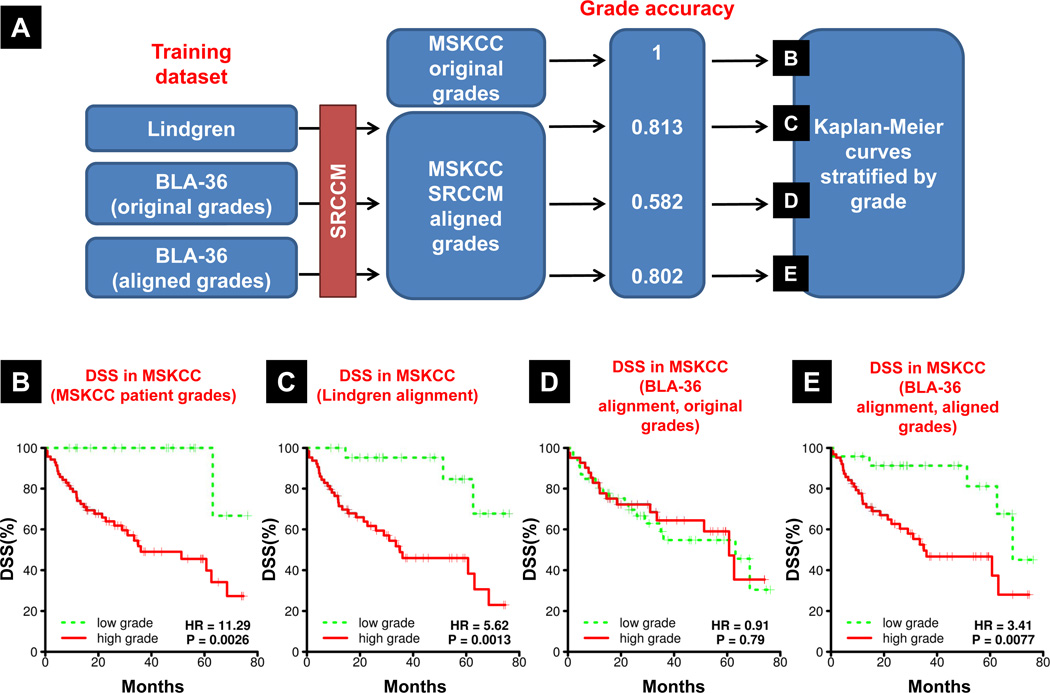
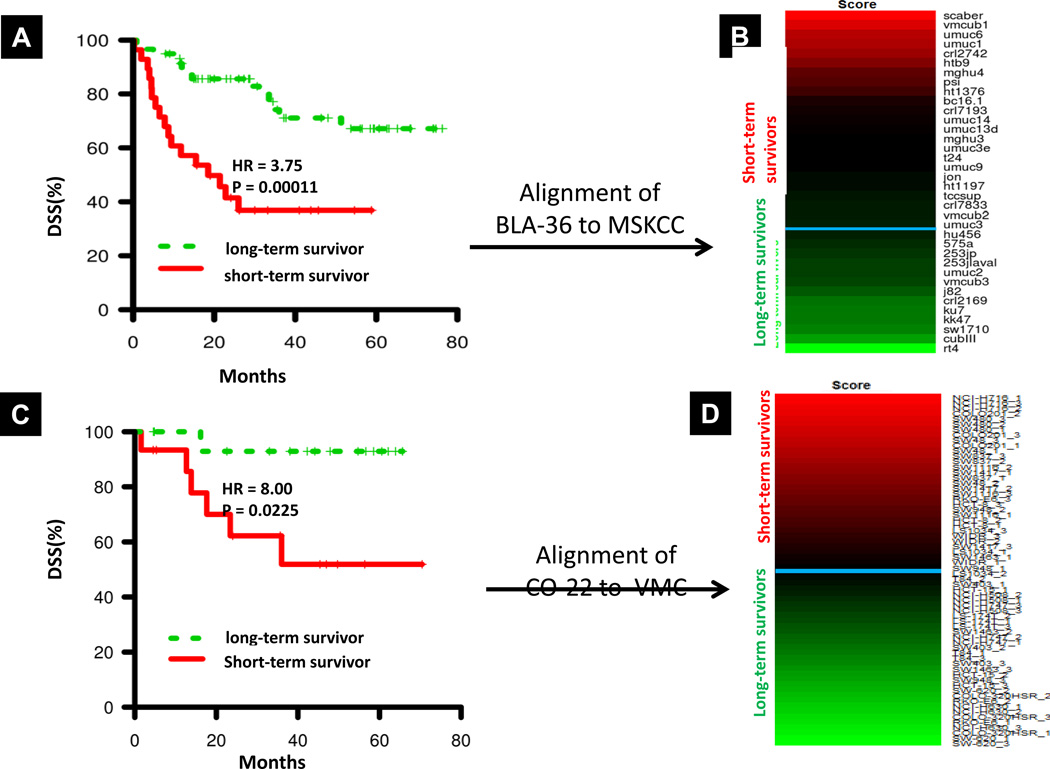
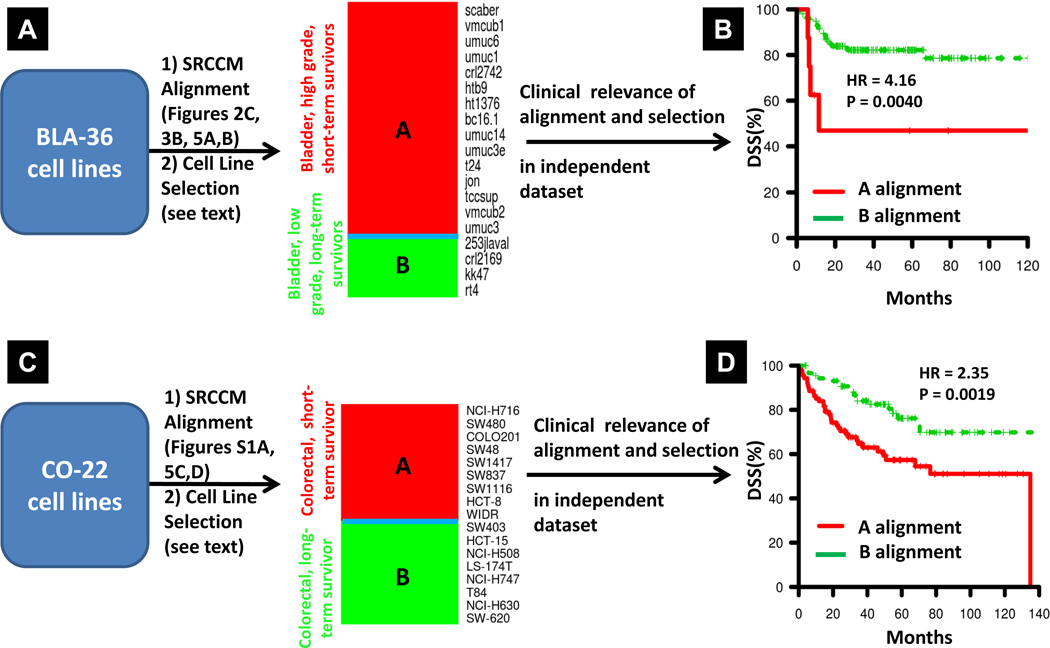
Experimental work on human cancer cell lines often does not translate to the clinic. We posit that this is because some cells undergo changes in vitro that no longer make them representative of human tumors. Here, we describe a novel alignment method named Spearman's rank correlation classification method (SRCCM) that measures similarity between cancer cell lines and human tumors via gene expression profiles, for the purpose of selecting lines that are biologically relevant. To show utility, we used SRCCM to assess similarity of 36 bladder cancer lines with 10 epithelial human tumor types (N = 1,630 samples) and with bladder tumors of different stages and grades (N = 144 samples). Although 34 of 36 lines aligned to bladder tumors rather than other histologies, only 16 of 28 had SRCCM assigned grades identical to that of their original source tumors. To evaluate the clinical relevance of this approach, we show that gene expression profiles of aligned cell lines stratify survival in an independent cohort of 87 bladder patients (HR = 3.41, log-rank P = 0.0077) whereas unaligned cell lines using original tumor grades did not. We repeated this process on 22 colorectal cell lines and found that gene expression profiles of 17 lines aligning to colorectal tumors and selected based on their similarity with 55 human tumors stratified survival in an independent cohort of 177 colorectal cancer patients (HR = 2.35, log-rank P = 0.0019). By selecting cell lines that reflect human tumors, our technique promises to improve the clinical translation of laboratory investigations in cancer.


Conflict of interest statement

Conflicts of Interest: none

Figures

Figure 1
Figure 1
Overview and use of the Spearman’s Rank Correlation Classification Method (SRCCM). A, overview of the SRCCM algorithm for cell line / test sample alignment. A test sample is aligned to the phenotype with the highest mean correlation between test and training gene expression profiles using a relevant gene signature. B, alignment of a test sample with a clinical phenotype using SRCCM is based on the gene expression profiles of the training and test samples and a relevant gene signature for the desired phenotype. C, published and derived gene signatures and phenotypes used by SRCCM for tissue of origin, and bladder cancer stage, grade, and disease specific survival (DSS) alignment. ^ signatures from Ref #; * stage and grade signatures from Ref # are different, despite the same number of genes; ** univariate Cox proportional hazards model, logrank p-value < 0.01 in training cohort from Ref #, see Materials and Methods for details. Abbreviations: FF, fresh frozen; FFPE, formalin fixed and paraffin embedded.
Figure 2
Figure 2
Independent validation and BLA-36 cell line alignment to tissue of origin using the SRCCM algorithm. Test samples and BLA-36 cell lines are aligned to 10 epithelial cancers from a training dataset including bladder, breast, cervix, colorectum, kidney, lung adenocarcinoma (adeno), lung squamous cell carcinoma (scc), ovary, prostate, and thyroid samples (N = 1630). A, tissue specific accuracy of SRCCM alignment algorithm on independent datasets (N= 1690). B, confusion matrix for independent validation presented as a heatmap, with green indicating correct alignment and red indicating incorrect alignment. For each tissue type (i.e., row of the matrix), the proportion of samples aligned with each tissue type is reported. C, BLA-36 tissue of origin alignment heatmap. For each cell line, the color represents the average correlation with each tissue type, with red indicating strong positive correlation and green indicating weak positive correlation. All cell lines are most strongly correlated (i.e., aligned) with bladder, with the exception of CubIII and SW1710 (arrows) which are aligned with colorectum and ovary, respectively.
Figure 3
Figure 3
A, Stage and B, grade alignment heatmaps. Cell lines are ranked by their correlation scores (see Materials and Methods) from high (red) to low (green) and classified as either muscle invasive (MI, T2–T4) or non-muscle invasive (NMI, Ta-T1) for stage and high (G3–G4) or low (G1–G2) grade, separated by a blue horizontal line. The heatmap also contains the documented gene mutations according to the COSMIC database (53), with purple, yellow, and black indicating known mutation, wild-type, and unknown mutation status, respectively. The histograms below the heatmaps show correlations of mutations with each alignment. P-values of Fisher exact tests: *, 0.05≤p<0.1; **, p<0.05. C, Plot of correlation scores for SRCCM assigned stage and grade. Red points denote cell lines aligned with high grade MI tumors, green points denote cell lines aligned with low grade NMI tumors, and all other cell lines are plotted in black.
Figure 4
Figure 4
Original cell line grades no longer correlate with disease specific survival but correlation is restored via SRCCM alignment to patient tumors. A, Overview of the methodology used. MSKCC tumors are aligned to the grades of Lindgren tumors or BLA-36 cell lines using the grades of the tumors they were derived from (original grades) or the assigned grades from alignment with the Lindgren patients (aligned grades). We report the accuracy of MSKCC grade assignment. We then generate KM survival curves based on B, the original patient grades in MSKCC (positive control), C, MSKCC grades based on alignment to Lindgren patient tumors (second positive control), D, MSKCC grades based on alignment to BLA-36 (original grades), and E, MSKCC grades based on alignment to BLA-36 (aligned grades).
Figure 5
Figure 5
Disease specific survival (DSS) in BLA-36 and CO-22 as a function of long- and short-term survivors determined by “median cut” labeling (see Materials and Methods). A, KM survival curves for bladder cancer patients in the training MSKCC dataset obtained through SRCCM alignment and LOOCV. B, DSS alignment heatmap for BLA-36 cell lines. Cell lines are ranked from high (red) to low (green) by their correlation scores (see Materials and Methods) and classified as either long-term or short-term survivors, separated by a horizontal blue line, based on their alignment to long- and short-term survivors in MSKCC. C, KM survival curves for colorectal cancer patients in the training VMC dataset obtained through SRCCM alignment and LOOCV. D, DSS alignment heatmap for CO-22 cell lines. Cell lines are ranked from high (red) to low (green) by their correlation scores (see Materials and Methods) and classified as either long-term or short-term survivors, separated by a horizontal blue line, based on their alignment to long- and short-term survivors in VMC.
Figure 6
Figure 6
Selection and validation of clinically relevant BLA-36 and CO-22 cell lines. A, SRCCM alignment of BLA-36 cell lines to tissue of origin, grade, and DSS. Heatmap of the clinically relevant BLA-36 cell lines aligning with bladder, high grade, and short term-survivors or bladder, low grade, and long-term survivors. The cell lines are ranked by their DSS alignment score. B, validation of the clinical relevance of the selected cell lines in an independent dataset. KM survival curves are generated for patients in CNUH following alignment to the clinically relevant cell lines in (A). C, SRCCM alignment of CO-22 cell lines to tissue of origin and DSS. Heatmap of the clinically relevant CO-22 cell lines having all replicates aligning with colorectum and no ambiguous DSS alignments. The cell lines are ranked by their average DSS alignment score. D, validation of the clinical relevance of the selected cell lines in an independent dataset. KM survival curves are generated for patients in MCC following alignment to the clinically relevant cell lines in (C).

References

    1. Marsit CJ, Houseman EA, Christensen BC, et al. Identification of methylated genes associated with aggressive bladder cancer. PLoS One. 2010;5:e12334. - PMC - PubMed
    1. Inoue K, Slaton JW, Kim SJ, et al. Interleukin 8 expression regulates tumorigenicity and metastasis in human bladder cancer. Cancer Res. 2000;60:2290–2299. - PubMed
    1. Nutt JE, Mellon JK, Qureshi K, Lunec J. Matrix metalloproteinase-1 is induced by epidermal growth factor in human bladder tumour cell lines and is detectable in urine of patients with bladder tumours. Brit J Cancer. 1998;78:215–220. - PMC - PubMed
    1. Saitoh H, Mori K, Kudoh S, Itoh H, Takahashi N, Suzuki T. BCG effects on telomerase activity in bladder cancer cell lines. Int J Clin Oncol. 2002;7:165–170. - PubMed
    1. Zhang YB, Niu HT, Chang JW, Dong GL, Ma XB. EZH2 silencing by RNA interference inhibits proliferation in bladder cancer cell lines. Eur J Cancer Care (Engl) 2011;20:106–112. - PubMed

Publication types

MeSH terms