Review
. 2012 Jan 7;279(1726):3-14.
doi: 10.1098/rspb.2011.1819. Epub 2011 Oct 19.

Shedding new light on opsin evolution

Affiliations
Review

Shedding new light on opsin evolution

Megan L Porter et al. Proc Biol Sci. .

Abstract

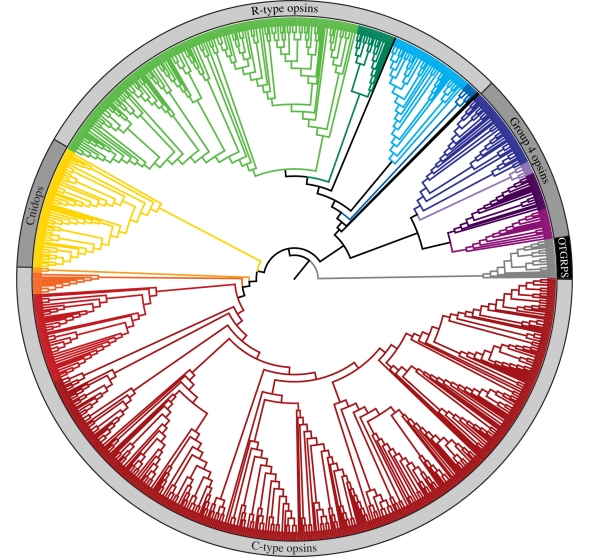
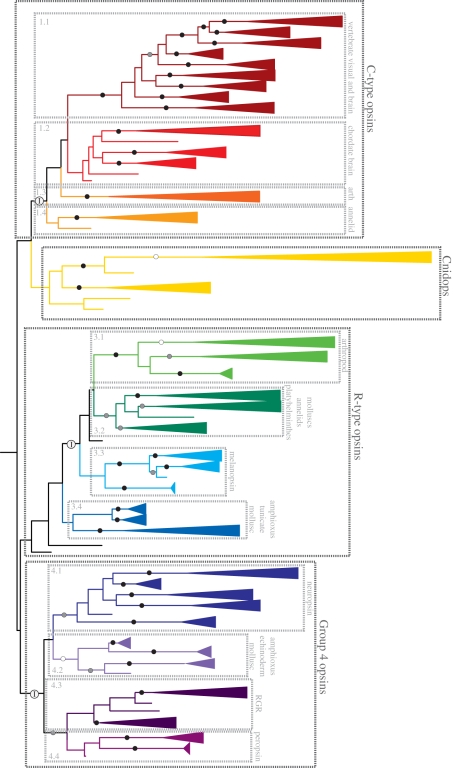
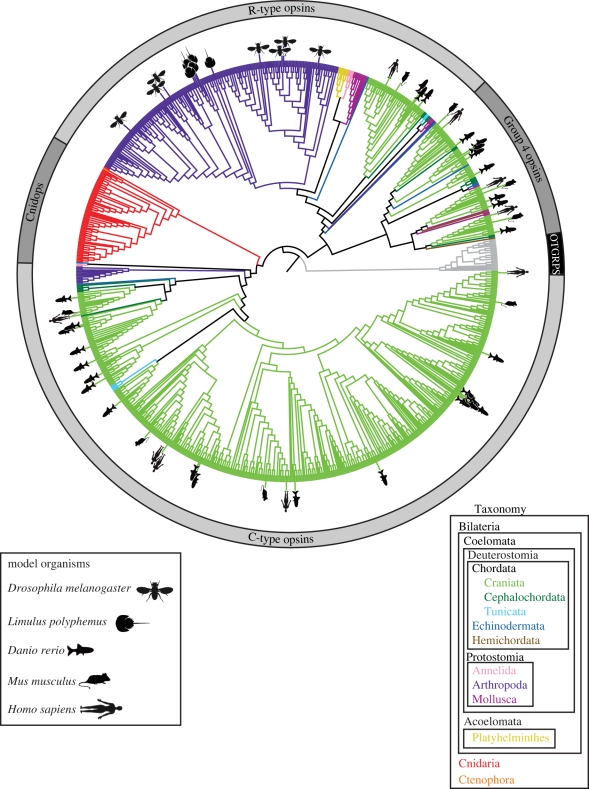
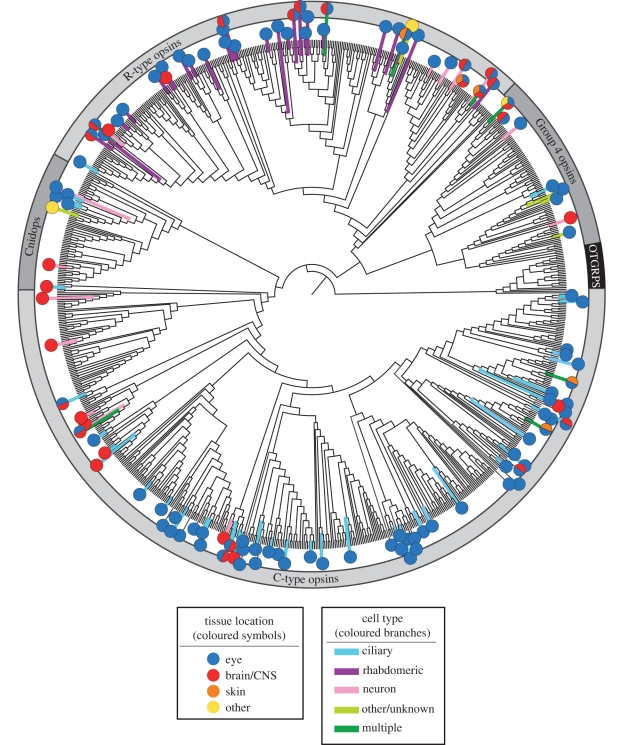
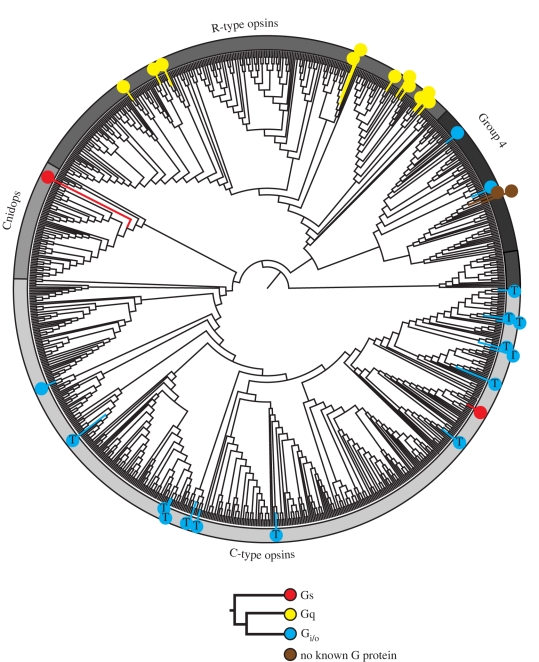
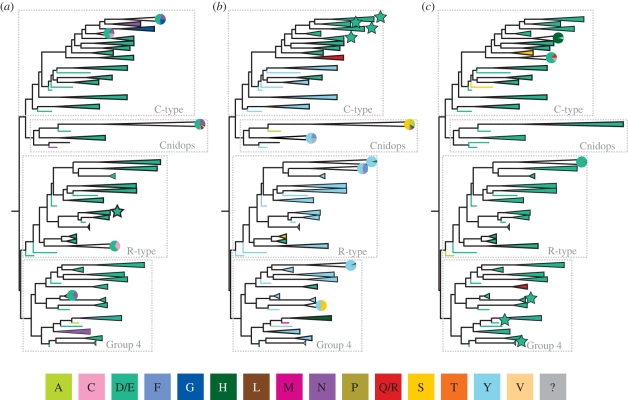
Opsin proteins are essential molecules in mediating the ability of animals to detect and use light for diverse biological functions. Therefore, understanding the evolutionary history of opsins is key to understanding the evolution of light detection and photoreception in animals. As genomic data have appeared and rapidly expanded in quantity, it has become possible to analyse opsins that functionally and histologically are less well characterized, and thus to examine opsin evolution strictly from a genetic perspective. We have incorporated these new data into a large-scale, genome-based analysis of opsin evolution. We use an extensive phylogeny of currently known opsin sequence diversity as a foundation for examining the evolutionary distributions of key functional features within the opsin clade. This new analysis illustrates the lability of opsin protein-expression patterns, site-specific functionality (i.e. counterion position) and G-protein binding interactions. Further, it demonstrates the limitations of current model organisms, and highlights the need for further characterization of many of the opsin sequence groups with unknown function.


Figures

Figure 1.
Figure 1.
Maximum-likelihood tree of 889 genomic and expressed opsin sequences (for reconstruction methods, see electronic supplementary material). The branches of major phylogenetic groups and subgroups have been coloured (see figure 2 for more detail), and the four major opsin clades have been labelled. The closely related, non-opsin GPCRs used to root the tree have branches that have been coloured grey, and the portion of the outer circle denoting outgroups has been coloured black.
Figure 2.
Figure 2.
The maximum-likelihood tree from figure 1 (outgroups not shown), with the branches collapsed into well-supported clades where possible. Per cent bootstrap support exceeding 70% is indicated for the major lineages: white circles, 70–79% support; grey circles 80–89%; black circles, 90–100%. Well-supported clades are coloured by hierarchal classifications of related sequences. C-type opsins–group 1.1: vertebrate visual pigments (Rh1, Rh2, SWS1, SWS2, M/LWS), pinopsins, parapinopsins, vertebrate ancient and parietal opsins; group 1.2: teleost multiple tissue opsins (TMTs), encephalopsins and uncharacterized amphioxus and urchin opsins; group 1.3: honeybee ptersopsin, and uncharacterized insect and Daphnia pulex opsins; group 1.4: uncharacterized Platynereis brain and urchin opsins. Cnidops—Ctenophore and cndiarian opsins, including representatives from hydrozoans, anthozoans and cubozoans. R-type opsins–group 3.1: arthropod visual pigments (M/LWS, SWS); group 3.2: annelid, platyhelminthes and mollusc visual pigments; group 3.3: vertebrate melanopsins 1 and 2, and amphioxus sequences; group 3.4: uncharacterized tunicate, amphioxus and mollusc opsins. Group 4 Opsins IT–group 4.1: four separate clades of neuropsins, and amphioxus and urchin opsins; group 4.2: amphioxus, echinoderm and scallop opsins; group 4.3: RGR and uncharacterized mollusc opsins; group 4.4: peropsins, amphioxus and hemichordate opsins. For more detailed information on the members of each group, please see the electronic supplementary material. Major groups also supported by intron analyses have been indicated by white circles containing an ‘I’.
Figure 3.
Figure 3.
Maximum-likelihood phylogeny as in figure 1, but with branches coloured by major taxonomic groups as indicated by the key in the lower right. Opsin sequences from the genomes of the model organisms most commonly used for vision studies (e.g. Drosophia melanogaster, Limulus polyphemus, Homo sapiens, Mus musculus, Danio rerio) have been indicated by symbols as indicated in the figure legend, lower left.
Figure 4.
Figure 4.
Maximum-likelihood phylogeny as in figure 1. Based on a literature review, with emphasis on poorly understood or more recently discovered opsins, the branches have been coloured to indicate the photoreceptor cell type, and symbols have been used to illustrate the tissues where each opsin is known to be expressed (see figure key). Acceptable data used for determining cell type or tissue location include in situ hybridization, immunohistochemistry and single cell or tissue-specific reverse transcription-polymerase chain reaction studies. Some opsin sequences had information for tissue location, but not cell type. Opsin sequences that have been found in more than one tissue type have been represented by pie charts. In addition to ‘ciliary’ and ‘rhabdomeric’ cell types, cells are also classed as ‘neurons’ (including retinal and cerebral ganglion and interneuronal cells, as well as cnidarian neural net neurons) and ‘others’ (including epithelial cells in the retina and skin). Tissue location characters include ‘eyes’ (lateral or primary eyes), ‘CNS’ (brains or nerve nets, including specific photosensitive regions within the CNS such as pineal organs, parietal eyes and dorsal ocelli), ‘skin’ (epidermis, chromatophores, melanophores and iridophores) and ‘others’ (gonads and bioluminescent organs). For data related to specific sequences, and their related references, refer to the electronic supplementary material.
Figure 5.
Figure 5.
Maximum-likelihood phylogeny as in figure 1. Coloured symbols have been placed on the tree at locations where the G-protein-binding partner is known for a particular opsin sequence (see legend). Opsins known to couple with transducin are indicated by a Gi/o symbol containing the letter ‘T’. Based on a review of available literature, all the represented G-protein/opsin pairs were determined by either electrophysiological, biochemical or molecular analyses. For specific methods and references, please refer to the electronic supplementary material.
Figure 6.
Figure 6.
Maximum-likelihood phylogeny as in figure 2, with the four major lineages indicated. Each well-supported clade has been coloured based on the residue present at three potential counterion sites: (a) bovine rhodopsin site 83, (b) bovine rhodopsin site 113, and (c) bovine rhodopsin site 181. For each group, if more than one amino acid with significantly different properties is found at a particular site, a pie chart representing the proportion of each residue within the group is included. Groups where the counterion position has been demonstrated using biochemical techniques are indicated with a star. The colours used to indicate amino acids are in the figure key; polarity of the reconstructed amino acids is as follows: non polar: A, F, L, M, P, V; no charge: C, G, N, Q, R, S, T, Y; negative: D, E; positive: H, Q, R. Amino acid residues unknown owing to unavailable data are indicated by a ‘?’ and are coloured grey in the figure.

Similar articles

Cited by

References

    1. Marmor M. F., Martin L. J. 1978. 100 years of the visual cycle. Survey of Ophthalmology 22, 279–28510.1016/0039-6257(78)90074-7 (doi:10.1016/0039-6257(78)90074-7) - DOI - DOI - PubMed
    1. Wald G. 1967. George Wald Nobel Prize Lecture. In Nobel lectures, physiology or medicine 2963-1970. Amsterdam, The Netherlands: Elsevier Publishing Company
    1. Nathans J., Hogness D. S. 1983. Isolation, sequence analysis, and intron–exon arrangement of the gene encoding bovine rhodopsin. Cell 34, 807–81410.1016/0092-8674(83)90537-8 (doi:10.1016/0092-8674(83)90537-8) - DOI - DOI - PubMed
    1. Zuker C. S., Cowman A. F., Rubin G. M. 1985. Isolation and structure of a rhodopsin gene from D. melanogaster. Cell 40, 851–85810.1016/0092-8674(85)90344-7 (doi:10.1016/0092-8674(85)90344-7) - DOI - DOI - PubMed
    1. Arendt D. 2003. Evolution of eyes and photoreceptor cell types. Int. J. Dev. Biol. 47, 563–571 - PubMed

Publication types