. 2011 Dec;60(12):3110-20.
doi: 10.2337/db11-0061. Epub 2011 Oct 19.

Elevated glucose represses liver glucokinase and induces its regulatory protein to safeguard hepatic phosphate homeostasis

Affiliations

Elevated glucose represses liver glucokinase and induces its regulatory protein to safeguard hepatic phosphate homeostasis

Catherine Arden et al. Diabetes. 2011 Dec.

Abstract

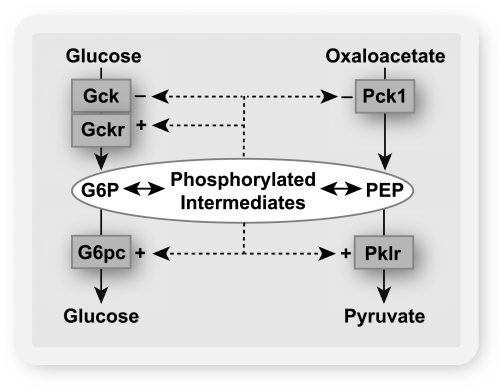
Objective: The induction of hepatic glucose 6-phosphatase (G6pc) by glucose presents a paradox of glucose-induced glucose intolerance. We tested whether glucose regulation of liver gene expression is geared toward intracellular homeostasis.

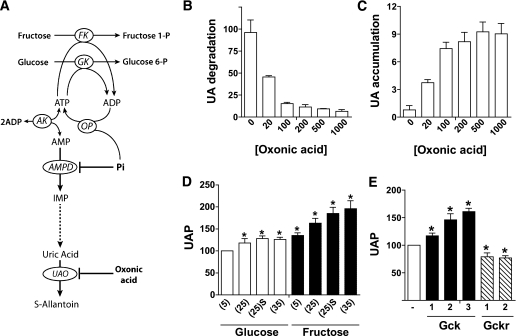
Research design and methods: The effect of glucose-induced accumulation of phosphorylated intermediates on expression of glucokinase (Gck) and its regulator Gckr was determined in hepatocytes. Cell ATP and uric acid production were measured as indices of cell phosphate homeostasis.

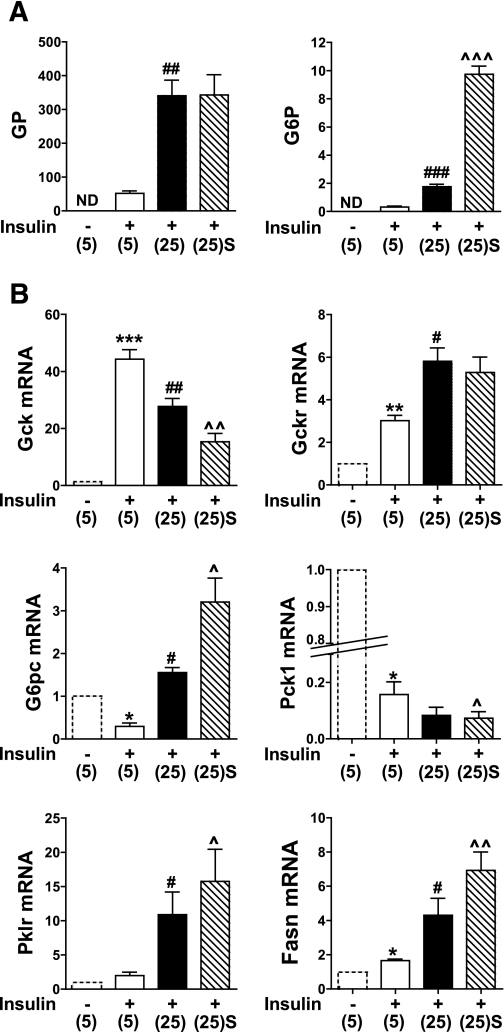
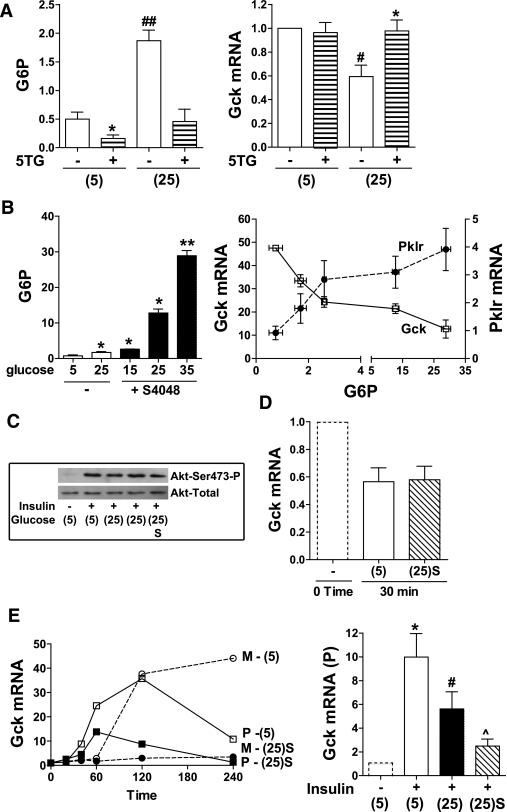
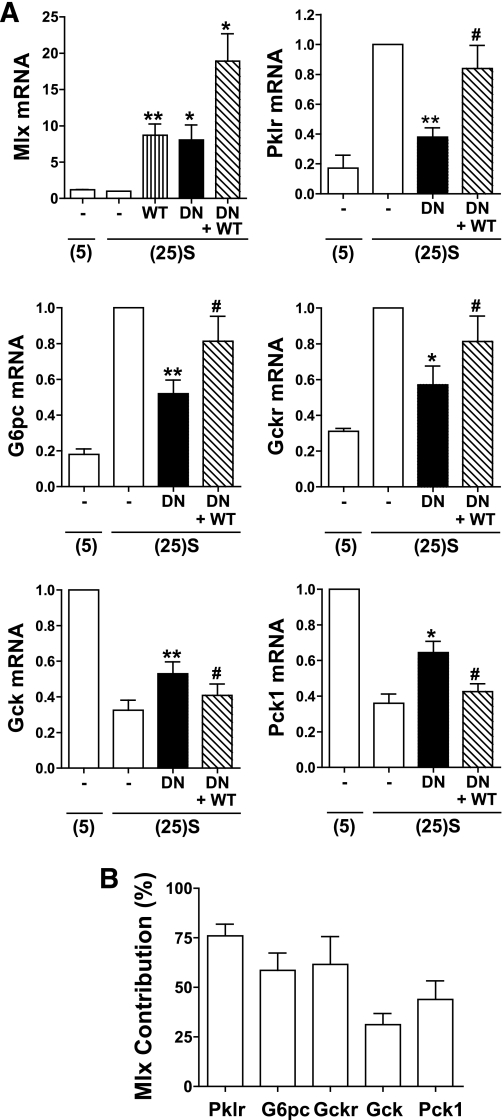
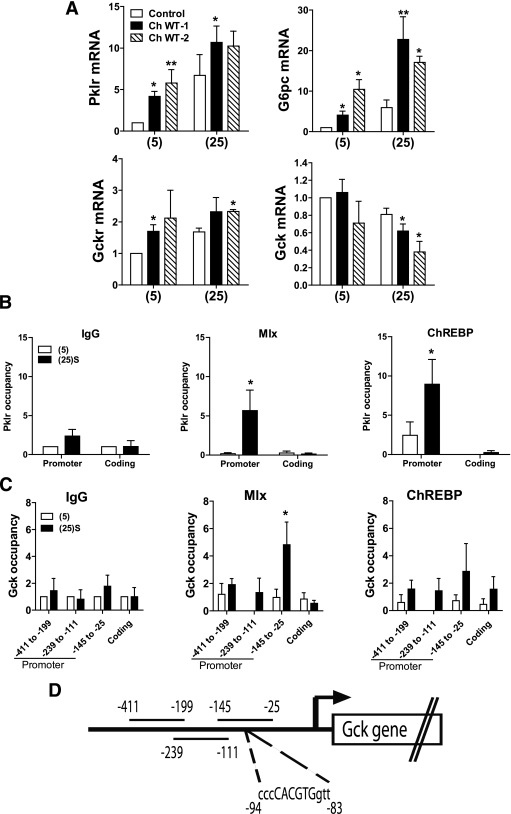
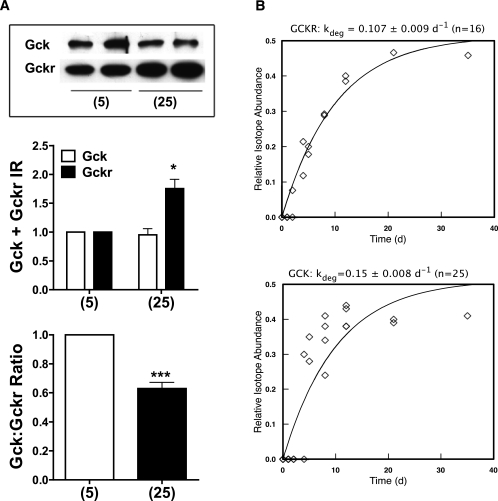
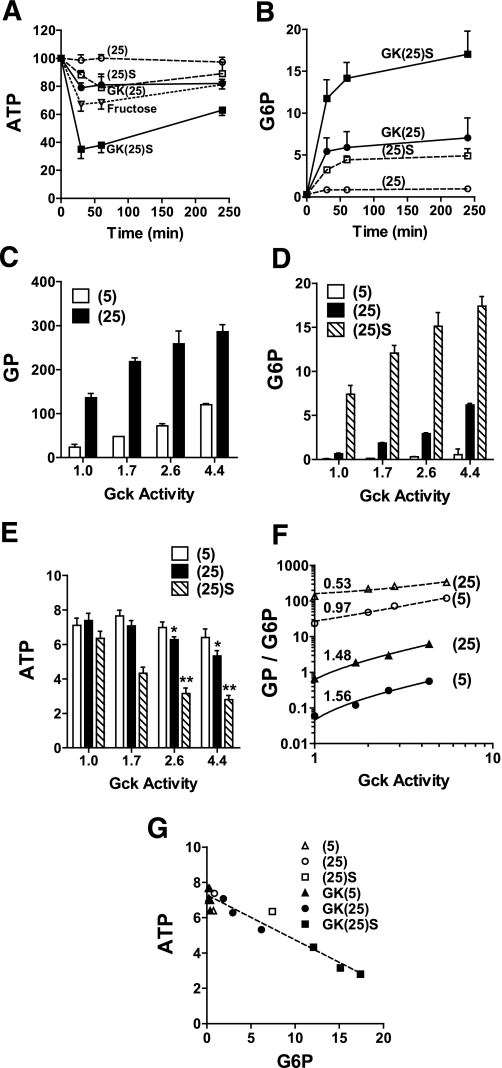
Results: Accumulation of phosphorylated intermediates in hepatocytes incubated at elevated glucose induced rapid and inverse changes in Gck (repression) and Gckr (induction) mRNA concomitantly with induction of G6pc, but had slower effects on the Gckr-to-Gck protein ratio. Dynamic metabolic labeling in mice and liver proteome analysis confirmed that Gckr and Gck are low-turnover proteins. Involvement of Max-like protein X in glucose-mediated Gck-repression was confirmed by chromatin immunoprecipitation analysis. Elevation of the Gck-to-Gckr ratio in hepatocytes was associated with glucose-dependent ATP depletion and elevated urate production confirming compromised phosphate homeostasis.

Conclusions: The lowering by glucose of the Gck-to-Gckr ratio provides a potential explanation for the impaired hepatic glucose uptake in diabetes. Elevated uric acid production at an elevated Gck-to-Gckr ratio supports a role for glucose regulation of gene expression in hepatic phosphate homeostasis.


Figures

FIG. 1.
FIG. 1.
Hypothesis: glucose-regulated gene expression in the liver is a mechanism for intracellular homeostasis of phosphorylated intermediates. When the hepatocyte is challenged with elevated glucose, the increase in the concentrations of phosphorylated intermediates represses enzymes that catalyze the entry of substrate into the phosphometabolite pool (Gck and Pck1) and induces enzymes (G6pc and Pklr) that catalyze depletion of phosphorylated intermediates. Gckr is the inhibitor protein of Gck.
FIG. 2.
FIG. 2.
Glucose represses Gck expression concomitantly with induction of G6pc and Pklr. Hepatocytes were precultured for 18 h in medium containing 5 mmol/L glucose and then incubated for 4 h in fresh MEM without (hatched line) or with 10 nmol/L insulin and 5 mmol/L (5) or 25 mmol/L glucose (25) without or with 2 μmol/L S4048 [(25)S]. A: Glucose phosphorylation (GP, nmol/h mg protein) and glucose 6-P (G6P, nmol/mg protein). B: mRNA levels of the target genes indicated expressed relative to 5 mmol/L glucose without insulin (first bar). Means ± SEM, n = 3–6. *P < 0.05, **P < 0.01, ***P < 0.005, effect of insulin; #P < 0.05, ##P < 0.01, ###P < 0.005, effect of substrate; ^P < 0.05, ^^P < 0.01, ^^^P < 0.005, effect of S4048. ND, not determined.
FIG. 3.
FIG. 3.
Glucose metabolites repress Gck expression. A: Hepatocytes were incubated for 4 h with 10 nmol/L insulin at 5 mmol/L (5) or 25 mmol/L glucose (25) −/+ 3 mmol/L 5-thioglucose (5TG) for determination of glucose 6-P (G6P, nmol/mg protein) and Gck mRNA (expressed relative to 5 mmol/L glucose). Means ± SEM, n = 3. *P < 0.05, effect of 5-thioglucose; #P < 0.05, ##P < 0.01, effect of 25 mmol/L glucose. B: Hepatocytes were incubated for 4 h with 10 nmol/L insulin and glucose (5, 15, or 35 mmol/L) without (open bars) or with 2 μmol/L S4048 (filled bars) for determination of glucose 6-P (nmol/mg protein) and Gck and Pklr mRNA plotted against the respective glucose 6-P. n = 3. *P < 0.05, **P < 0.01. C: Hepatocytes were incubated for 1 h with the additions indicated [5 mmol/L (5) or 25 mmol/L glucose (25) or 25 mmol/L glucose + S4048 (25)S]. Immunoblots to Akt-S473-P and total-Akt, representative of two experiments. D: Hepatocytes were preincubated for 4 h with 10 nmol/L insulin. Gck mRNA decay was determined as described in the research design and methods with 5 mmol/L or 25 mmol/L glucose + S4048 [(25)S]. mRNA levels are expressed relative to time 0. Means ± SEM, n = 4. E: Time course (20–240 min) with insulin at 5 mmol/L glucose or 25 mmol/L glucose + 2 μmol/L S4048. Gck-mRNA: mature transcript (M) and primary transcript (P) expressed relative to time 0. Representative of three experiments. Gck-mRNA primary transcript after 4-h incubation with the additions shown (fold change relative to control without insulin). Means ± SEM, n = 4. *P < 0.05, effect of insulin; #P < 0.05, relative to 5 mmol/L glucose + insulin; ^P < 0.05, effect of S4048.
FIG. 4.
FIG. 4.
Involvement of Mlx in the glucose repression of Gck. Hepatocytes were either untreated (open bars) or treated with vectors for expression of Mlx-DN or Mlx-WT. After 18-h preculture they were incubated for 4 h at either 5 mmol/L glucose (5) or 25 mmol/L glucose + 2 μmol/L S4048 [(25)S]. A: mRNA levels expressed relative to untreated cells at 25 mmol/L glucose + 2 μmol/L S4048. Means ± SEM, n = 4. *P < 0.05, **P < 0.01, effect of Mlx-DN; #P < 0.05, effect of Mlx-WT. B: Fractional contribution of Mlx to glucose-regulated gene expression calculated from the Mlx-DN attenuation relative to the glucose response calculated from the data in A.
FIG. 5.
FIG. 5.
Glucose-dependent binding of Mlx to the Gck promoter. A: Effects of overexpression of ChREBP-WT on Pklr, G6pc, Gckr, and Gck mRNA expression. Hepatocytes were either untreated (open bars) or treated with vectors for expression of ChREBP-WT at two viral titres (twofold dilution). After 18-h preculture, they were incubated for 4 h with 5 mmol/L (5) or 25 mmol/L (25) glucose. mRNA levels are expressed relative to untreated at 5 mmol/L glucose. Means ± SEM, n = 4–10. *P < 0.05, **P < 0.001, effect of ChREBP-WT. B and C: Recruitment of Mlx and ChREBP to the Pklr promoter and the Gck promoter. Hepatocytes were incubated for 4 h with 5 mmol/L glucose or 25 mmol/L glucose + 2 μmol/L S4048 [(25)S]. Chromatin immunoprecipitation was performed as described in research design and methods using either control IgG, or antibody to Mlx or ChREBP. The promoter and coding regions of the Pklr (B) and Gck (C) genes were amplified by real-time RT-PCR and binding of Mlx and ChREBP is expressed relative to the IgG control at 5 mmol/L glucose. For Pklr, the carbohydrate response element–containing region (30) of the promoter was amplified. For Gck, three regions of the promoter (29) spanning the residues indicated (D) were amplified. Results are means ± SEM, n = 4. *P < 0.05 relative to 5 mmol/L glucose.
FIG. 6.
FIG. 6.
Gck and Gckr immunoactivity in hepatocytes and protein turnover in vivo. A: Rat hepatocytes were cultured for 48 h with the substrates indicated and immunoactivity to Gck and Gckr was determined by immunoblotting and quantified by densitometry. Results are means ± SEM, n = 4. *P < 0.05, ***P < 0.005 relative to 5 mmol/L glucose. B: Turnover of Gck and Gckr in vivo in mice fed a diet containing [2H8]valine at a relative abundance of 0.5. As proteins become labeled, the valine in peptides approaches the precursor monoexponentially. The delay in labeling at day (d) 1–2 reflects equilibration of the body pools with the ingested label and does not influence the estimate of the rate constant. Turnover was calculated by nonlinear curve-fitting of the labeling curve. Gckr: half-life 6.5 days; Gck half-life, 4.6 days.
FIG. 7.
FIG. 7.
Overexpression of Gck compromises hepatocyte glucose 6-P and ATP homeostasis. Hepatocytes were untreated or treated with three titres of adenoviral vector for expression of Gck (by 1.7–4.4 fold relative to endogenous Gck activity) and cultured for 18 h in MEM containing 5 mmol/L glucose as described in research design and methods. A and B: Time course of hepatocyte ATP and glucose 6-P in untreated hepatocytes (open symbols) or cells with fourfold Gck overexpression (filled symbols) incubated in MEM containing 25 mmol/L glucose without (25) or with 2 μmol/L S4048 [(25)S] or with 5 mmol/L fructose (open triangle). C–E: Rates of glucose phosphorylation (metabolism of [2-3H]glucose) and cell glucose 6-P and ATP determined after 60-min incubation with 5 mmol/L or 25 mmol/L glucose without or with 2 μmol/L S4048, in hepatocytes expressing endogenous Gck (1) or 1.7–4.4 Gck overexpression. Means ± SEM, n = 4. *P < 0.05; **P < 0.005 relative to corresponding ATP values at endogenous Gck activity. F: Double log plot of glucose phosphorylation (open symbols) or glucose 6-P (filled symbols) vs. corresponding Gck activity (data from C and D). G: ATP vs. glucose 6-P (data from D and E).
FIG. 8.
FIG. 8.
Glucose metabolism affects uric acid production by hepatocytes. A: Uric acid is the final product of purine degradation in humans because of lack of a functional urate oxidase (UAO) gene. In other mammals, uric acid is further metabolized to S-allantoin by urate oxidase. AMP-deaminase (AMPD) catalyses the conversion of AMP to inosine monophosphate and is inhibited by physiological concentrations of Pi. During ATP-dependent phosphorylation of fructose or glucose, the ADP generated at the level of fructokinase (FK) or glucokinase (GK) is reconverted to ATP by oxidative phosphorylation (OP). If accumulation of phosphorylated intermediates during sugar metabolism causes depletion of Pi, then AMPD is deinhibited, resulting in degradation of AMP to uric acid. B: Oxonic acid inhibits uric acid degradation. Rat hepatocytes were incubated for 30 or 60 min in medium containing 100 μmol/L uric acid and the concentrations of oxonic acid (μmol/L) shown. Uric degradation is expressed as nmol/h per mg protein. C: Effects of oxonic acid on uric acid accumulation in the medium (nmol/h per mg) during incubation of hepatocytes in medium containing 30 mmol/L fructose and the oxonic acid concentrations (μmol/L) indicated. D: Effects of glucose and fructose on uric acid production (UAP, expressed as % control) in hepatocytes incubated for 1 h in medium containing 500 μmol/L oxonic acid and the substrates indicated (5, 25, or 35 mmol/L substrate or 25 mmol/L substrate + S4048 [(25)S]). E: Uric acid production (expressed as % control) in hepatocytes treated with adenoviral vectors for overexpression of Gck (2.5 to 10-fold) or Gckr (four- to sixfold) and incubated for 1 h in medium containing 25 mmol/L glucose. Means ± SEM, n = 3 (B and C); n = 3–7 (D and E). *P < 0.05 relative to 5 mmol/L glucose (D) or relative to untreated (E).

Similar articles

Cited by

References

    1. Agius L. Glucokinase and molecular aspects of liver glycogen metabolism. Biochem J 2008;414:1–18 - PubMed
    1. Agius L, Peak M, Newgard CB, Gomez-Foix AM, Guinovart JJ. Evidence for a role of glucose-induced translocation of glucokinase in the control of hepatic glycogen synthesis. J Biol Chem 1996;271:30479–30486 - PubMed
    1. Van Schaftingen E. Glycolysis revisited. Diabetologia 1993;36:581–588 - PubMed
    1. de la Iglesia N, Mukhtar M, Seoane J, Guinovart JJ, Agius L. The role of the regulatory protein of glucokinase in the glucose sensory mechanism of the hepatocyte. J Biol Chem 2000;275:10597–10603 - PubMed
    1. Iynedjian PB. Molecular physiology of mammalian glucokinase. Cell Mol Life Sci 2009;66:27–42 - PMC - PubMed

Publication types

MeSH terms

Substances