. 2011 Dec;60(12):3121-31.
doi: 10.2337/db11-0571. Epub 2011 Oct 19.

Control of blood glucose in the absence of hepatic glucose production during prolonged fasting in mice: induction of renal and intestinal gluconeogenesis by glucagon

Affiliations

Control of blood glucose in the absence of hepatic glucose production during prolonged fasting in mice: induction of renal and intestinal gluconeogenesis by glucagon

Elodie Mutel et al. Diabetes. 2011 Dec.

Abstract

Objective: Since the pioneering work of Claude Bernard, the scientific community has considered the liver to be the major source of endogenous glucose production in all postabsorptive situations. Nevertheless, the kidneys and intestine can also produce glucose in blood, particularly during fasting and under protein feeding. The aim of this study was to better define the importance of the three gluconeogenic organs in glucose homeostasis.

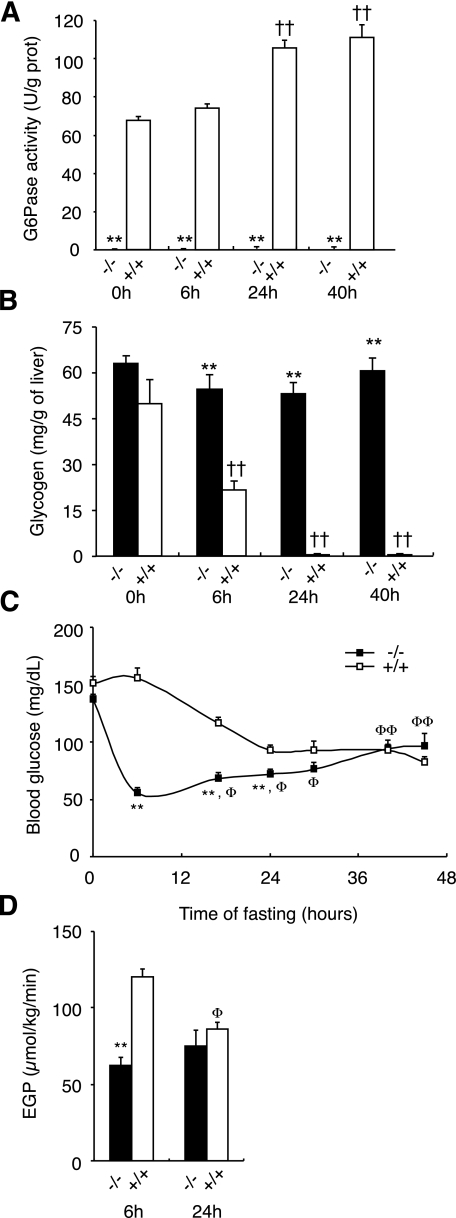
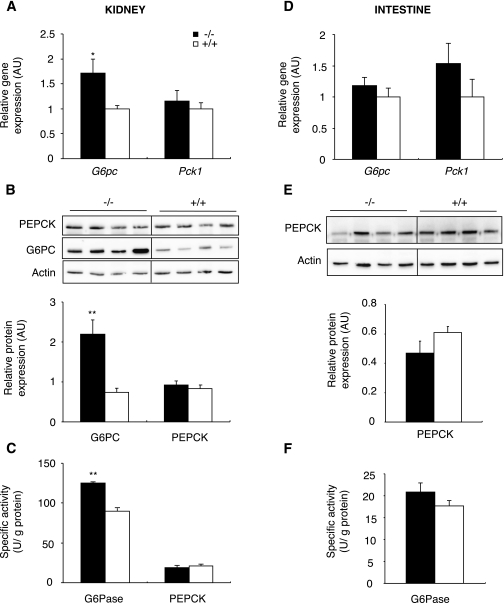
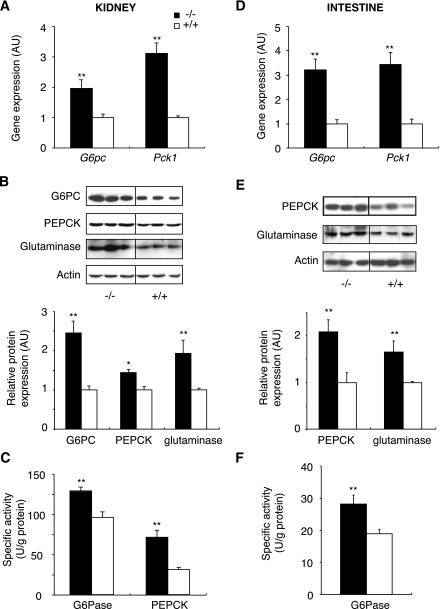
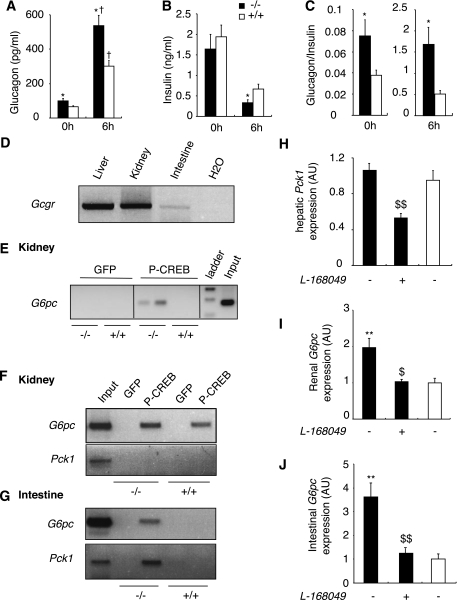
Research design and methods: We investigated blood glucose regulation during fasting in a mouse model of inducible liver-specific deletion of the glucose-6-phosphatase gene (L-G6pc(-/-) mice), encoding a mandatory enzyme for glucose production. Furthermore, we characterized molecular mechanisms underlying expression changes of gluconeogenic genes (G6pc, Pck1, and glutaminase) in both the kidneys and intestine.

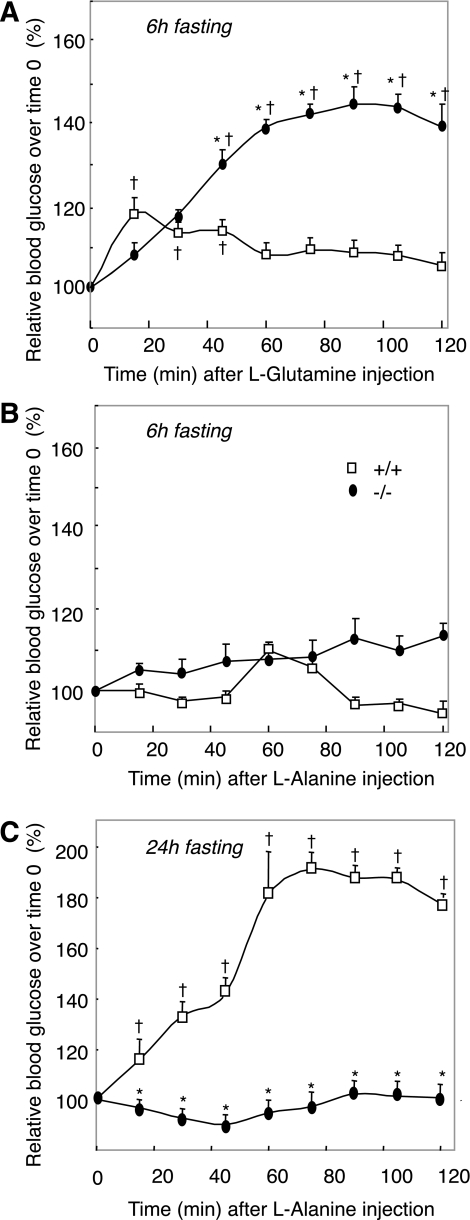
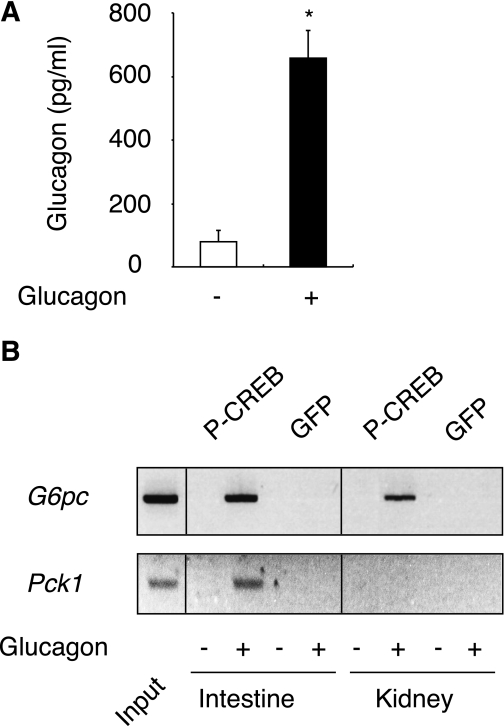
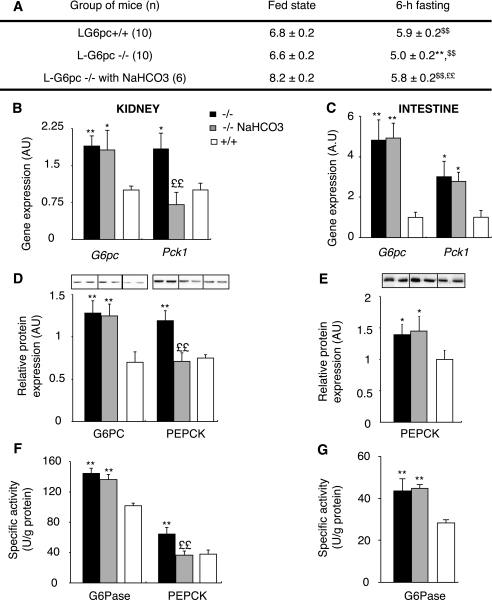
Results: We show that the absence of hepatic glucose release had no major effect on the control of fasting plasma glucose concentration. Instead, compensatory induction of gluconeogenesis occurred in the kidneys and intestine, driven by glucagon, glucocorticoids, and acidosis. Moreover, the extrahepatic action of glucagon took place in wild-type mice.

Conclusions: Our study provides a definitive quantitative estimate of the capacity of extrahepatic gluconeogenesis to sustain fasting endogenous glucose production under the control of glucagon, regardless of the contribution of the liver. Thus, the current dogma relating to the respective role of the liver and of extrahepatic gluconeogenic organs in glucose homeostasis requires re-examination.


Figures

FIG. 1.
FIG. 1.
Hepatic glucose production is not crucial for the control of fasting glycemia. G6Pase activities (A) and glycogen content (B) were assayed in the liver of L-G6pc−/− (black bar) and WT (white bar) mice in the fed state (0 h) or in fasted states (6 h, 24 h, and 40 h; n = 5 to 6 mice per group). C: Blood glucose concentrations were determined afterward for 0, 6, 16, 24, 30, 40, and 45 h fasting in L-g6pc−/− and WT mice. D: EGP was determined in conscious L-G6pc−/− (black bar) and WT (white bar) mice fasted for 6 h or 24 h (n = 6 mice per group). Mice had free access to water during fasting. Data were obtained 5 weeks after gene deletion and are expressed as means ± SEM. Values significantly different from WT (**P < 0.01). ††, significantly different with respect to the value in fed state in each group (P < 0.01). Φ and ΦΦ, significantly different with respect to the value at 6 h of fasting in each group (P < 0.05 and P < 0.01, respectively).
FIG. 2.
FIG. 2.
Expression of main gluconeogenic enzymes in the kidneys (AC) and the intestine (DF) of fed L-G6pc−/− mice. A and D: Level of G6pc and Pck1 mRNA expressed as a ratio relative to the Rpl19 mRNA level. B and E: Western blot and quantification analysis for G6PC and PEPCK-C proteins. Actin is shown as a loading control. C and F: Specific G6Pase and PEPCK-c activity of homozygous L-G6pc−/− (black bar) and WT (white bar) mice. Data were obtained 5 weeks after gene deletion in fed mice (n = 6 mice per group) and are expressed as the mean ± SEM. Values significantly different from WT (*P < 0.05, **P < 0.01) are indicated. AU, arbitrary units.
FIG. 3.
FIG. 3.
Expression of main gluconeogenic enzymes in the kidneys (AC) and the intestine (DF) of 6 h–fasted L-G6pc−/− mice. A and D: Level of G6pc and Pck1 mRNA expressed as a ratio relative to Rpl19 mRNA level. B and E: Western blot analysis and quantification for G6PC, PEPCK-C, and glutaminase proteins. Actin is shown as a loading control. Results are expressed as fold induction versus WT. C and D: Specific G6Pase and PEPCK-c activity of homozygous L-G6pc−/− (black bar) and WT (white bar) mice. Data were obtained 5 weeks after gene deletion, in mice fasted for 6 h (n = 6 mice per group), and are expressed as means ± SEM. Values significantly different from WT (*P < 0.05, **P < 0.01) are indicated.
FIG. 4.
FIG. 4.
Glutamine and alanine tolerance tests in L-G6pc−/− and WT mice . After 6 h (A and B) or 24 h (C) of fasting, L-G6pc−/− (black circles) and WT (open squares) mice were injected with glutamine (A) or alanine (B and C). Blood glucose levels were measured every 15 min for 2 h. Data were obtained 5 weeks after tamoxifen treatment. Percent values relative to time 0 were expressed as means ± SEM (n = 6 mice/group). Values significantly different from WT (*P < 0.01); †significantly different with respect to the value before alanine or glutamine injection (P < 0.01).
FIG. 5.
FIG. 5.
Glucagon regulates gluconeogenic gene expression in the kidneys and intestine of L-G6pc−/− mice. Plasma glucagon (A), plasma insulin (B), and glucagon-to-insulin ratio (C) of fed or 6 h–fasted L-G6pc−/− (black bars) and control (white bars) mice are shown. D: RT-PCR analysis of the expression of glucagon receptor in the liver, kidney, and intestine of control mice fasted for 6 h. E-G: P-CREB binding to the G6pc or Pck1 promoter was analyzed by ChiP assay from kidneys or intestine of fed mice (E) or 6 h–fasted mice (F and G). H: Level of Pck1 mRNA expressed as a ratio relative to Rpl19 mRNA level in the liver of L-G6pc−/− mice treated or not with GcgR antagonist L-168,049 (black bars) and WT mice (white bars) fasted for 6 h. I and J: Level of G6pc mRNA expressed as a ratio relative to Rpl19 mRNA level in the kidneys (I) and intestine (J) of L-G6pc−/− mice treated or not with GcgR antagonist L-168,049 (black bars) and WT mice (white bars) fasted for 6 h. Data were obtained 5 weeks after gene deletion (n = 6 mice per group) and are expressed as means ± SEM. Values significantly different from WT (*P < 0.05, **P < 0.01) and untreated L-G6pc−/− mice ($P < 0.05, $$P < 0.01) are indicated. †, significantly different fed state (P < 0.01).
FIG. 6.
FIG. 6.
Glucagon induces P-CREB binding to G6pc and Pck1 promoters in WT mice. A: Plasma glucagon of WT mice injected with saline solution (white bar) or glucagon (black bar). Values significantly different from saline solution (*P < 0.05) are indicated. B: P-CREB binding to G6pc or Pck1 promoter was analyzed by ChIP assay from the kidneys and intestine, 30 min after the injection of saline solution or glucagon in WT mice.
FIG. 7.
FIG. 7.
Renal gluconeogenesis of L-G6pc−/− mice is regulated by acidosis. A: Follow-up of urinary pH of L-G6pc−/− mice (black bars), L-G6pc−/− mice treated with 0.28 mol/L NaHCO3 in drinking water (gray bars), and WT (L-G6pc+/+ mice, white bars) on the fed or postabsorptive state. Values of pH were determined using strips with ΔpH = 0.2. B and C: Expression levels of mRNA encoding G6pc or Pck1 gene in the kidneys (B) or in the intestine (C) of 6 h–fasted mice. Results are expressed as a ratio relative to Rpl19 expression levels. DG: Western blot quantification and enzyme activity assays of G6Pase and PEPCK determined in the kidneys (D and F) or in the intestine of 6 h–fasted mice (E and G). Data were obtained 5 weeks after gene deletion and are expressed as mean ± SEM. Values significantly different from WT (*P < 0.05; **P < 0.01), from the fed state ($$P < 0.01), and from L-G6pc−/− without NaHCO3 treatment (££P < 0.01).

References

    1. Wahren J, Ekberg K. Splanchnic regulation of glucose production. Annu Rev Nutr 2007;27:329–345 - PubMed
    1. Croset M, Rajas F, Zitoun C, Hurot JM, Montano S, Mithieux G. Rat small intestine is an insulin-sensitive gluconeogenic organ. Diabetes 2001;50:740–746 - PubMed
    1. Ekberg K, Landau BR, Wajngot A, et al. Contributions by kidney and liver to glucose production in the postabsorptive state and after 60 h of fasting. Diabetes 1999;48:292–298 - PubMed
    1. Gerich JE, Meyer C, Woerle HJ, Stumvoll M. Renal gluconeogenesis: its importance in human glucose homeostasis. Diabetes Care 2001;24:382–391 - PubMed
    1. Mithieux G, Bady I, Gautier A, Croset M, Rajas F, Zitoun C. Induction of control genes in intestinal gluconeogenesis is sequential during fasting and maximal in diabetes. Am J Physiol Endocrinol Metab 2004;286:E370–E375 - PubMed

Publication types

MeSH terms