. 2012 Jan;86(1):143-55.
doi: 10.1128/JVI.05694-11. Epub 2011 Oct 19.

Adeno-associated virus type 2 modulates the host DNA damage response induced by herpes simplex virus 1 during coinfection

Affiliations

Adeno-associated virus type 2 modulates the host DNA damage response induced by herpes simplex virus 1 during coinfection

Rebecca Vogel et al. J Virol. 2012 Jan.

Abstract

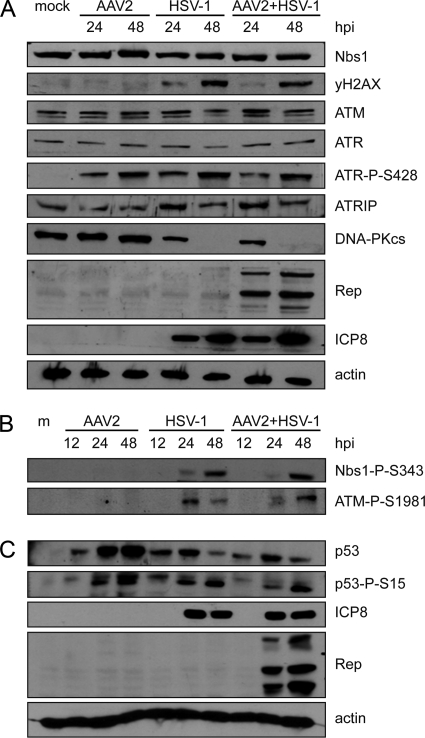
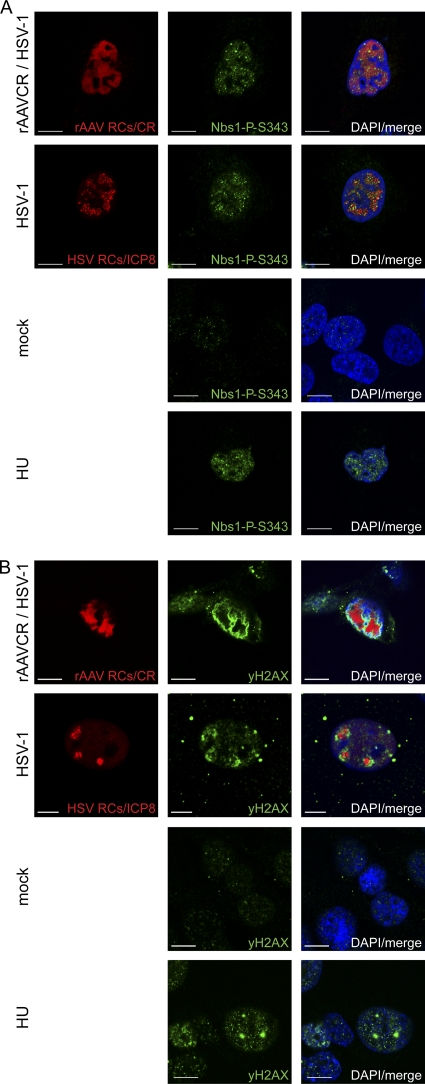
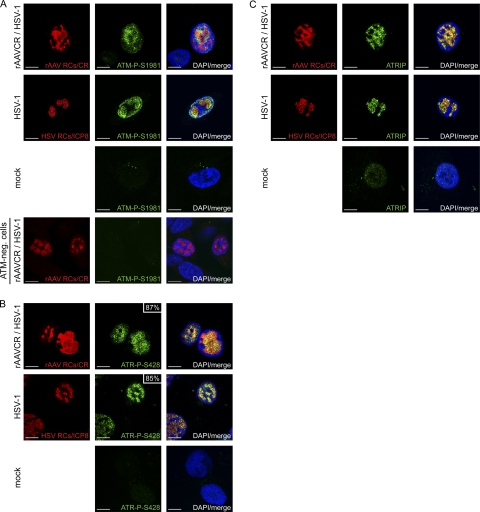
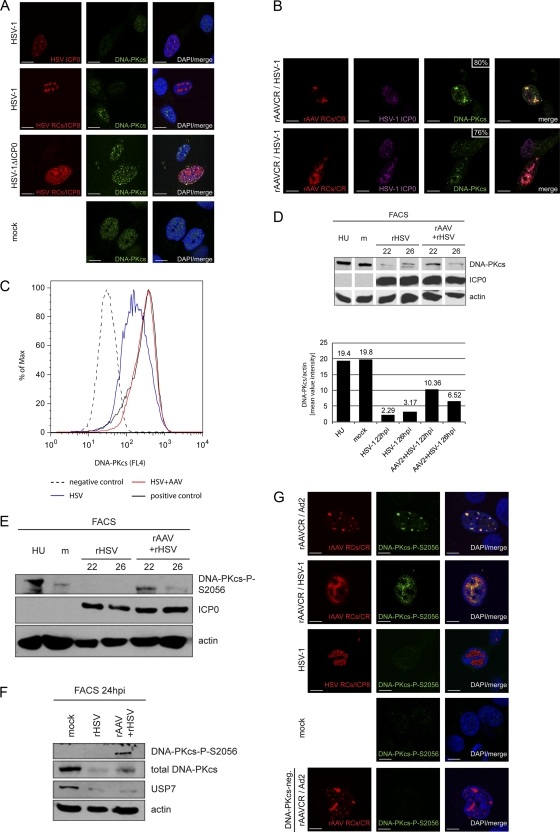
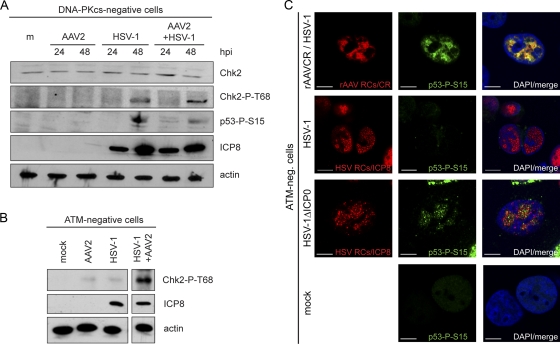
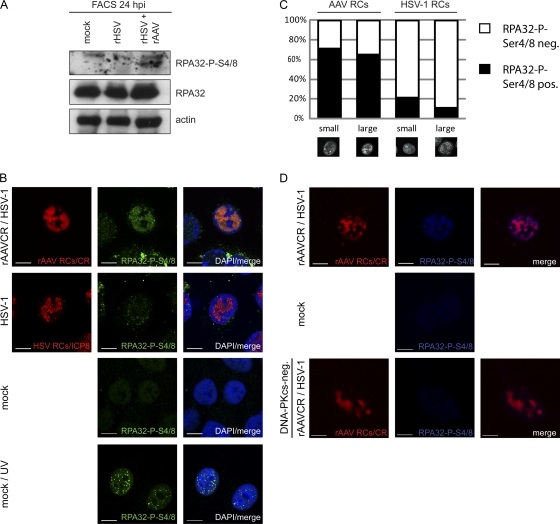
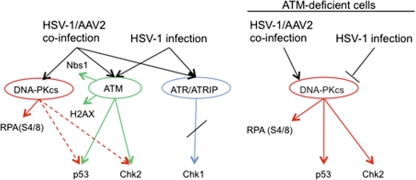
Adeno-associated virus type 2 (AAV2) is a human parvovirus that relies on a helper virus for efficient replication. Herpes simplex virus 1 (HSV-1) supplies helper functions and changes the environment of the cell to promote AAV2 replication. In this study, we examined the accumulation of cellular replication and repair proteins at viral replication compartments (RCs) and the influence of replicating AAV2 on HSV-1-induced DNA damage responses (DDR). We observed that the ATM kinase was activated in cells coinfected with AAV2 and HSV-1. We also found that phosphorylated ATR kinase and its cofactor ATR-interacting protein were recruited into AAV2 RCs, but ATR signaling was not activated. DNA-PKcs, another main kinase in the DDR, was degraded during HSV-1 infection in an ICP0-dependent manner, and this degradation was markedly delayed during AAV2 coinfection. Furthermore, we detected phosphorylation of DNA-PKcs during AAV2 but not HSV-1 replication. The AAV2-mediated delay in DNA-PKcs degradation affected signaling through downstream substrates. Overall, our results demonstrate that coinfection with HSV-1 and AAV2 provokes a cellular DDR which is distinct from that induced by HSV-1 alone.


Figures

Fig 1
Fig 1
DNA damage signaling induced by viral infection. (A to C) WB analysis of infected cell lysates. MO59J Fus1 cells were mock infected (m), infected with AAV2 alone (MOI, 2,000) or HSV-1 alone (MOI, 1.5), or coinfected with AAV2 (MOI, 2,000) and HSV-1 (MOI, 1.5) and harvested at the indicated times postinfection. Total proteins were extracted, separated by SDS-PAGE, blotted onto nitrocellulose membrane, and analyzed with the antibodies indicated. Actin served as a loading control; detection of HSV-1 ICP8 and AAV2 Rep was used as an infection control.
Fig 2
Fig 2
Activation of primary DDR proteins. MO59J Fus1 cells were mock infected, infected with HSV-1 (MOI, 1.5), or coinfected with rAAVCR (MOI, 250) and HSV-1 (MOI, 1.5). After 24 h, cells were fixed and processed for IF analysis. rAAVCR RCs (AAV RCs) were visualized by binding of the rAAVCR-encoded mCherry-Rep68/78 fusion protein (CR) to AAV DNA (red). HSV-1 RCs were visualized with a primary antibody specific for the HSV-1 major DNA binding protein ICP8 and an AF594-labeled secondary antibody (red). Cells treated with HU (3 mM) served as a DDR control. To identify phosphorylated Nbs1 (A) and H2AX (B), cells were stained with antibodies specific for Nbs1-P-S343 or H2AX-P-S139 (γH2AX) and an FITC-labeled secondary antibody (green). DAPI was used to stain cellular DNA. Images were taken using a CLSM and represent a single optical z slice of the nuclei. Scale bars, 10 μm.
Fig 3
Fig 3
Recruitment of ATM-P-S1981, ATR-P-S428, and ATRIP into HSV-1 and AAV2 RCs. MO59J Fus1 cells were infected and processed for IF, and viral RCs (red) were visualized as described in the legend to Fig. 2. Cells were stained with an antibody specific for ATM-P-S1981 (A), ATR-P-S428 (B), or ATRIP (C) and an FITC-labeled secondary antibody (green). DAPI was used to stain cell nuclei. In panel A, cells deficient for ATM (AT-22 IJE T) served as a control for the phosphospecific ATM antibody. In panel B, the percentage of ATR-P-S428 in viral RCs is indicated. Scale bars, 10 μm.
Fig 4
Fig 4
Activation and delayed degradation of DNA-PKcs in cells coinfected with HSV-1 and AAV2. (A) MO59J Fus1 cells were infected with HSV-1 (MOI, 1.5) or HSV-1ΔICP0 (MOI, 0.9) or mock infected. After 24 h, cells were fixed and processed for IF analysis. HSV-1 infection was detected using an antibody specific for ICP0 or ICP8 and an AF594-labeled secondary antibody (red). Additionally, cells were stained with an antibody specific for DNA-PKcs and an FITC-labeled secondary antibody (green). DAPI was used to stain cellular DNA. Scale bars, 10 μm. (B) IF analysis of MO59J Fus1 cells at 24 h after coinfection with rAAVCR (MOI, 250) and HSV-1 (MOI, 1.5). rAAVCR RCs (red) were visualized as described in the legend to Fig. 2. Additionally, cells were stained with antibodies specific for ICP0 or ICP8 and an AF405-labeled secondary antibody (purple) and with an antibody specific for DNA-PKcs and an FITC-labeled secondary antibody (green). The percentage of DNA-PKcs in rAAVCR RCs is indicated. Scale bars, 10 μm. (C) Flow cytometric analysis of infected cells. DNA-PKcs-positive HCT116 cells were mock infected (positive control), infected with rHSV-1ICP4EYFP (MOI, 1.5), or coinfected with HSV-1 (MOI, 1.5), AAV2 (MOI, 250), and rAAVGFP (MOI, 250). HCT116 cells negative for DNA-PKcs served as a negative control. Cells were fixed at 20 h postinfection and stained with a DNA-PKcs-specific monoclonal antibody and a Cy5-labeled secondary antibody. DNA-PKcs was analyzed in HSV-1-infected cells positive for EYFP-ICP4 (HSV) and in coinfected cells positive for EGFP (HSV+AAV). A minimum of 80,000 events were scored for each sample. Graphs were overlaid to show the fluorescence shift of HSV-1-infected populations. (D and E) WB analysis of AT22 IJE-T cells sorted for productive HSV-1 and AAV2 infection at 22 and 26 hpi. Cells were mock infected, infected with rHSV-1vECFP-ICP4 (rHSV; MOI, 2), or coinfected (rHSV + rAAV) with rHSV-1vECFP-ICP4 (MOI, 2) and rAAV2CR (MOI, 4,000). Lysates of sorted cells were processed for WB analysis and stained with the antibodies indicated. Quantification of WB band intensities was done with a Gel Doc system using Quantity One software (version 4.6.1; Bio-Rad, Hercules, CA). (F) WB analysis of AT22 IJE-T cells sorted for productive HSV-1 and AAV2 infection at 24 hpi. Cells were mock infected, infected with rHSV-1vECFP-ICP4 (rHSV; MOI, 4), or coinfected (rHSV + rAAV) with rHSV-1vECFP-ICP4 (MOI, 4) and rAAV2CR (MOI, 4,000). Lysates of sorted cells were processed for WB analysis and stained with the antibodies indicated. (G) MO59J Fus1 cells were mock infected, infected with HSV-1 (MOI, 1.5), or coinfected with rAAVCR (MOI, 250) and either HSV-1 (MOI, 1.5) or Ad2 (MOI, 12.5). After 24 h, cells were fixed and processed for IF analysis. rAAVCR and HSV-1 RCs (red) were visualized as described in the legend to Fig. 2. DNA-PKcs phosphorylation was detected with an antibody specific for DNA-PKcs-P-S2056 and an FITC-labeled secondary antibody (green). As a negative control, MO59J Fus9 DNA-PKcs-negative cells were coinfected with rAAVCR (MOI, 250) and Ad2 (MOI, 12.5) and stained for pDNA-PKcs. DAPI was used to stain cellular DNA. Scale bars, 10 μm.
Fig 5
Fig 5
DNA-PKcs- and ATM-dependent activation of Chk2 and p53 upon viral infection. (A) WB analysis of DNA-PKcs-deficient MO59J Fus9 cells. Cells were mock infected (m), infected with AAV2 (MOI, 2,000) or HSV-1 (MOI, 1.5), or coinfected with AAV2 (MOI, 2,000) and HSV-1 (MOI, 1.5). Total proteins were extracted at the indicated times postinfection and subjected to WB analysis using antibodies specific for actin (loading control), ICP8 (HSV-1 infection control), Chk2, Chk2-P-T68, and p53-P-S15. (B) Immunoprecipitation and WB analysis of ATM-negative AT22 IJE-T cells at 24 h after mock infection or infection with AAV2 (MOI, 2,000), HSV-1 (MOI, 1.5), AAV2 (MOI, 2,000), and HSV-1 (MOI, 1.5). Lysates were analyzed using the antibodies indicated. (C) IF analysis of ATM-negative AT22 IJE-T cells at 24 h after infection with HSV-1 (MOI, 1.5) and rAAVCR (MOI, 250), HSV-1 (MOI, 1.5), or HSV-1ΔICP0 (MOI, 0.9) or mock infection. rAAVCR and HSV-1 RCs (red) were visualized as described in the legend to Fig. 2. p53 activation was detected with an antibody specific for p53-P-S15 and an FITC-labeled secondary antibody (green). DAPI was used to stain cellular nuclei. Scale bars, 10 μm.
Fig 6
Fig 6
Phosphorylation of RPA32 upon AAV2 and HSV-1 replication. (A) WB analysis of sorted AT22 IJE-T cells at 24 hpi. Cells were mock infected, infected with rHSV-1vECFP-ICP4 (rHSV; MOI, 4), or coinfected (rHSV + rAAV) with rHSV-1vECFP-ICP4 (MOI, 4) and rAAV2CR (MOI, 4,000). Sorted cells were subjected to WB analysis and analyzed with the antibodies indicated. (B) IF analysis of U2OS cells after infection with HSV-1 (MOI, 1.5) or rAAVCR (MOI, 250) and HSV-1 (MOI, 1.5) or mock infection at 24 h. UV-treated cells (10 J/m2) served as a positive control. rAAVCR and HSV-1 RCs (red) were visualized as described in the legend to Fig. 2. To detect phosphorylated RPA32, cells were stained with an antibody specific for RPA32-P-S4/8 and an FITC-labeled secondary antibody (green). Cellular DNA was stained with DAPI. Scale bars, 10 μm. (C) Quantification of RPA32-P-S4/8 colocalization with small and large AAV2 or HSV-1 RCs in U2OS cells. Fifty cells per sample were counted. Black columns, RPA32-P-S4/8-positive viral RCs; open columns, RPA32-P-S4/8 negative viral RCs. (D) IF analysis of MO59J Fus1 or Fus9 (DNA-PKcs-negative) cells at 24 h after mock infection or coinfection with HSV-1 (MOI, 1.5) and rAAVCR (MOI, 250). rAAVCR RCs (red) were visualized as described in the legend to Fig. 2. Cells were stained with an antibody specific for RPA32-P-S4/8 and an AF405-labeled secondary antibody (blue). Scale bars, 10 μm.
Fig 7
Fig 7
Models of the DDR signaling induced by HSV-1 replication and HSV-1-supported AAV replication. The analysis of the DDRs in ATM-deficient, DNA-PKcs-deficient, and normal cells supports the following models. Infection of cells with HSV-1 induces phosphorylation of ATM and ATR and signaling to their targets Nbs1, H2AX, Chk2, and p53 but not to the ATR target Chk1. In cells infected with HSV-1 alone, DNA-PKcs is rapidly degraded in an HSV-1 ICP0-dependent manner and no DNA-PKcs-mediated signaling occurs. In contrast, coinfection with HSV-1 and AAV2 induces the activation of DNA-PKcs, which enables the phosphorylation of RPA32 at S4/8. Further support for the activation of DNA-PKcs in coinfected cells comes from experiments performed with ATM-deficient cells, as in the absence of ATM, HSV-1 and AAV2 coinfection still induced the phosphorylation of p53, Chk2, and RPA32 at S4/8. In ATM-deficient cells infected with HSV-1 alone, the DDR signaling is broadly reduced, with undetectable levels of Chk2-P-T86 and p53-P-S15 (51, 76).

Similar articles

Cited by

References

    1. Adeyemi RO, Landry S, Davis ME, Weitzman MD, Pintel DJ. 2010. Parvovirus minute virus of mice induces a DNA damage response that facilitates viral replication. PLoS Pathog. 6:e1001141. - PMC - PubMed
    1. Ahn JY, Schwarz JK, Piwnica-Worms H, Canman CE. 2000. Threonine 68 phosphorylation by ataxia telangiectasia mutated is required for efficient activation of Chk2 in response to ionizing radiation. Cancer Res. 60:5934–5936 - PubMed
    1. Alazard-Dany N, et al. 2009. Definition of herpes simplex virus type 1 helper activities for adeno-associated virus early replication events. PLoS Pathog. 5:e1000340. - PMC - PubMed
    1. Anantha RW, Vassin VM, Borowiec JA. 2007. Sequential and synergistic modification of human RPA stimulates chromosomal DNA repair. J. Biol. Chem. 282:35910–35923 - PubMed
    1. Antoni BA, et al. 1991. Adeno-associated virus Rep protein inhibits human immunodeficiency virus type 1 production in human cells. J. Virol. 65:396–404 - PMC - PubMed

Publication types

MeSH terms