. 2011 Nov 15;187(10):4987-97.
doi: 10.4049/jimmunol.1102173. Epub 2011 Oct 17.

The plasticity of regulatory T cell function

Affiliations

The plasticity of regulatory T cell function

Meenu R Pillai et al. J Immunol. .

Abstract

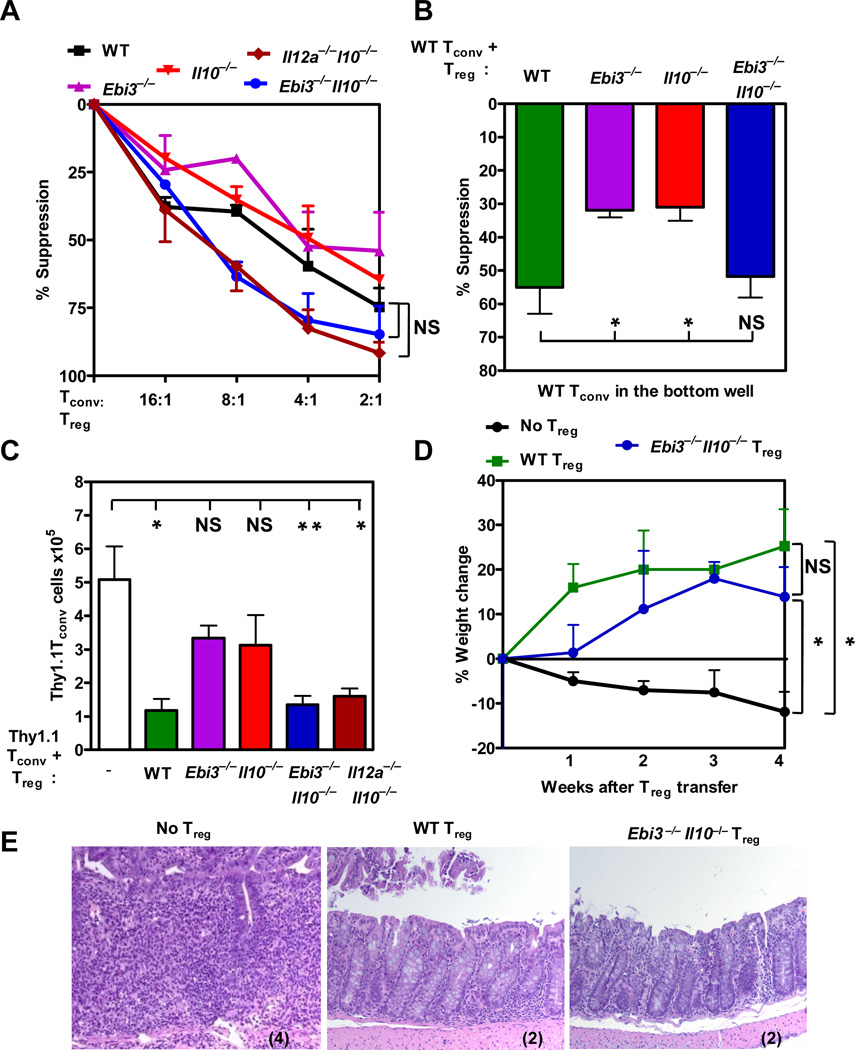
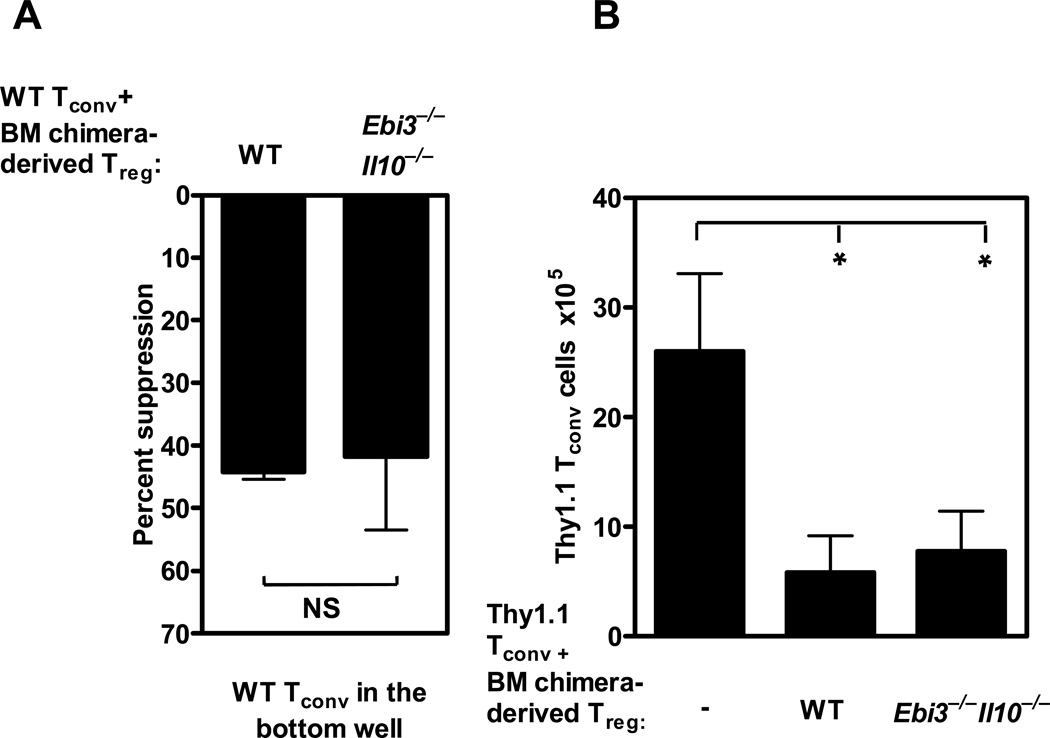
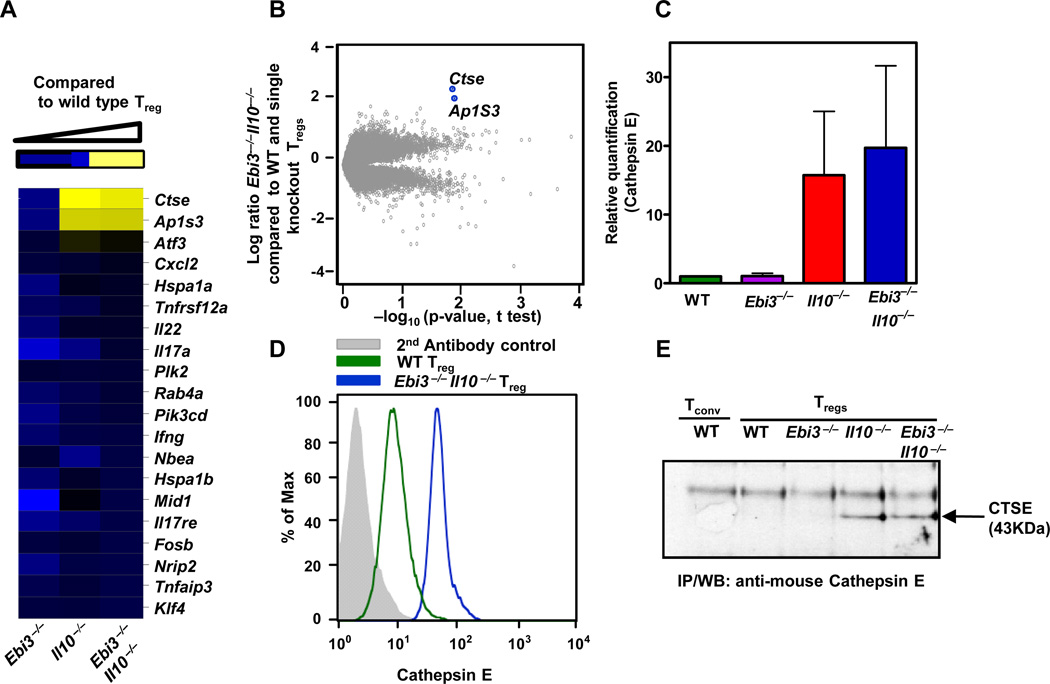
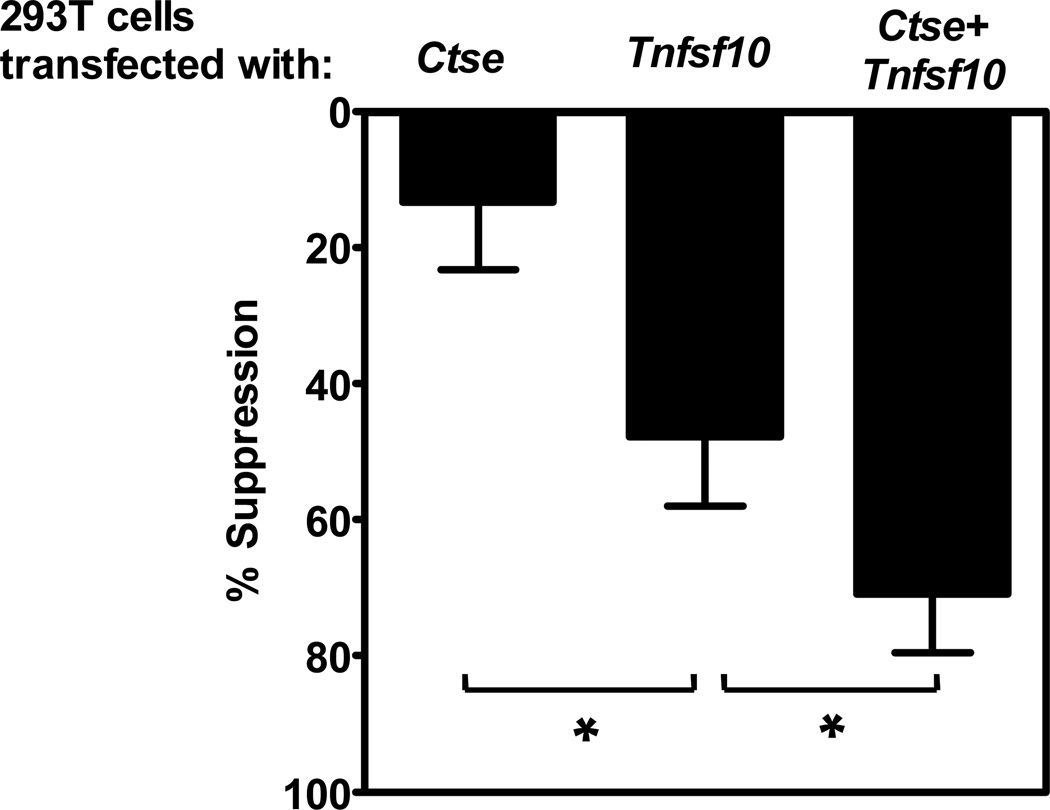
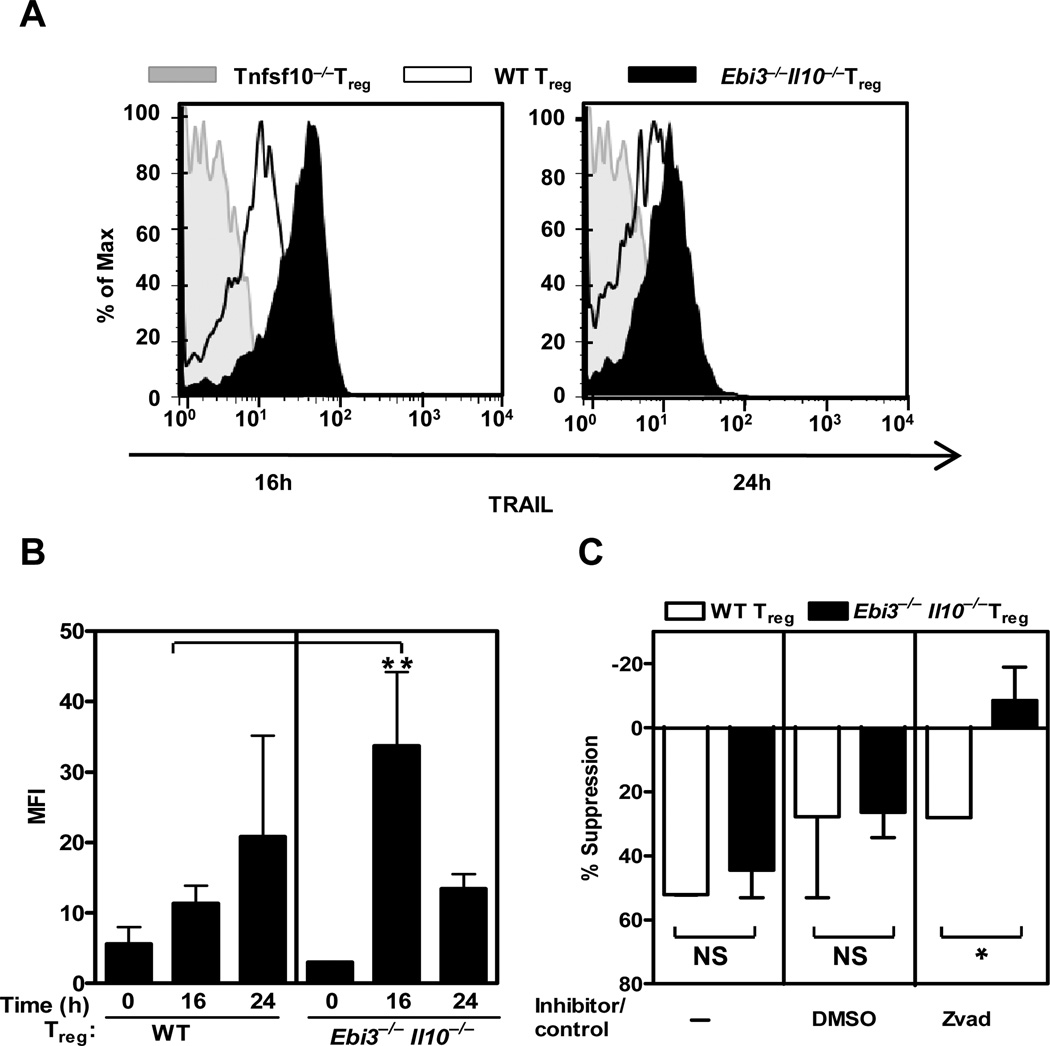
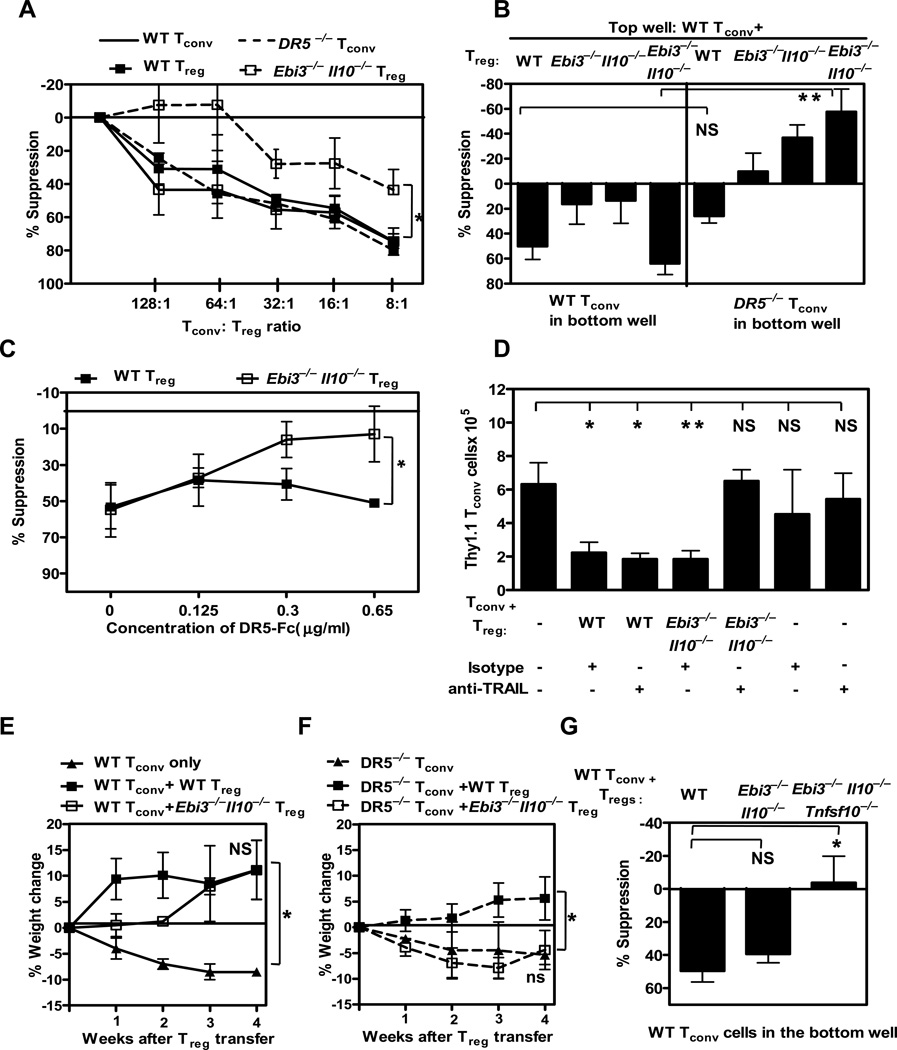
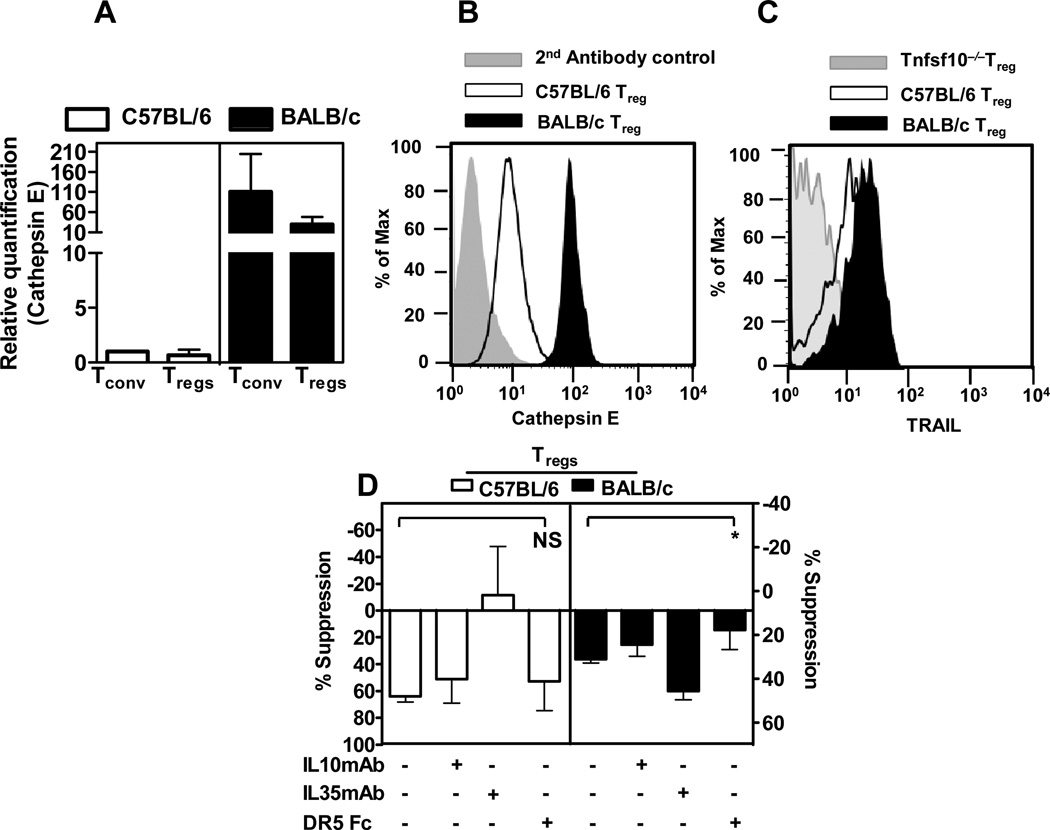
Regulatory T cells (T(regs)) can suppress a wide variety of cell types, in diverse organ sites and inflammatory conditions. Whereas T(regs) possess multiple suppressive mechanisms, the number required for maximal function is unclear. Furthermore, whether any interrelationship or cross-regulatory mechanisms exist to orchestrate and control their utilization is unknown. In this study, we assessed the functional capacity of T(regs) lacking the ability to secrete both IL-10 and IL-35, which individually are required for maximal T(reg) activity. Surprisingly, IL-10/IL-35 double-deficient T(regs) were fully functional in vitro and in vivo. Loss of IL-10 and IL-35 was compensated for by a concurrent increase in cathepsin E (Ctse) expression, enhanced TRAIL (Tnfsf10) expression, and soluble TRAIL release, rendering IL-10/IL-35 double-deficient T(regs) functionally dependent on TRAIL in vitro and in vivo. Lastly, whereas C57BL/6 T(regs) are normally IL-10/IL-35 dependent, BALB/c T(regs), which express high levels of cathepsin E and enhanced TRAIL expression, are partially TRAIL dependent by default. These data reveal that cross-regulatory pathways exist that control the utilization of suppressive mechanisms, thereby providing T(reg) functional plasticity.


Figures

Figure 1
Figure 1. Ebi3−/−Il10−/− Tregs are suppressive in vitro and in vivo
(A) Wild type or knock out Treg purified by FACS were titrated in a standard Treg assay with Tconv cells and anti-CD3 and anti-CD28 coated latex beads. Proliferation of Tconv responder cells was determined by [3H]-thymidine incorporation (p-value: wild type Tregs compared to Ebi3−/−Il10−/−, and Il12a−/−Il10−/− Tregs, Not significant (NS)). (B) Wild type or knock out Treg were cultured with anti-CD3 and anti-CD28 coated latex beads and Tconv cells in the inserts of a Transwell™ culture plate. Third party, wild type responder Tconv was activated in the bottom chamber of the plate. Proliferation of responder cells was determined by [3H]-thymidine incorporation. Proliferation ranged from 30,000–60,000 cpm. p-value: *: <0.05, NS: Not significant. (C) Congenically marked wild type Tconv cells, wild type or knock out Tregs purified by FACS were injected at 4:1 ratio into Rag1−/− mice. CD4+ cell numbers in the spleen were analyzed after 7 days by flow cytometry. p-value: * <0.05. (D) Wild type Tconv cells (0.5×10⁶) were injected into Rag1−/− mice. The weight of the mice was monitored weekly for weight loss. Once the mice had lost 5% of its body weight wild type or knock out Tregs were injected. Mice were monitored for percent weight change calculated based on the weight at the time of Treg injection. p-value: * <0.05 and NS: Not significant. (E) Colonic tissue sections stained with H & E stain were scored in a blinded manner. Representative images of sections from 3 independent experiments are shown with histological score in parentheses. Data represent the mean ± SEM of (A) 3, (B) 3–5, (C) 4–9 mice per group, (D&E) 3 independent experiments.
Figure 2
Figure 2. Ebi3−/−Il10−/− Tregs that developed in a mixed bone marrow chimera can function in vitro and in vivo
Congenically labeled wild type bone marrow and knock out bone marrow was mixed at a 1:1 ratio and injected into sub lethally irradiated Rag1−/− mice. (A) After 8 weeks Thy.1.2+ wild type Treg cells or knock out Treg cells were purified by FACS from the bone marrow chimeric mice and cultured in the inserts of a Transwell™ plate in the presence of wild type Tconv cells and anti-CD3 and anti-CD28 coated latex beads. Wild type naive Tconv cells were activated in the presence of anti-CD3 and anti-CD28 coated beads in the bottom chamber of a Transwell™ for 72 h. Proliferation was determined by [3H]-thymidine incorporation. Data represents the mean± SEM of two independent experiments. (p-value; NS: Not significant). (B) Purified wild type or Ebi3−/−Il10−/− bone marrow chimera-derived Tregs were injected into Rag1−/− mice in the presence of congenically marked naïve Tconv cells. The expansion of naïve Thy1.1 CD4+ T cells were assessed by flow cytometry. Data represents the mean ± SEM of two independent experiments with 3–4 mice per group (p-value *=0.06).
Figure 3
Figure 3. Up-regulation of CTSE by Ebi3−/−Il10−/− Tregs
(A) mRNA was isolated from wild type or knock out Treg purified by FACS and used for Affymetrix analysis. Modulated genes in knock out Treg compared to wild type Tregs is depicted in a heat map. (B) Volcano plot comparing wild type and Ebi3−/− Il10−/−, Tregs. Highest modulated genes are marked. (C) mRNA was isolated from wild type or knock out Treg purified by FACS, cDNA synthesized and Ctse expression assessed by qPCR. Data are the mean of 2 independent experiments. (D) Wild type or knock out Treg were stained for intracellular CTSE [grey - 2nd antibody control, open histograms; in green - wild type Tregs and in blue; Ebi3−/− Il10−/− Tregs]. (E) Equal numbers of FACS purified wild type or knock out Treg were lysed, CTSE immunoprecipitated and analysed by SDS-PAGE/western blot. Data are representative (A, B, D and E) of three independent experiments.
Figure 4
Figure 4. Cathepsin E enhances the suppression of Tconv cells by TRAIL
293T cells were transfected either with Ctse and Tnfsf10 alone or together. The cells were irradiated with 3000 rads 48h post transfection and seeded at a density of 7000 cells per well in a 96 well flat bottom plate. Freshly isolated C57BL/6 Tconv cells were added to the seeded plate at 8×10⁴ per well and stimulated with anti-CD3 and anti-CD28 coated beads for 72 hours. Proliferation of responder cells was determined by [3H]-thymidine incorporation. Tconv cell proliferation was calculated by subtracting the basal [3H]-thymidine incorporation of irradiated 293T plus T cells without anti-CD3 and anti-CD28 stimulation. Data represent the average of three independent experiments. p-value, * : <0.05.
Figure 5
Figure 5. TRAIL dependence and modulation in Ebi3−/− Il10−/−Tregs
Wild type or knock out Treg purified by FACS were activated in presence of anti-CD3 and anti-CD28 coated latex beads with IL2 for 16 and 24h. (A) Cells were collected and surface TRAIL expression detected by flow cytometry using an anti-mouse TRAIL antibody. Data are representative of 3 independent experiments. (B) Mean fluorescence intensity (MFI) of surface TRAIL expression following activation from 3–4 independent experiments were plotted. Students t Test; p-value ** = <0.05. (C) Wild type or knock out Treg were cultured in the insert of a Transwell™ culture plate in the presence of wild type Tconv cells. zVAD or DMSO control was added to the Transwell™ assay. Freshly purified wild type responder Tconv cells were activated in the bottom chamber of the plate. Proliferation of responder cells was determined by [3H]-thymidine incorporation. Data represent the mean ± SEM of 2 independent experiments. p-value * = 0.07.
Figure 6
Figure 6. Ebi3−/−Il10−/− Treg mediated suppression is TRAIL-dependent
Wild type or knock out Tregs purified by FACS (A) were titrated in a Treg assay with wild type or DR5−/− Tconv cells and stimulated with anti-CD3 and anti-CD28 coated latex beads or (B) were cultured with wild type Tconv cells in the insert of a Transwell™ culture plate. Wild type or DR5−/− Tconv cells were activated in the bottom chamber of the plate with anti-CD3 and anti-CD28 coated latex beads. Proliferation of responder wild type or DR5−/− Tconv cells was determined by [3H]-thymidine incorporation. CPM ranged between 30,000–65,000. Results shown here are average of 4–5 independent experiments. (C) Wild type and Ebi3−/−Il10−/− Tregs were stimulated with anti-CD3 and anti-CD28 coated latex beads in the presence of Tconv cells in the insert of a Transwell™ culture plate. Freshly purified wild type responder Tconv cells were activated in the bottom wells in the presence of a titrated amount of DR5-Fc. Data is average of 2–3 independent experiments, One way ANCOVA p-value *= 0.01 (D) Congenically marked wild type Tconv cells and wild type or knock out Tregs were injected at 4:1 ratio in to Rag−/− mice. On days 1 and 3 TRAIL neutralizing mAb or isotype control were injected by i.p. CD4, Thy1.1 and Thy 1.2 T cell numbers in the spleen were analyzed after 7 days by flow cytometry. Data includes 3–6 mice per group from 3 independent experiments. (E) Wild type littermate control Tconv cells or (F) DR5−/− Tconv cells (0.5 × 10⁶ cells) were injected into Rag1−/− mice. The weight of the mice was monitored weekly for weight loss. Percent weight change was calculated based on the weight at the time of Treg injection. (G) Wild type or knock out Tregs purified by FACS were cultured with wild type Tconv cells in the insert of a Transwell™ culture plate. Wild type Tconv cells were activated in the bottom chamber of the plate with anti-CD3 and anti-CD28-coated latex beads. Proliferation of responder Tconv cells was determined by [3H]-thymidine incorporation. CPM ranged between 30,000–70,000. Results shown here are mean ± SEM of 3 independent experiments. p-value - A–G; *: < 0.05, ** < 0.005, NS: Not significant.
Figure 7
Figure 7. BALB/c Treg preferentially use TRAIL-mediated pathways compared to C57BL/6 Tregs
(A) mRNA was isolated from freshly purified C57BL/6 or BALB/c Tconv cells and Tregs, cDNA synthesized and qPCR performed to assess Ctse expression. (B) Intracellular staining for CTSE was performed with purified C57BL/6 or BALB/c Treg [Grey filled - secondary antibody only control; open histogram - C57BL/6 Tregs and closed histogram BALB/c Tregs]. (C) TRAIL staining was performed with Tnfsf10−/−, wild type C57BL/6 or BALB/c Tregs, activated in presence of anti-CD3 and anti-CD28 coated latex beads with IL2 for 16h and surface TRAIL expression was detected by flow cytometry using a anti-mouse TRAIL antibody (MFI from three independent experiments, p-value:0.07). (D) Wild type C57BL/6 or BALB/c Tregs were mixed at 1:2 ratio with naïve wild type Tconv cells in the presence of anti-CD3 and anti-CD28 coated beads in the insert of a Transwell™ culture plate for 72h. Neutralizing antibodies against IL-10, IL-35 or a DR5-Fc protein were added to the Transwell™ assay at pre-determined concentrations as described in the methods. Freshly purified wild type responder Tconv were activated in the bottom chamber of a Transwell™ culture plate. Proliferation of the responder cells was determined by [3H]-thymidine incorporation. p-value *: < 0.05. Data represent 3–4 independent experiments.

Similar articles

Cited by

References

    1. Sakaguchi S, Sakaguchi N, Shimizu J, Yamazaki S, Sakihama T, Itoh M, Kuniyasu Y, Nomura T, Toda M, Takahashi T. Immunologic tolerance maintained by CD25+ CD4+ regulatory T cells: their common role in controlling autoimmunity, tumor immunity, and transplantation tolerance. Immunol Rev. 2001;182:18–32. - PubMed
    1. Vignali DA, Collison LW, Workman CJ. How regulatory T cells work. Nat Rev Immunol. 2008;8:523–532. - PMC - PubMed
    1. Tang Q, Bluestone JA. The Foxp3+ regulatory T cell: a jack of all trades, master of regulation. Nat Immunol. 2008;9:239–244. - PMC - PubMed
    1. Thornton AM, Shevach EM. CD4+CD25+ immunoregulatory T cells suppress polyclonal T cell activation in vitro by inhibiting interleukin 2 production. J Exp Med. 1998;188:287–296. - PMC - PubMed
    1. Park Y, Oh SJ, Chung DH. CD4(+)CD25(+) regulatory T cells attenuate Hypersensitivity Pneumonitis by suppressing IFN-gamma production by CD4(+) and CD8(+) T cells. J Leukoc Biol. 2009;86:1427–1437. - PubMed

Publication types

MeSH terms

Associated data