

Activation of Wnt signaling arrests effector differentiation in human peripheral and cord blood-derived T lymphocytes
- PMID: 22013128
- PMCID: PMC3208052
- DOI: 10.4049/jimmunol.1101585
Activation of Wnt signaling arrests effector differentiation in human peripheral and cord blood-derived T lymphocytes
Abstract
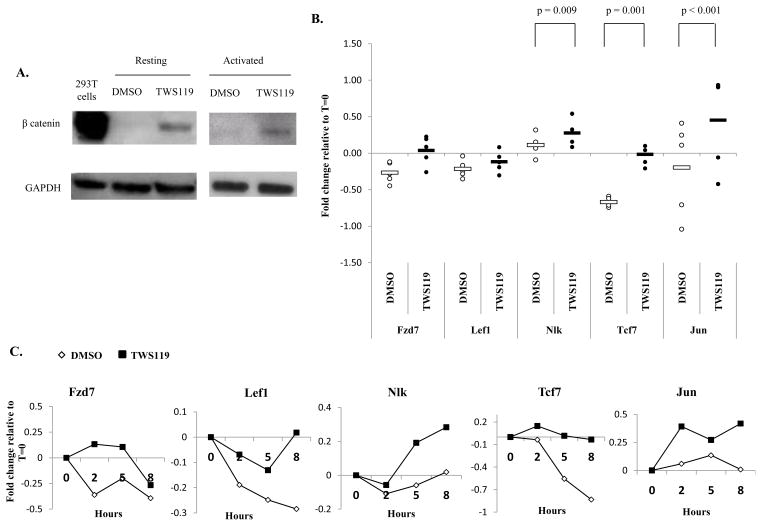
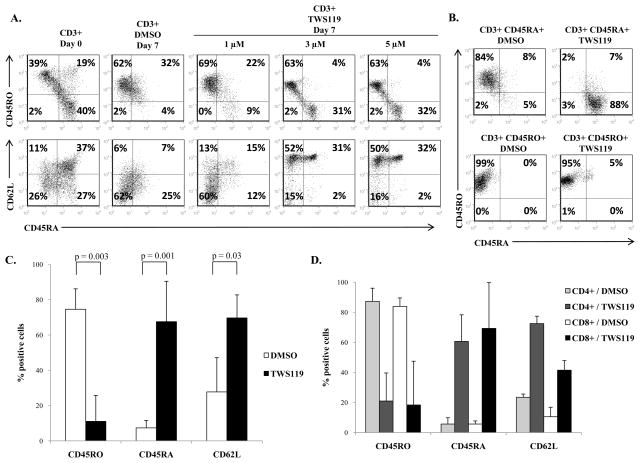
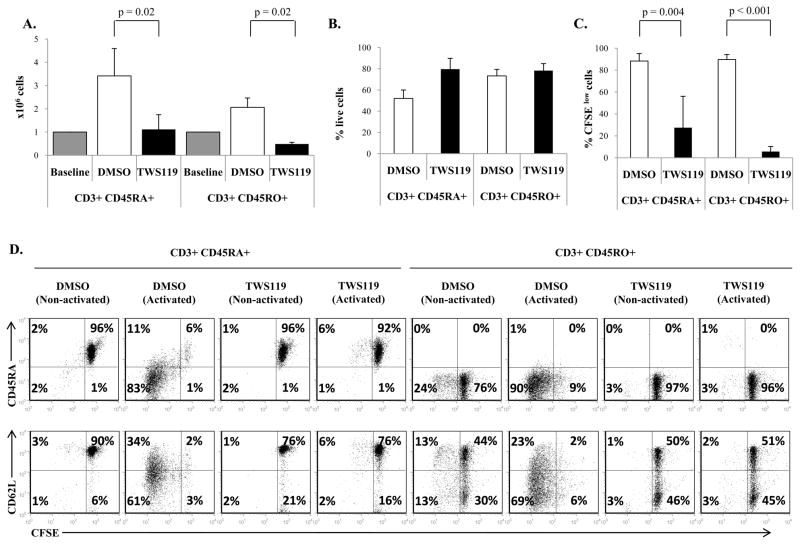
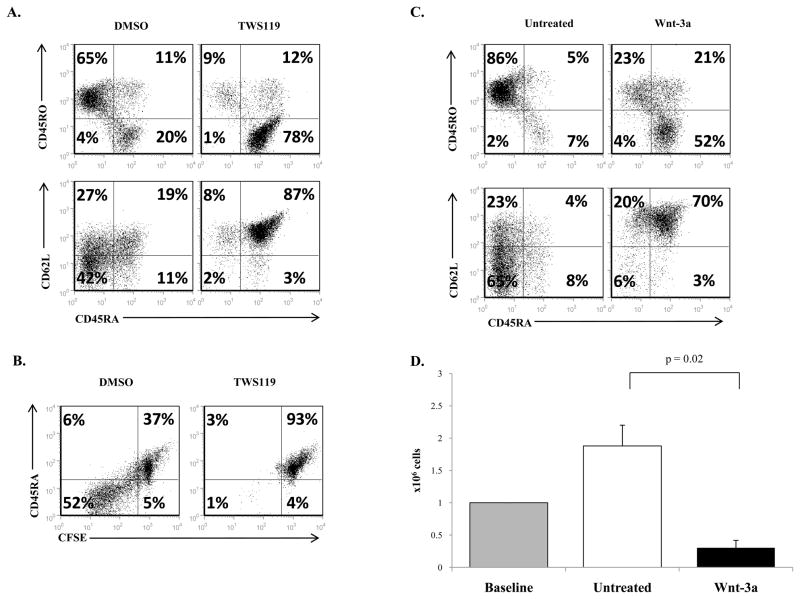
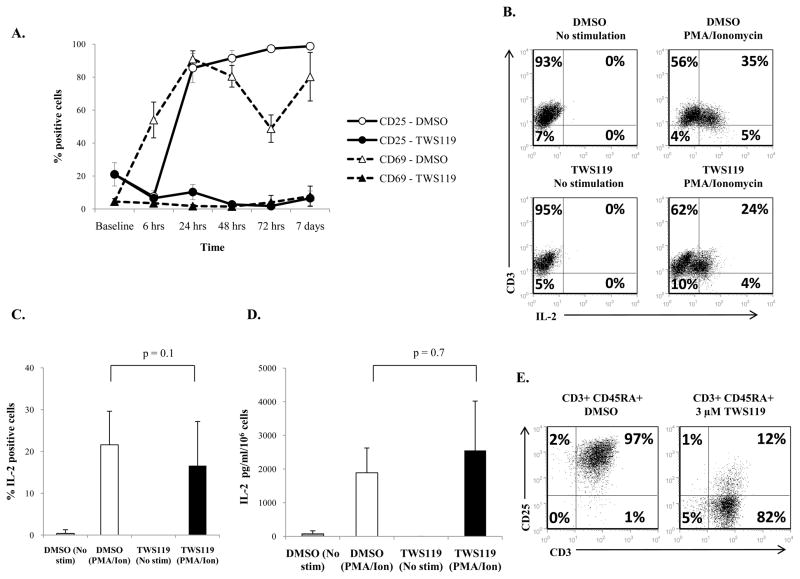
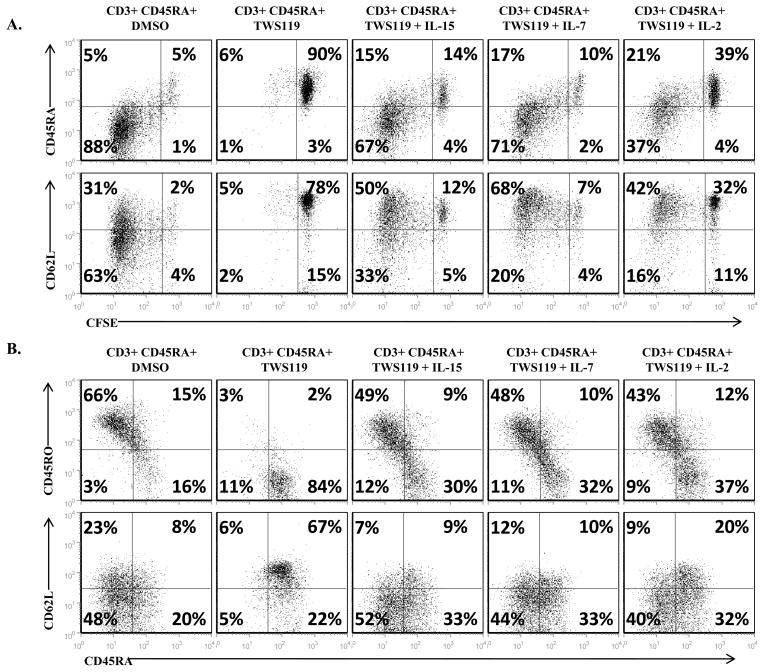
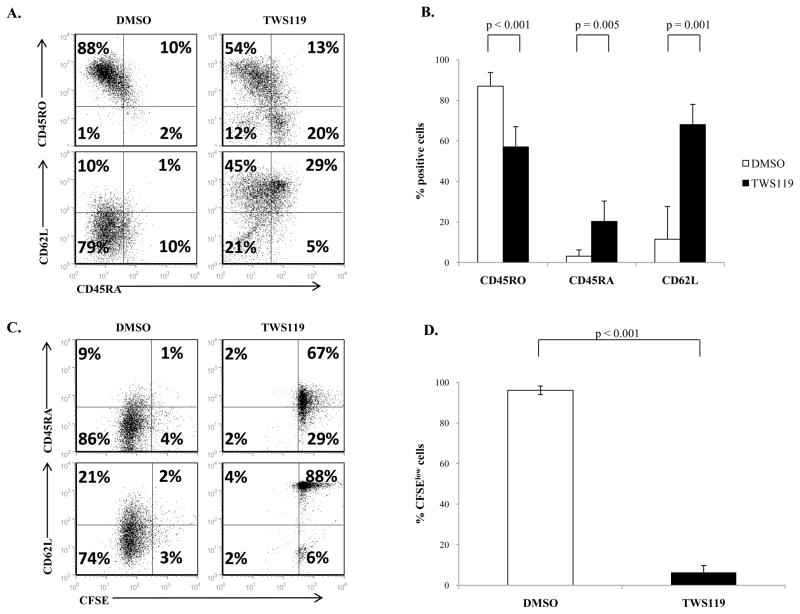
The canonical Wnt/β-catenin signaling pathway plays an important role in thymocyte development and T cell migration, but little is known about its role in naive-to-effector differentiation in human peripheral T cells. We show that activation of Wnt/β-catenin signaling arrests human peripheral blood and cord blood T lymphocytes in the naive stage and blocks their transition into functional T effector cells. Wnt signaling was induced in polyclonally activated human T cells by treatment either with the glycogen synthase kinase 3β inhibitor TWS119 or the physiological Wnt agonist Wnt-3a, and these T cells preserved a naive CD45RA(+)CD62L(+) phenotype compared with control-activated T cells that progressed to a CD45RO(+)CD62L(-) effector phenotype, and this occurred in a TWS119 dose-dependent manner. TWS119-induced Wnt signaling reduced T cell expansion, as a result of a block in cell division, and impaired acquisition of T cell effector function, measured by degranulation and IFN-γ production in response to T cell activation. The block in T cell division may be attributed to the reduced IL-2Rα expression in TWS119-treated T cells that lowers their capacity to use autocrine IL-2 for expansion. Collectively, our data suggest that Wnt/β-catenin signaling is a negative regulator of naive-to-effector T cell differentiation in human T lymphocytes. The arrest in T cell differentiation induced by Wnt signaling might have relevant clinical applications such as to preserve the naive T cell compartment in Ag-specific T cells generated ex vivo for adoptive T cell immunotherapy.
Conflict of interest statement
The authors have no competing financial interest.
Figures

Similar articles
-
Effects of Glycogen Synthase Kinase-3β Inhibitor TWS119 on Proliferation and Cytokine Production of TILs From Human Lung Cancer.J Immunother. 2018 Sep;41(7):319-328. doi: 10.1097/CJI.0000000000000234. J Immunother. 2018. PMID: 29877972 Free PMC article.
-
[Activation of Wnt/β-catenin pathway in NK cells by glycogen synthase kinase-3β inhibitor TWS119 promotes the expression of CD62L].Xi Bao Yu Fen Zi Mian Yi Xue Za Zhi. 2015 Jan;31(1):44-8. Xi Bao Yu Fen Zi Mian Yi Xue Za Zhi. 2015. PMID: 25575058 Chinese.
-
Stimulation of Wnt/ß-catenin pathway in human CD8+ T lymphocytes from blood and lung tumors leads to a shared young/memory phenotype.PLoS One. 2012;7(7):e41074. doi: 10.1371/journal.pone.0041074. Epub 2012 Jul 30. PLoS One. 2012. PMID: 22859966 Free PMC article.
-
Wnt/beta-catenin signaling in T-cell immunity and cancer immunotherapy.Clin Cancer Res. 2010 Oct 1;16(19):4695-701. doi: 10.1158/1078-0432.CCR-10-0356. Epub 2010 Aug 5. Clin Cancer Res. 2010. PMID: 20688898 Free PMC article. Review.
-
WNT signalling in the immune system: WNT is spreading its wings.Nat Rev Immunol. 2008 Aug;8(8):581-93. doi: 10.1038/nri2360. Nat Rev Immunol. 2008. PMID: 18617885 Review.
Cited by
-
Stem-like T cells and niches: Implications in human health and disease.Front Immunol. 2022 Aug 17;13:907172. doi: 10.3389/fimmu.2022.907172. eCollection 2022. Front Immunol. 2022. PMID: 36059484 Free PMC article. Review.
-
Runx3-overexpression cooperates with ex vivo AKT inhibition to generate receptor-engineered T cells with better persistence, tumor-residency, and antitumor ability.J Immunother Cancer. 2023 Feb;11(2):e006119. doi: 10.1136/jitc-2022-006119. J Immunother Cancer. 2023. PMID: 36849200 Free PMC article.
-
Wnt activation promotes memory T cell polyfunctionality via epigenetic regulator PRMT1.J Clin Invest. 2022 Jan 18;132(2):e140508. doi: 10.1172/JCI140508. J Clin Invest. 2022. PMID: 35040433 Free PMC article.
-
RNA Therapeutics for Improving CAR T-cell Safety and Efficacy.Cancer Res. 2023 Feb 3;83(3):354-362. doi: 10.1158/0008-5472.CAN-22-2155. Cancer Res. 2023. PMID: 36512627 Free PMC article. Review.
-
Nuclear translocation of MEK1 triggers a complex T cell response through the corepressor silencing mediator of retinoid and thyroid hormone receptor.J Immunol. 2013 Jan 1;190(1):159-67. doi: 10.4049/jimmunol.1201657. Epub 2012 Dec 5. J Immunol. 2013. PMID: 23225884 Free PMC article.
References
-
- Mulroy T, McMahon JA, Burakoff SJ, McMahon AP, Sen J. Wnt-1 and Wnt-4 regulate thymic cellularity. Eur J Immunol. 2002;32:967–971. - PubMed
-
- Okamura RM, Sigvardsson M, Galceran J, Verbeek S, Clevers H, Grosschedl R. Redundant regulation of T cell differentiation and TCRalpha gene expression by the transcription factors LEF-1 and TCF-1. Immunity. 1998;8:11–20. - PubMed
-
- Staal FJ, Meeldijk J, Moerer P, Jay P, van de Weerdt BC, Vainio S, Nolan GP, Clevers H. Wnt signaling is required for thymocyte development and activates Tcf-1 mediated transcription. Eur J Immunol. 2001;31:285–293. - PubMed
-
- Willinger T, Freeman T, Herbert M, Hasegawa H, McMichael AJ, Callan MF. Human naive CD8 T cells down-regulate expression of the WNT pathway transcription factors lymphoid enhancer binding factor 1 and transcription factor 7 (T cell factor-1) following antigen encounter in vitro and in vivo. J Immunol. 2006;176:1439–1446. - PubMed
Publication types
MeSH terms
Substances
Grants and funding
LinkOut - more resources
Full Text Sources
Other Literature Sources
