Review
. 2012 Feb;40(4):1395-406.
doi: 10.1093/nar/gkr778. Epub 2011 Oct 19.

Validation of kinetics similarity in qPCR

Affiliations
Review

Validation of kinetics similarity in qPCR

Tzachi Bar et al. Nucleic Acids Res. 2012 Feb.

Abstract

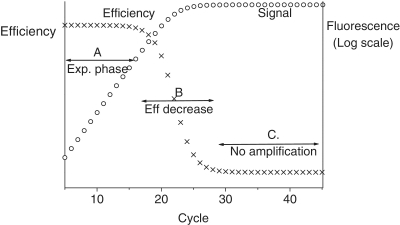
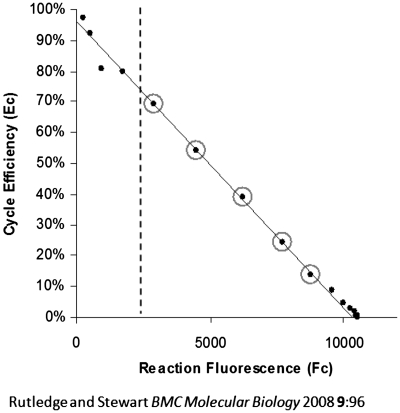
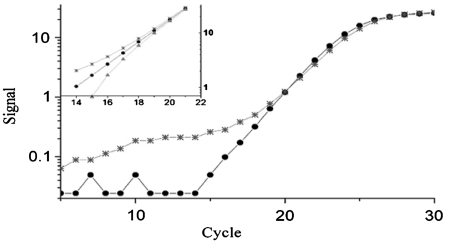
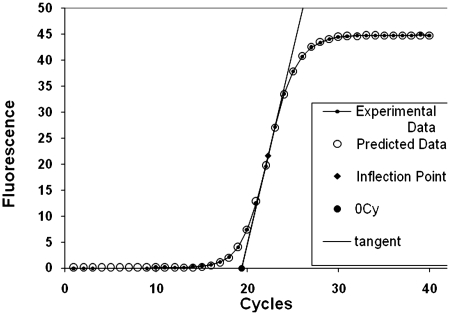
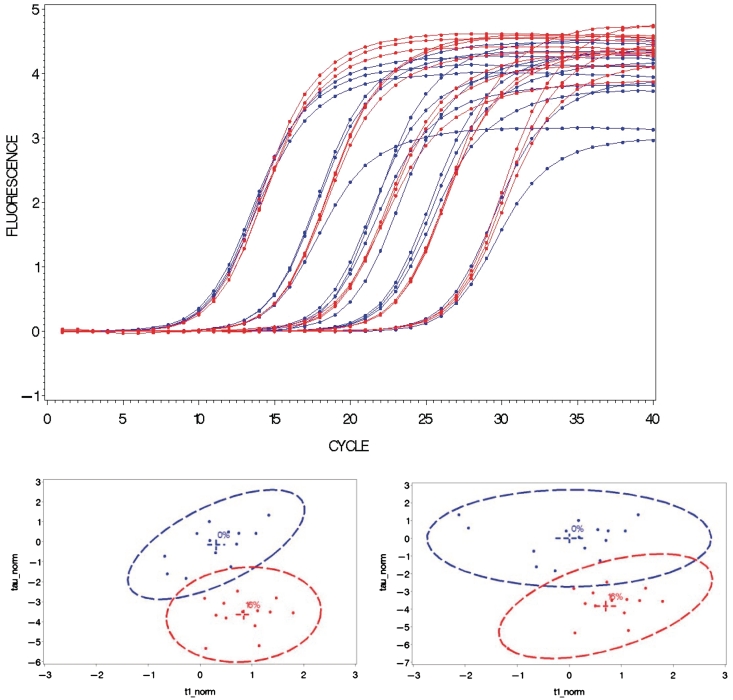
Quantitative real-time PCR (qPCR) is the method of choice for specific and sensitive quantification of nucleic acids. However, data validation is still a major issue, partially due to the complex effect of PCR inhibition on the results. If undetected PCR inhibition may severely impair the accuracy and sensitivity of results. PCR inhibition is addressed by prevention, detection and correction of PCR results. Recently, a new family of computational methods for the detection of PCR inhibition called kinetics outlier detection (KOD) emerged. KOD methods are based on comparison of one or a few kinetic parameters describing a test reaction to those describing a set of reference reactions. Modern KOD can detect PCR inhibition reflected by shift of the amplification curve by merely half a cycle with specificity and sensitivity >90%. Based solely on data analysis, these tools complement measures to improve and control pre-analytics. KOD methods do not require labor and materials, do not affect the reaction accuracy and sensitivity and they can be automated for fast and reliable quantification. This review describes the background of KOD methods, their principles, assumptions, strengths and limitations. Finally, the review provides recommendations how to use KOD and how to evaluate its performance.


Figures

Figure 1.
Figure 1.
Schematic representation of PCR product accumulation (open circle) and PCR efficiency (cross mark) during the reaction. As long as all reagents are in excess and little amount of double-stranded DNA is in the tube, the PCR progresses with seemingly constant high-efficiency, segment A. As reagents are depleted and product is accumulated, the efficiency decreases at increasing rate, segment B (12). When too little reagents are available, or too much double-stranded DNA is in the tube, the efficiency of the reaction gets practically to zero, segment C.
Figure 2.
Figure 2.
PCR kinetics from (11). The efficiency estimated at the lower part of the amplification curve, i.e. the left side of the x axis, is imprecise due to the low signal-to-noise ratio. Circles indicate precise estimation of efficiency. For the same reason, the threshold for quantification is set above the reaction fluorescence level (vertical dashed line), where efficiency already decreased by ∼25%. These data are from SYBR Green reactions, given the lower signal-to-noise ratio of probes the dashed line is expected to be shifted to the right when probe is used.
Figure 3.
Figure 3.
Effect of improper background subtraction on the shape of the amplification curve (49). Data points from a sample with properly modelled and subtracted background (filled circles) fall on what looks like a straight line in the exponential phase of the amplification curve, while under background subtracted (stars) and over background subtracted amplification curves (triangles, inset only) form concave and convex shapes, respectively. This not only affects the results of quantification due to Cq shift at the lower part of the curve, but also directly affects the efficiency estimated from the amplification curve.
Figure 4.
Figure 4.
Example of the Cy0 method (64). Curve fitting of Richards function to amplification data generates values for the kinetic parameters from which the inflection point (solid black rhombus) and the slope of the curve can be derived. The quantitative entity Cy0 (solid black dot) shows the cross point between the x axis and the tangent crossing the inflection point of amplification curve.
Figure 5.
Figure 5.
Upper figure from (63): the blue curves are 15 reference reactions and the red curves are 15 reactions produced from the same DNA stocks as the reference with 2.0 ng tannic acid added per 15 µl reaction mix. Lower figure: two-dimensional 95% confidence region produced by the reference set in the upper figure. Both dimensions are normalized to mean = 0 and SD = 1. Left figure: before outliers’ exclusion from the reference set, right figure, after exclusion, resulting in stronger outlier detection.

Similar articles

Cited by

References

    1. Murphy Ja, Bustin SA. Reliability of real-time reverse-transcription PCR in clinical diagnostics: gold standard or substandard. Expert. Rev. Mol. Diagn. 2009;9:187–197. - PubMed
    1. International Organization for Standardization. (2005) Microbiology of food and animal feeding stuffs. Polymerase Chain Reaction (PCR) for the detection of food-borne pathogens. General method specific requirements (EN ISO 22174:2005). Geneva.
    1. Stolovitzky G, Cecchi GT. Efficiency of DNA replication in the polymerase chain reaction. Proc. Natl Acad. Sci. 1996;93:2947–12952. - PMC - PubMed
    1. Alvarez MJ, Vila-Ortiz GJ, Salibe MC, Podhajcer OL, Pitossi FJV. Model based analysis of real-time PCR data from DNA binding dye protocols. BMC Bioinformatics. 2007;8:85. - PMC - PubMed
    1. Lalam NJ. Modelling the PCR amplification process by a size-dependent branching process. Adv. Appl. Probab. 2004;36:602–615.

Publication types

MeSH terms