. 2012 Jan;40(Database issue):D947-56.
doi: 10.1093/nar/gkr881. Epub 2011 Oct 19.

canSAR: an integrated cancer public translational research and drug discovery resource

Affiliations

canSAR: an integrated cancer public translational research and drug discovery resource

Mark D Halling-Brown et al. Nucleic Acids Res. 2012 Jan.

Abstract

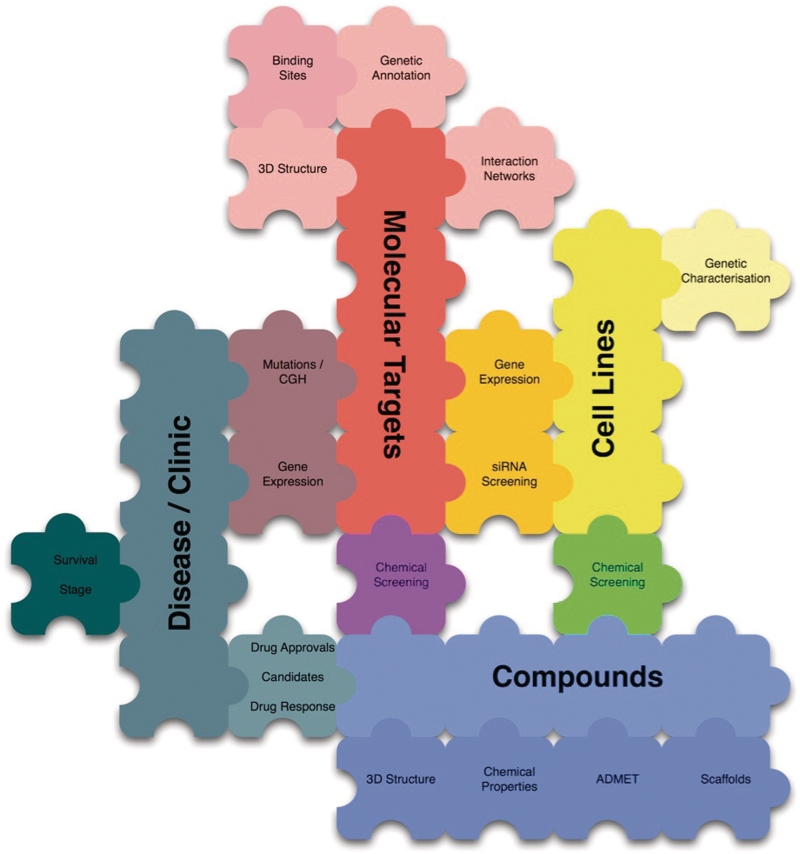
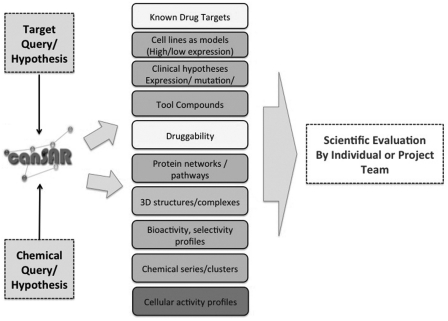
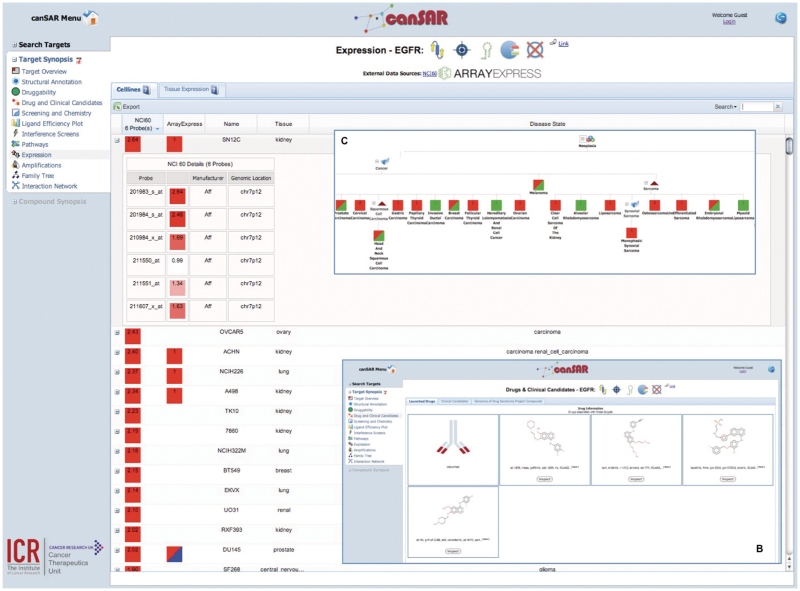
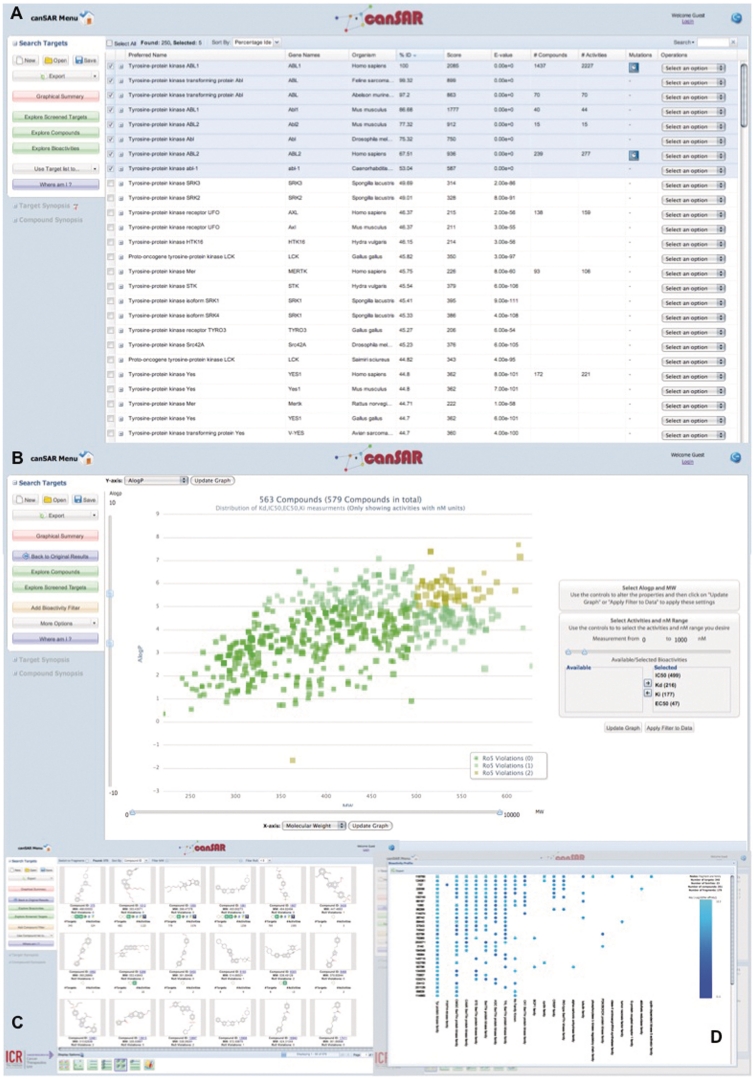
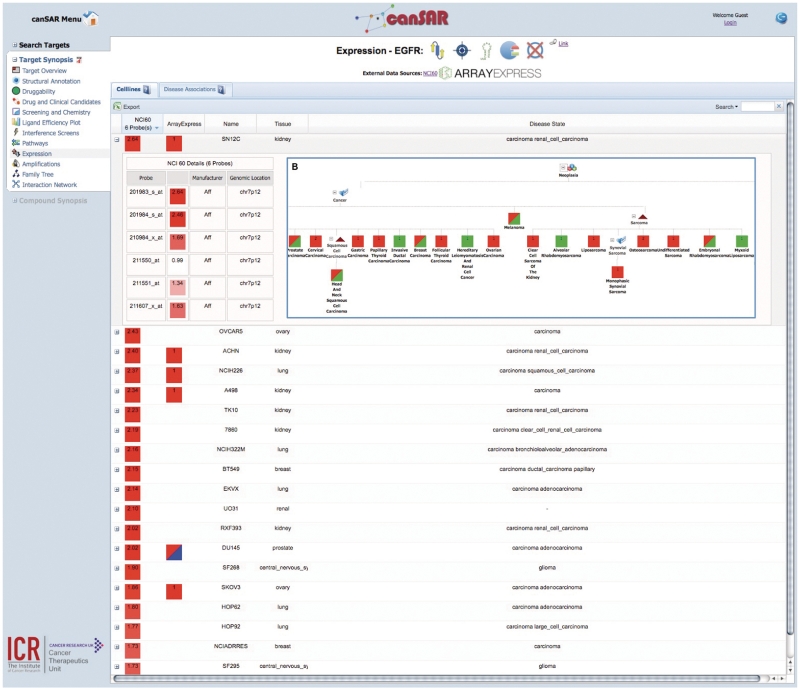
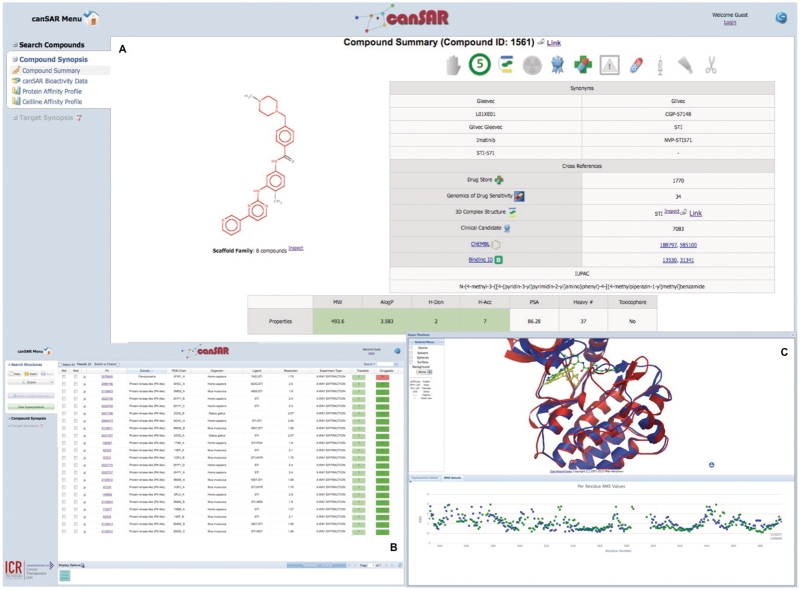
canSAR is a fully integrated cancer research and drug discovery resource developed to utilize the growing publicly available biological annotation, chemical screening, RNA interference screening, expression, amplification and 3D structural data. Scientists can, in a single place, rapidly identify biological annotation of a target, its structural characterization, expression levels and protein interaction data, as well as suitable cell lines for experiments, potential tool compounds and similarity to known drug targets. canSAR has, from the outset, been completely use-case driven which has dramatically influenced the design of the back-end and the functionality provided through the interfaces. The Web interface at http://cansar.icr.ac.uk provides flexible, multipoint entry into canSAR. This allows easy access to the multidisciplinary data within, including target and compound synopses, bioactivity views and expert tools for chemogenomic, expression and protein interaction network data.


Figures

Figure 1.
Figure 1.
Modular design of canSAR: large pieces represent elemental types, small pieces represent associations. This design allows new elemental data types to be added and new interconnecting (association) data to be introduced.
Figure 2.
Figure 2.
Common requested information in cancer translational research used to design the user interface. Query can be from a biological or chemical starting point. Users often require complex, interconnected but concise information. The data reports generated in canSAR are used to underpin subsequent discussions and the design of the next experiment.
Figure 3.
Figure 3.
View of some components of target synopsis for Epithelial Growth Factor Receptor (EGFR). The main panel (A) shows gene expression ordered by the highest expressed probeset from the NCI60 cell line panel expression data. The details of all available probesets can be seen in the expander. At the top of the main panel is the target synopsis banner, which is made up of icons that indicate certain properties. From the left, these properties are: structure availability, drug target status, RNAi data availability, enzyme status and mutation data availability. Approved drugs are shown in (B). If the drug is an antibody, then a generic antibody icon is displayed. If the drug is a small molecule then a link to the compound synopsis is provided. Panel (C) shows tissue sample expression data from ArrayExpress hierarchically classified into cancer types.
Figure 4.
Figure 4.
Identification of tool compounds for ABL1. Panel (A) shows the search results from a sequence similarity search of ABL1. Only homologues with percentage identities >50% are selected to increase the chance of finding an active against ABL1 itself. Panel (B) shows the chemical space of good affinity compounds against ABL1 and selected homologues. Panel (C) displays only sub micromolar affinity compound structures. A search instigated using these compounds allows identification of likely selectivity across homologues. Panel (D) shows the bioactivity profile of these compounds. Compound identifiers are on the y-axis and target names on the x-axis. A blue dot represents a measured compound bioactivity and the darker the dot the higher the affinity of the compound against the target. This profile can be used to indicate the selectivity of the compounds against measured targets.
Figure 5.
Figure 5.
A screenshot of an annotated interaction network for ABL1. Each node is a protein coloured by the presence/absence of certain types of data. Each protein is annotated with chemical and biological information as indicated by the activation of the traffic lights. From the left, these traffic lights are green if the following data is positively available: chemical screening data (informs user of previous screening efforts against target), good affinity chemical screening data (tool compounds available), drug target status (green of target is the target of an approved pharmaceutical), enzyme status (green if the protein is an enzyme, as enzymes form ∼50% of successful drug targets (38) and enzymatic activity is useful for assay development during target validation), structural characterization, RNAi data and structure-based and ligand-based druggability. The colour of the node is then determined from the number of different annotation types available.
Figure 6.
Figure 6.
Use case for imatinib. The main panel (A) shows the compound synopsis for imatinib. The structure is shown with the murko scaffold highlighted in red. The banner at the top highlights certain properties indicated by icons which are active/inactive. From the left, the icons are active if the following properties are positive: is chiral, is rule-of five compliant, is solved in complex in a 3D structure, contains a toxicophore, is a clinical candidate, is a marketed drug, has a black-box warning, is oral, is injected, is topical and is a prodrug. Panel (B) displays the 3D structures solved in complex with Imatinib. Panel (C) shows the superposition of a SYK structure with an ABL1 structure. In green is the well-known DFG-out binding mode. In yellow is the alternative mode adopted in SYK when imatinib changes conformation and binds in a canonical, directly ATP competitive mode.

Similar articles

Cited by

References

    1. Schlabach M, Luo J, Solimini N, Hu G, Xu Q, Li M, Zhao Z, Smogorzewska A, Sowa M, Ang X, et al. Cancer proliferation gene discovery through functional genomics. Science. 2008;319:620–624. - PMC - PubMed
    1. Zheng-Bradley X, Rung J, Parkinson H, Brazma A. Large scale comparison of global gene expression patterns in human and mouse. Genome Biol. 2010;11:R124. - PMC - PubMed
    1. Palsson B, Zengler K. The challenges of integrating multi-omic data sets. Nat. Chem. Biol. 2010;6:787–789. - PubMed
    1. Hoffmann R, Valencia A. A gene network for navigating the literature. Nat. Genet. 2004;36:664–664. - PubMed
    1. Safran M, Dalah I, Alexander J, Rosen N, Iny Stein T, Shmoish M, Nativ N, Bahir I, Doniger T, Krug H, et al. GeneCards Version 3: the human gene integrator. Database. 2010;2010 doi:10.1093/database/baq020. - PMC - PubMed

Publication types

Substances