

Ultrasensitive detection of rare mutations using next-generation targeted resequencing
- PMID: 22013163
- PMCID: PMC3245950
- DOI: 10.1093/nar/gkr861
Ultrasensitive detection of rare mutations using next-generation targeted resequencing
Abstract
With next-generation DNA sequencing technologies, one can interrogate a specific genomic region of interest at very high depth of coverage and identify less prevalent, rare mutations in heterogeneous clinical samples. However, the mutation detection levels are limited by the error rate of the sequencing technology as well as by the availability of variant-calling algorithms with high statistical power and low false positive rates. We demonstrate that we can robustly detect mutations at 0.1% fractional representation. This represents accurate detection of one mutant per every 1000 wild-type alleles. To achieve this sensitive level of mutation detection, we integrate a high accuracy indexing strategy and reference replication for estimating sequencing error variance. We employ a statistical model to estimate the error rate at each position of the reference and to quantify the fraction of variant base in the sample. Our method is highly specific (99%) and sensitive (100%) when applied to a known 0.1% sample fraction admixture of two synthetic DNA samples to validate our method. As a clinical application of this method, we analyzed nine clinical samples of H1N1 influenza A and detected an oseltamivir (antiviral therapy) resistance mutation in the H1N1 neuraminidase gene at a sample fraction of 0.18%.
Figures
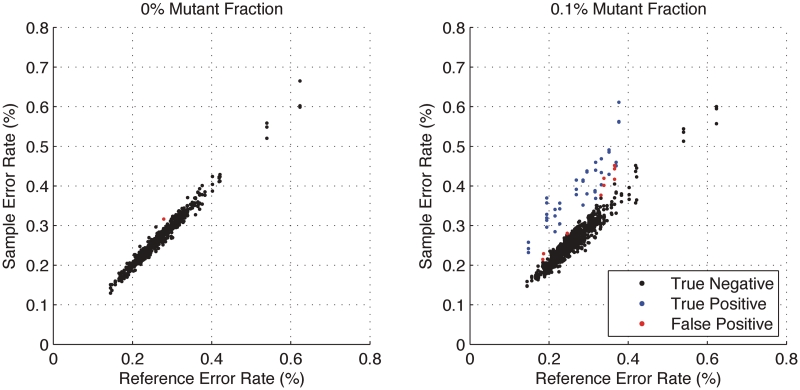
 in the model and the y-axis is the sample error rate (error read depth/total read depth). True negatives (black), true positives (blue) and false positives (red) for three replicates are identified in both samples. For each of the three replicates, the model finds 14 of 14 true positives; 5, 4 and 1 additional calls (false positives), respectively, are made. Requiring a consensus call of all three replicates eliminates these false positives.
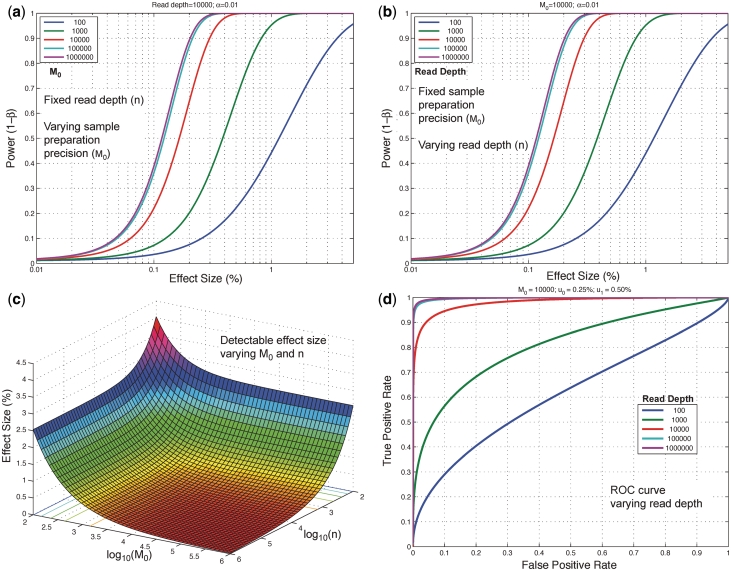
 ) up to a limit of approximately 0.4 for an effect size of 0.1%. (b) When the experimental precision (
 ) is held constant at 10 000, power increases with read depth (n) up to a limit of approximately 0.4 for an effect size of 0.1%. (c) For a fixed false positive and false negative rate, the detectable effect size decreases with both increasing sample preparation precision (
 ) and read depth (
 ). A greater gain is achieved by improving sample preparation precision than by increasing read depth if the experimental variation is large. (d) The ROC curve for a fixed effect size and sample preparation precision improves rapidly as the read depth increases. Read depth limits the sensitivity at all false positive rates when low, but when read depth is high the ROC curve approaches an asymptotic curve controlled by the experimental variation.
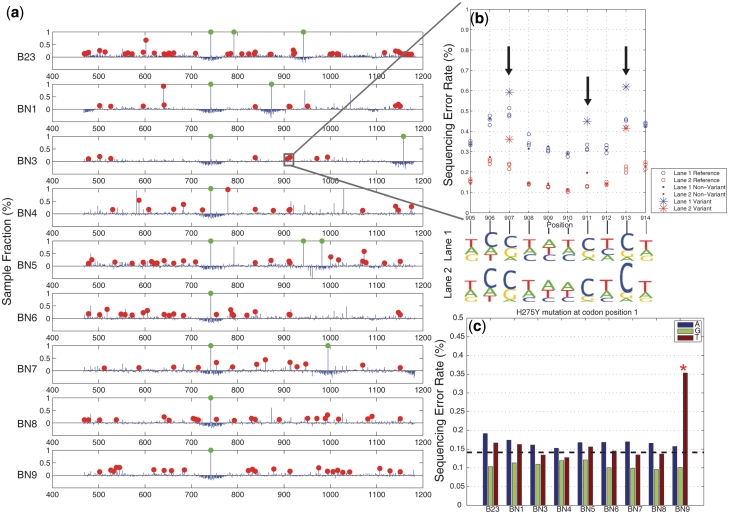
 ) and has a sample fraction >0.1% and green dots indicate an estimated sample fraction >1%. (b) A detail display of 10 positions in sample BN3 shows the difference between the reference and sample sequencing error rates for called mutations in two replicate lanes. The non-reference base composition for both lanes (in sequence logo format) shows that the three mutations are T to C pyrimidine transitions. (c) We identified the H275Y mutation responsible for oseltamivir resistance in one clinical sample (BN9). Across all of the H1N1 clinical samples, we display a breakdown of the individual sequencing error rate for the non-reference bases at codon position 1. The mutation in sample BN9 is readily apparent. The dotted line indicates the expected base error rate from a uniform distribution across bases using the total sequencing error rate.
Similar articles
-
Detection of the rapid emergence of the H275Y mutation associated with oseltamivir resistance in severe pandemic influenza virus A/H1N1 09 infections.Antiviral Res. 2010 Jul;87(1):16-21. doi: 10.1016/j.antiviral.2010.04.002. Epub 2010 Apr 10. Antiviral Res. 2010. PMID: 20385168
-
Highly sensitive and quantitative detection of the H274Y oseltamivir resistance mutation in seasonal A/H1N1 influenza virus.J Clin Microbiol. 2010 Oct;48(10):3517-24. doi: 10.1128/JCM.01031-10. Epub 2010 Jul 28. J Clin Microbiol. 2010. PMID: 20668122 Free PMC article.
-
High-resolution melting approach to efficient identification and quantification of H275Y mutant influenza H1N1/2009 virus in mixed-virus-population samples.J Clin Microbiol. 2011 Oct;49(10):3555-9. doi: 10.1128/JCM.01087-11. Epub 2011 Aug 24. J Clin Microbiol. 2011. PMID: 21865430 Free PMC article.
-
Evaluation of a rapid molecular algorithm for detection of pandemic influenza A (H1N1) 2009 virus and screening for a key oseltamivir resistance (H275Y) substitution in neuraminidase.J Clin Virol. 2010 Jan;47(1):34-7. doi: 10.1016/j.jcv.2009.09.030. Epub 2009 Oct 25. J Clin Virol. 2010. PMID: 19857993 Free PMC article.
-
Pandemic H1N1 2009 influenza virus with the H275Y oseltamivir resistance neuraminidase mutation shows a small compromise in enzyme activity and viral fitness.J Antimicrob Chemother. 2011 Mar;66(3):466-70. doi: 10.1093/jac/dkq486. Epub 2010 Dec 16. J Antimicrob Chemother. 2011. PMID: 21172786 Free PMC article.
Cited by
-
Implications of genetic heterogeneity in cancer.Ann N Y Acad Sci. 2012 Sep;1267:110-6. doi: 10.1111/j.1749-6632.2012.06590.x. Ann N Y Acad Sci. 2012. PMID: 22954224 Free PMC article.
-
RVD2: an ultra-sensitive variant detection model for low-depth heterogeneous next-generation sequencing data.Bioinformatics. 2015 Sep 1;31(17):2785-93. doi: 10.1093/bioinformatics/btv275. Epub 2015 Apr 29. Bioinformatics. 2015. PMID: 25931517 Free PMC article.
-
A new approach for detecting low-level mutations in next-generation sequence data.Genome Biol. 2012 May 23;13(5):R34. doi: 10.1186/gb-2012-13-5-r34. Genome Biol. 2012. PMID: 22621726 Free PMC article.
-
Limited Practical Utility of Liquid Biopsy in the Treated Patients with Advanced Breast Cancer.Diagnostics (Basel). 2020 Jul 28;10(8):523. doi: 10.3390/diagnostics10080523. Diagnostics (Basel). 2020. PMID: 32731384 Free PMC article.
-
Accuracy of Next Generation Sequencing Platforms.Next Gener Seq Appl. 2014;1:1000106. doi: 10.4172/jngsa.1000106. Next Gener Seq Appl. 2014. PMID: 25699289 Free PMC article.
References
-
- Thomas RK, Nickerson E, Simons JF, Janne PA, Tengs T, Yuza Y, Garraway LA, LaFramboise T, Lee JC, Shah K, et al. Sensitive mutation detection in heterogeneous cancer specimens by massively parallel picoliter reactor sequencing. Nat. Med. 2006;12:852–855. - PubMed
Publication types
MeSH terms
Substances
Grants and funding
LinkOut - more resources
Full Text Sources
Other Literature Sources
Research Materials
