. 2012 Feb;107(3):966-72.
doi: 10.1152/jn.00690.2011. Epub 2011 Oct 19.

A new measure of cortical inhibition by mechanomyography and paired-pulse transcranial magnetic stimulation in unanesthetized rats

Affiliations

A new measure of cortical inhibition by mechanomyography and paired-pulse transcranial magnetic stimulation in unanesthetized rats

Tsung-Hsun Hsieh et al. J Neurophysiol. 2012 Feb.

Abstract

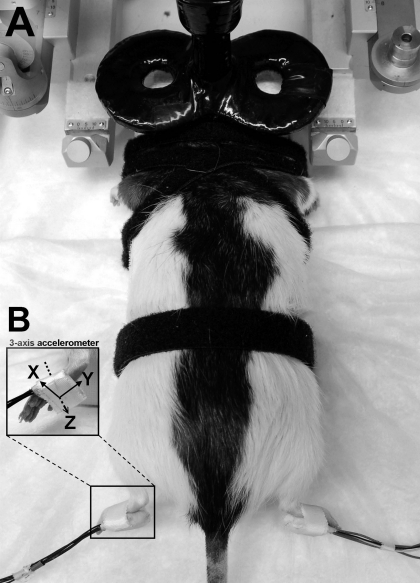
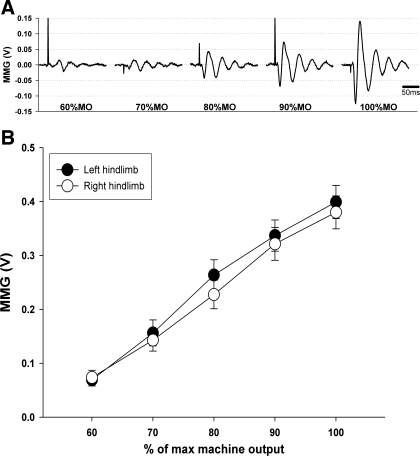
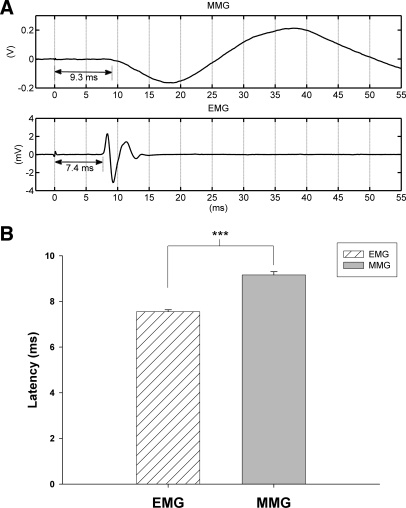
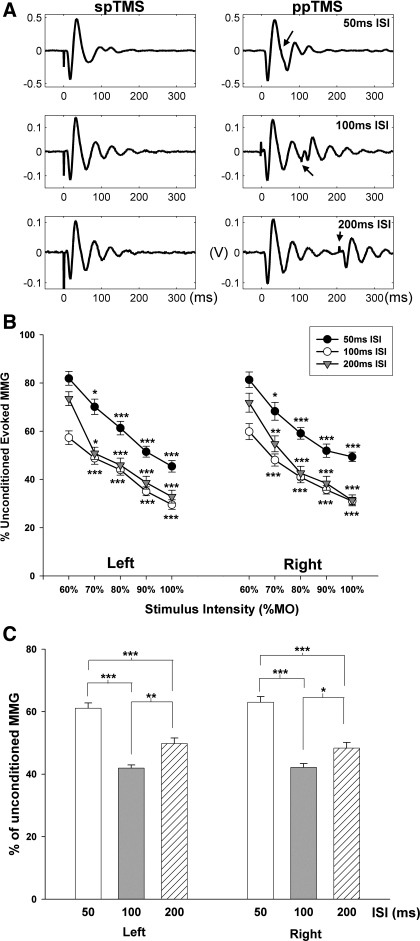
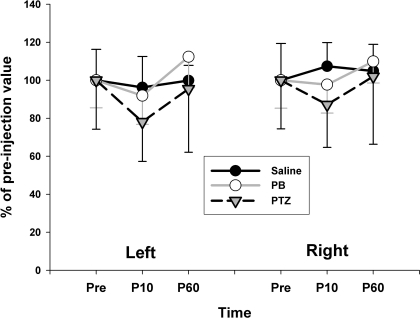
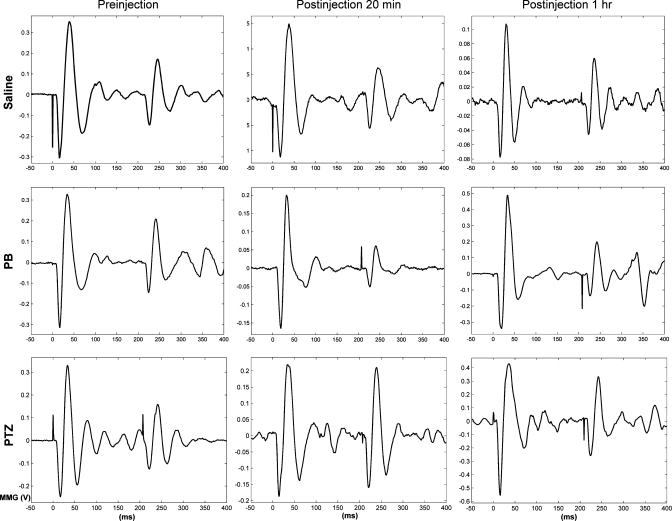
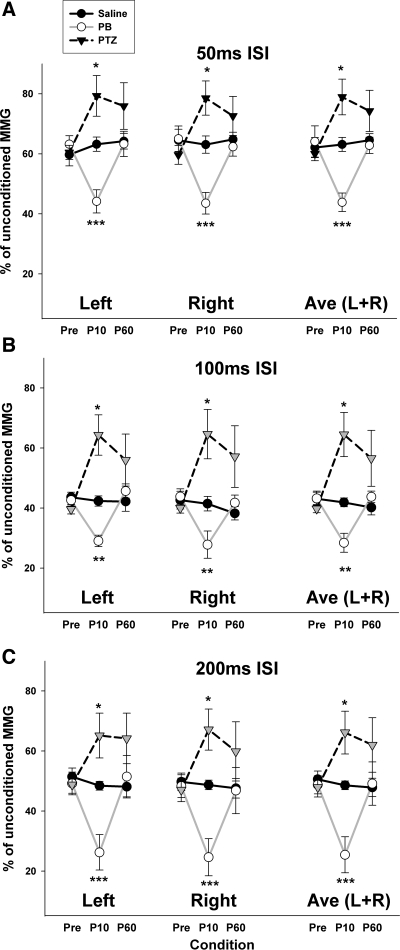
Paired-pulse transcranial magnetic stimulation (ppTMS) is a safe and noninvasive tool for measuring cortical inhibition in humans, particularly in patients with disorders of cortical inhibition such as epilepsy. However, ppTMS protocols in rodent disease models, where mechanistic insight into the ppTMS physiology and into disease processes may be obtained, have been limited due to the requirement for anesthesia and needle electromyography. To eliminate the confounding factor of anesthesia and to approximate human ppTMS protocols in awake rats, we adapted the mechanomyogram (MMG) method to investigate the ppTMS inhibitory phenomenon in awake rats and then applied differential pharmacology to test the hypothesis that long-interval cortical inhibition is mediated by the GABA(A) receptor. Bilateral hindlimb-evoked MMGs were elicited in awake rats by long-interval ppTMS protocols with 50-, 100-, and 200-ms interstimulus intervals. Acute changes in ppTMS-MMG were measured before and after intraperitoneal injections of saline, the GABA(A) agonist pentobarbital (PB), and GABA(A) antagonist pentylenetetrazole (PTZ). An evoked MMG was obtained in 100% of animals by single-pulse stimulation, and ppTMS resulted in predictable inhibition of the test-evoked MMG. With increasing TMS intensity, MMG amplitudes increased in proportion to machine output to produce reliable input-output curves. Simultaneous recordings of electromyography and MMG showed a predictable latency discrepancy between the motor-evoked potential and the evoked MMG (7.55 ± 0.08 and 9.16 ± 0.14 ms, respectively). With pharmacological testing, time course observations showed that ppTMS-MMG inhibition was acutely reduced following PTZ (P < 0.05), acutely enhanced after PB (P < 0.01) injection, and then recovered to pretreatment baseline after 1 h. Our data support the application of the ppTMS-MMG technique for measuring the cortical excitability in awake rats and provide the evidence that GABA(A) receptor contributes to long-interval paired-pulse cortical inhibition. Thus ppTMS-MMG appears a well-tolerated biomarker for measuring GABA(A)-mediated cortical inhibition in rats.


Figures

Fig. 1.
Fig. 1.
A: transcranial magnetic stimulation (TMS)-mechanomyogram (MMG) setup. Unanesthetized rat is restrained on a platform with 4 straps with minimal discomfort. The figure-of-8 TMS coil is centered over the dorsal scalp at the interaural line. B: example of MMG sensor placement. The MMG is obtained by 2 3-axis square-shaped accelerometer elements on each ventral surface of the foot by adhesive tape while the rat is under brief isoflurane anesthesia before placement into the restraint.
Fig. 2.
Fig. 2.
A: representative evoked MMG from 1 rat as a function of TMS intensity from 60 to 100% machine output (MO). An increase of MMG amplitude was noted with an increasing TMS intensity. B: average input-output curve of the unconditioned evoked MMG from 27 rats.
Fig. 3.
Fig. 3.
Representative trace of motor-evoked potential (MEP) recorded by electromyogram (EMG) and evoked MMG during single–pulse TMS in 1 rat is shown (A). Mean latency of MEP and evoked MMG in 7 rats is also shown (B). max, Maximum. ***P < 0.001 as compared between EMG and MMG.
Fig. 4.
Fig. 4.
Long-interval paired-pulse inhibition of the test evoked MMG as a function of 3 interstimulus intervals (ISIs) in rats. A: representative data during single- (spTMS; left) or paired-pulse TMS (ppTMS; right) within each ISI of 50, 100, and 200 ms, respectively. Arrow indicates the onset of the test stimulus. B: effect of a stimulus intensity on paired-pulse inhibition at each of 3 ISIs. Note the more prominent inhibition while increasing conditioning stimulus. Asterisks represent significant differences compared with inhibition at 60% MO by Bonferroni post hoc test. C: the graph shows the conditioned MMG peak-to-peak amplitude normalized to unconditioned MMG peak-to-peak amplitude, expressed as the percentage of unconditioned MMG. *P < 0.05; **P < 0.01; **P < 0.001 per ISI pair comparison by Bonferroni post hoc test. Data are expressed as means ± SE.
Fig. 5.
Fig. 5.
Changes in unconditioned MMG over time following saline, pentobarbital (PB), or pentylenetetrazole (PTZ) administration. Graph shows the change in unconditioned MMG as a percentage of preinjection MMG (means ± SE). The measured parameters were compared with preinjection level in each stage. No significant differences were found when compared with preinjection value. Pre, before drug treatment; P10, 10 min postinjection; P60, 60 min postinjection.
Fig. 6.
Fig. 6.
Examples of time course changes of long-interval ppTMS (LI-ppTMS) inhibition at 200-ms ISI following saline, PB, and PTZ administration. Representative MMG tracings following injection (middle column) show no obvious change in LI-ppTMS inhibition in the saline group, increased inhibition in PB group, and reduced inhibition in the PTZ group (middle column).
Fig. 7.
Fig. 7.
Changes in LI-ppTMS inhibition after saline, PB, and PTZ administration. Data were compared with the average (Ave) level of inhibition in the saline (control) group at each time point for 50-ms ISI (A), 100-ms ISI (B), and 200-ms ISI (C). Note clear separation between PB and PTZ, with PTZ causing reduced inhibition for all time points and the PB causing increased inhibition after 10-min administration (P10) but return to normal inhibition 1 h postinjection (P60). Asterisks represent significant differences compared with saline group at specific time points (unpaired t-test); *P < 0.05, **P < 0.01, ***P < 0.001. L+R, left and right hindpaw averaged values.

Similar articles

Cited by

References

    1. Badawy RA, Macdonell RA, Berkovic SF, Newton MR, Jackson GD. Predicting seizure control: cortical excitability and antiepileptic medication. Ann Neurol 67: 64–73, 2010a - PubMed
    1. Badawy RA, Macdonell RA, Jackson GD, Berkovic SF. Can changes in cortical excitability distinguish progressive from juvenile myoclonic epilepsy? Epilepsia 51: 2084–2088, 2010b - PubMed
    1. Chen R. Interactions between inhibitory and excitatory circuits in the human motor cortex. Exp Brain Res 154: 1–10, 2004 - PubMed
    1. Chen R, Tam A, Butefisch C, Corwell B, Ziemann U, Rothwell JC, Cohen LG. Intracortical inhibition and facilitation in different representations of the human motor cortex. J Neurophysiol 80: 2870–2881, 1998 - PubMed
    1. Kobayashi M, Pascual-Leone A. Transcranial magnetic stimulation in neurology. Lancet Neurol 2: 145–156, 2003 - PubMed

Publication types

MeSH terms

LinkOut - more resources