

doi: 10.4103/0971-3026.85369.
Novel positron emission tomography radiotracers in brain tumor imaging
Affiliations
- PMID: 22013296
- PMCID: PMC3190493
- DOI: 10.4103/0971-3026.85369
Item in Clipboard
Novel positron emission tomography radiotracers in brain tumor imaging
Indian J Radiol Imaging.
2011 Jul.
Abstract
Although [18F] 2-fluoro-2-deoxy-D-glucose (FDG) is the most widely used radiopharmaceutical the world over, it is not the ideal tracer for brain imaging, owing to its high physiological cortical uptake and lack of specificity. This has paved the way for the introduction of several novel radiotracers, each with their own inherent strengths and limitations. We present the insights gained from the use of these radiotracers at our institution.
Keywords: Brain tumor; Novel Positron emission tomography radiotracers.
Conflict of interest statement
Figures
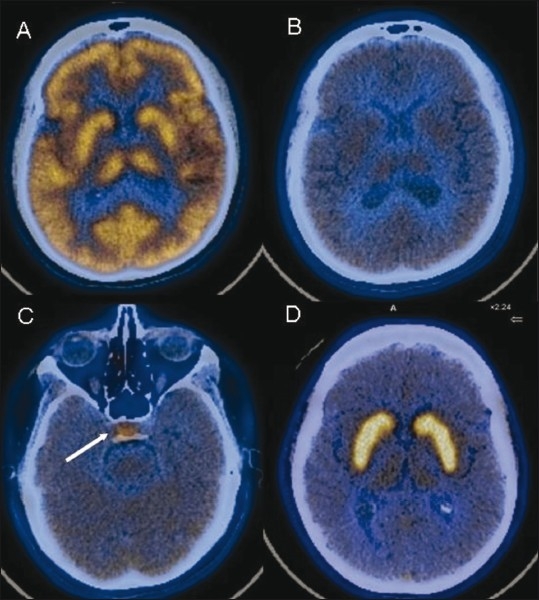
Normal radiotracer distribution pattern. Axial fused FDG PET/CT image (A) shows normal uptake in the cortex and basal ganglia. Axial fused 11C methionine PET/CT images (B,C) shows reduced parenchymal uptake with relatively increased uptake in the pituitary gland (arrow). Axial fused F-DOPA image (D) shows high tracer accumulation in both basal ganglia
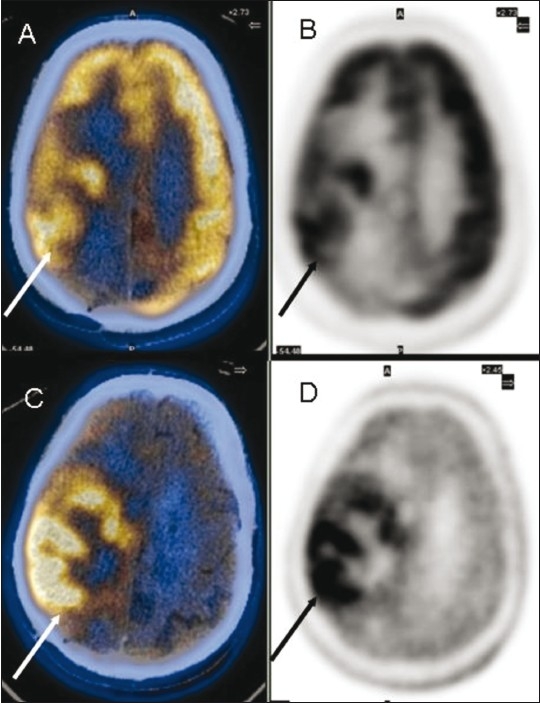
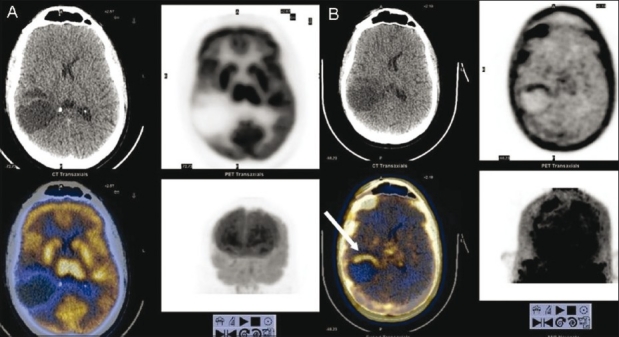
Glioblastoma multiforme in the right frontoparietal region. Axial fused FDG PET/CT (A) and PET (B) images show the extent of the lesion (arrows). Axial fused 11C methionine PET/CT (C) and PET (D) images show better visualization of the extent and margins (arrow)
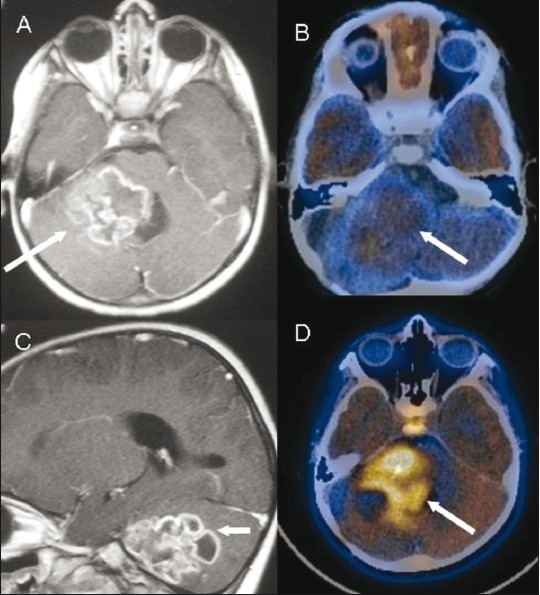
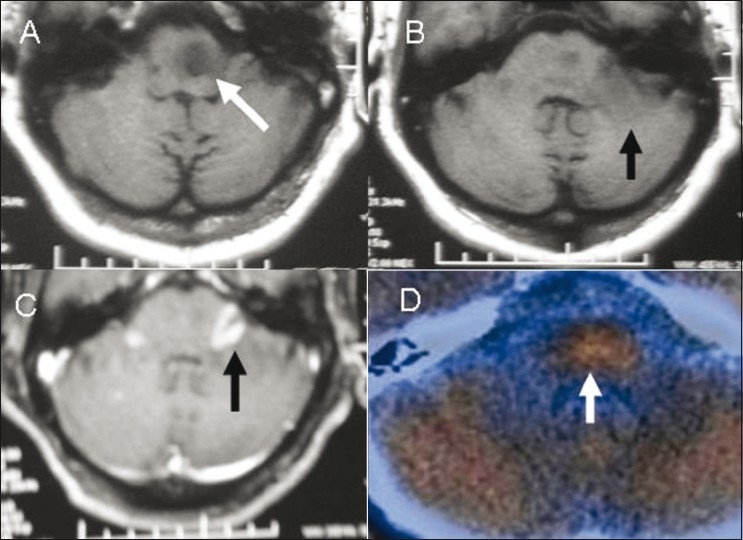
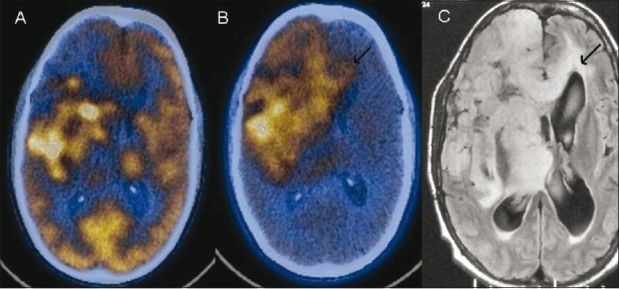
Posterior fossa glioma. Contrast-enhanced axial (A) and sagittal (C) MRI images show a conglomerate ring-enhancing lesion (arrow) that was mistaken for a tuberculoma. Axial fused FDG PET/CT image (B) shows low-grade FDG uptake (arrow). Axial fused 11C methionine PET/CT image (D) shows uptake (arrow), consistent with a high-grade malignancy. Note normal uptake in the pituitary gland
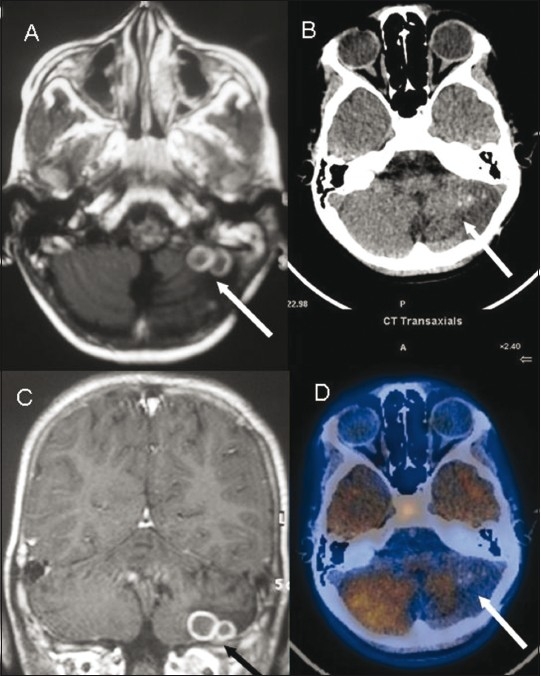
Posterior fossa tuberculoma. Axial (A) and coronal (C) contrast enhanced MRI images show conglomerate ring-enhancing lesions (arrow) in the left lesions (arrow) with surrounding edema with reduced tracer uptake cerebellar hemisphere. Axial non-contrast CT scan (B) and fused 11C methionine PET/CT (D) images show rounded Increased radiotracer uptake in the pituitary fossa region is noted again
Brain stem glioma, post-radiotherapy. Axial T1W MRI images (A,B) show the glioma as a hypointense lesion (white arrow in A) that does not enhance on contrast administration with another hypointense lesion (black arrow in B) in the left middle cerebellar peduncle, which shows intense enhancement (black arrow) on a contrast-enhanced T1W axial MRI image (C). Axial fused 11C methionine PET/CT image (D) shows tracer uptake in the former, suggestive of an active lesion, with absent uptake in the latter due to post-radiotherapy changes
Contrast-enhanced CT scan(A,B) show a left frontal grade II fibrillary astrocytoma (post-surgery and post-radiotherapy) with a peripherally enhancing cavity (arrow) that is equivocal for tumor residue/post-radiotherapy changes, which was also the case on a contrast-enhanced MRI (not shown). Axial FDG PET/CT image (C) shows no radiotracer uptake (arrow). Axial 11C methionine PET/ CT (D) shows increased uptake anteriorly (arrow), and this was later proven to be tumor residue on biopsy
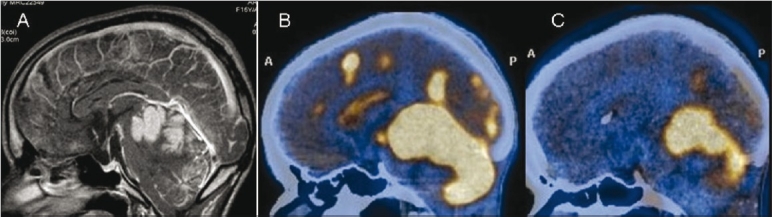
Neurocutaneous melanosis. Sagittal contrast-enhanced MRI image shows intensely enhancing areas of leptomeningeal thickening along the cerebellar folia, cerebral sulci, and ependyma (arrows). Sagittal FDG (B) and 11C methionine (C) PET/CT images show intense uptake (arrows) at the corresponding sites. However, there was no evidence of malignant transformation on biopsy
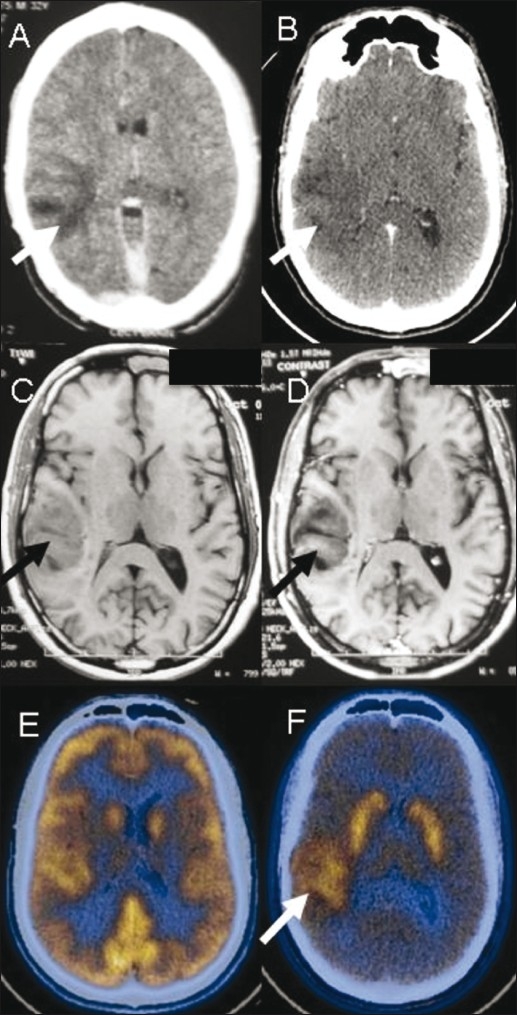
A 32-year-male presented with seizures. Contrast-enhanced CT scan (A) done in 2008 shows a poorly enhancing hypodense lesion (arrow) in the right temporal lobe. A repeat contrast-enhanced CT scan (B) in 2010 shows no change (arrow). T1W axial MRI images in 2010 (C,D) show a poorly enhancing lesion (arrow) in the cortical and subcortical white matter. FDG PET/CT image (E) is unremarkable. F-DOPA PET/CT image (F) shows increased uptake (arrow) suggestive of a low-grade malignant neoplasm eventually proven to be oligodendroglioma
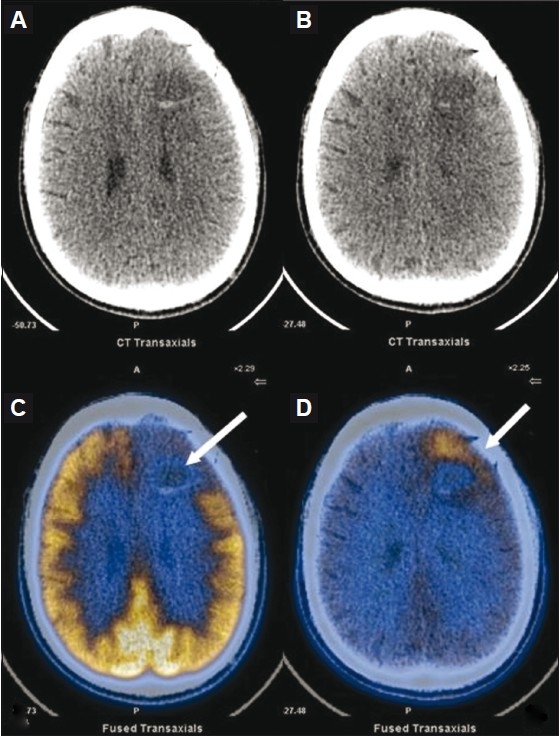
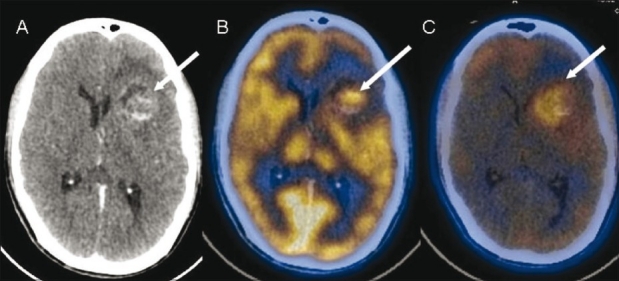
Post-operative case of low-grade right frontal astrocytoma. Axial FDG PET/CT image (A) shows residual tumor (arrows) in the right fronto-parietal region. However, the F-DOPA PET/ CT image (B) delineates the actual extent of the lesion (arrows), which is seen to cross the midline as is also seen (arrows) on the corresponding FLAIR axial MRI image (C)
Postoperative case of grade III glioma. FDG PET/ CT image (A) shows no abnormal tracer uptake at the operative site. FLT PET/CT image (B) shows evidence of tumor recurrence anteriorly at the periphery of the lesion
Left frontal anaplastic astrocytoma. Contrast-enhanced CT scan (A) shows a solid-cystic lesion (arrow) with heterogenous enhancement in the solid component. FDG PET/CT image (B) shows tracer uptake (arrow) in the solid portion of the lesion, while FMISO PET/CT image (C) shows diffusely increased uptake (arrow) suggestive of extensive tumor hypoxia
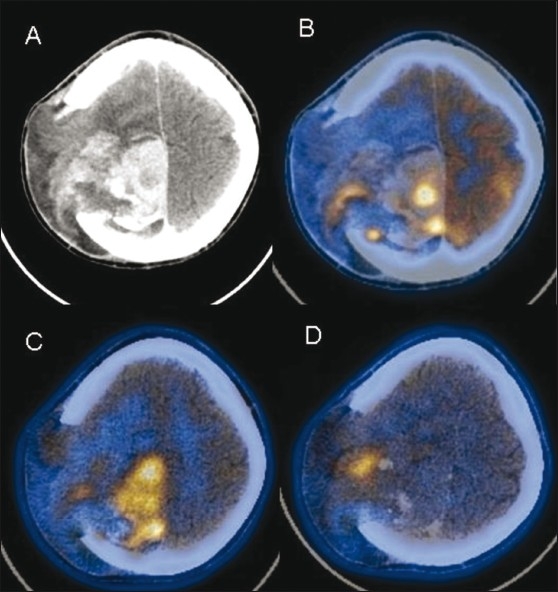
Postoperative case of gliosarcoma. Contrast-enhanced CT scan (A) shows an intensely enhancing residual lesion (arrow) in the right high frontoparietal region, herniating through a calvarial defect. FDG PET/CT image (B) shows heterogeneous uptake (arrow) in the lesion with more extensive involvement (arrow) seen on the 11C methionine PET/CT image (C). FMISO PET/CT image (D) shows a focal area of tumor hypoxia (arrow) at the site of herniation
References
-
- Patronas NJ, Chiro G, Brooks RA, DeLaPaz RL, Kornblith PL, Smith BH, et al. Work in progress: [18F] fluorodeoxyglucose and positron emission tomography in the evaluation of radiation necrosis of the brain. Radiology. 1982;144:885–9. - PubMed
-
- Kracht LW, Miletic H, Busch S, Jacobs AH, Voges J, Hoevels M, et al. Delineation of brain tumor extent with [11C]L-methionine positron emission tomography: Local comparison with stereotactic histopathology. Clin Cancer Res. 2004;10:7163–71. - PubMed
-
- Jager PL, Vaalburg W, Pruim J, Vries EG, Langen KJ, Piers DA. Radiolabeled amino acids: Basic aspects and clinical applications in oncology. J Nucl Med. 2001;42:432–45. - PubMed
LinkOut - more resources
Full Text Sources
Other Literature Sources