. 2011 Oct 11:5:81.
doi: 10.3389/fnsys.2011.00081. eCollection 2011.

A computational study of how orientation bias in the lateral geniculate nucleus can give rise to orientation selectivity in primary visual cortex

Affiliations

A computational study of how orientation bias in the lateral geniculate nucleus can give rise to orientation selectivity in primary visual cortex

Levin Kuhlmann et al. Front Syst Neurosci. .

Abstract

Controversy remains about how orientation selectivity emerges in simple cells of the mammalian primary visual cortex. In this paper, we present a computational model of how the orientation-biased responses of cells in lateral geniculate nucleus (LGN) can contribute to the orientation selectivity in simple cells in cats. We propose that simple cells are excited by lateral geniculate fields with an orientation-bias and disynaptically inhibited by unoriented lateral geniculate fields (or biased fields pooled across orientations), both at approximately the same retinotopic co-ordinates. This interaction, combined with recurrent cortical excitation and inhibition, helps to create the sharp orientation tuning seen in simple cell responses. Along with describing orientation selectivity, the model also accounts for the spatial frequency and length-response functions in simple cells, in normal conditions as well as under the influence of the GABA(A) antagonist, bicuculline. In addition, the model captures the response properties of LGN and simple cells to simultaneous visual stimulation and electrical stimulation of the LGN. We show that the sharp selectivity for stimulus orientation seen in primary visual cortical cells can be achieved without the excitatory convergence of the LGN input cells with receptive fields along a line in visual space, which has been a core assumption in classical models of visual cortex. We have also simulated how the full range of orientations seen in the cortex can emerge from the activity among broadly tuned channels tuned to a limited number of optimum orientations, just as in the classical case of coding for color in trichromatic primates.

Keywords: length–response function; orientation tuning; simple cells; spatial frequency; striate cortex.


Figures

Figure 1
Figure 1
(A) Schematic of the feed-forward component of the ALD-RM model. The input projects to ON-center LGN cells. A weakly anisotropic ON LGN field provides feed-forward excitation to the excitatory simple cell while an isotropic ON LGN field provides disynaptic feed-forward inhibition of the excitatory simple cell via an isotropic inhibitory cell. Inhibitory simple cells also receive LGN inputs in the same manner. Anisotropic LGN and simple cells are modeled for the full range of orientation preferences. As defined in the methods, oriented excitatory and inhibitory simple cells are recurrently connected across orientation following a “Mexican hat” weighting profile. (B) LGN RFs, cortical pseudo-RFs and LGN outputs. (i) The six types of DOG spatial filters which determine the LGN inputs to the simulated simple cells. Each filter is plotted in two-dimensions and as a one-dimensional plot through the vertical midline of the filter (indicated by the dashed line). For simple cell (S1): anisotropic center with a weak surround (top left) and unoriented center with a stronger surround (top right). For simple cell (S2): anisotropic center with a weak, narrow surround (middle left) and unoriented center with a stronger, narrow surround (middle right). For the simple-like hypercomplex cell (SH): anisotropic center with a strong surround (bottom left) and isotropic center with a weaker surround (bottom right). (ii) Pseudo-RFs of the cortical cell inputs constructed by rectifying their corresponding LGN DOG kernels [shown in (i)] and linearly combining them with the weights given in Table 1. The top, middle and bottom rows correspond to the pseudo-RFs of the (S1), (S2), and (SH) cells, respectively. Normalized polar bar-response plots from (iii) a simulated orientation-biased ON-center LGN cell with a weak surround and (iv) a real ON-center LGN cell recorded from a cat (Data adapted from Vidyasagar and Urbas, 1982).
Figure 2
Figure 2
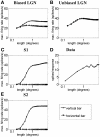
Length–response functions of simple cells S1 and S2 showing length summation. The plots show simulated length–response functions of (A) an ON LGN cell with a vertically biased center and a weak isotropic inhibitory surround, (B) an ON LGN cell with an isotropic center and a strong isotropic inhibitory surround, and (C) the corresponding vertically oriented simple cell S1 in response to a vertical bar (solid lines) and a horizontal bar (dashed lines). (D) The length–response function of a real simple cell with length summation in response to a bar of the preferred orientation (Data adapted from Kato et al., 1978). (E) The response of the vertically oriented simple cell S2 to a vertical bar (solid lines) and a horizontal bar (dashed lines). In (A–C) and (E) the y-axis represents the maximum firing rate (spikes/seconds) reached before the bar is switched off, and the x-axis represents the bar length in degrees. In (D) the y-axis represents number of spikes recorded per response to a bar (as defined by Kato et al., 1978).
Figure 3
Figure 3
Length–response function of the simple-like hypercomplex cell showing end-stopping. The plots show simulated length–response functions of (A) an ON LGN cell with a vertically biased center and a strong isotropic inhibitory surround, (B) an ON LGN cell with an isotropic center and a weak isotropic inhibitory surround, and (C) the corresponding vertically oriented simple-like hypercomplex cell with end-stopping in response to a vertical bar (solid lines) and a horizontal bar (dashed lines). (D) The length–response function of a real simple-like hypercomplex cell in response to a bar of the preferred orientation (Data adapted from Kato et al., 1978). Axes are the same as defined in Figure 2.
Figure 4
Figure 4
Spatial frequency-response function of the simple cell S1 with length summation. The plots show simulated SF-response functions of (A) an ON LGN cell with a vertically biased center and a weak isotropic inhibitory surround, (B) an ON LGN cell with an isotropic center and a strong isotropic inhibitory surround, and (C) the corresponding vertically oriented simple cell S1 in response to a vertical grating (solid lines) and a horizontal grating (dashed lines). (D) The SF-response function of a real simple cell with length summation in response to vertical and horizontal gratings (Data adapted from Hammond and Pomfrett, 1990). In (A–D) the y-axis represents the maximum firing rate in spikes/seconds, and the x-axis represents the SF in cycles per degree (CPD).
Figure 5
Figure 5
Spatial frequency-response function of the simple-like hypercomplex cell. The plots show simulated SF-response functions of (A) an ON LGN cell with a vertically biased center and a strong isotropic inhibitory surround, (B) an ON LGN cell with an isotropic center and a weak isotropic inhibitory surround, and (C) the corresponding vertically oriented simple-like hypercomplex cell in response to a vertical Gabor patch (solid lines) and a horizontal Gabor patch (dashed lines). (D) The SF-response function of a real simple-like hypercomplex cell in response to a Gabor patch of the preferred orientation (Data adapted from Kulikowski and Bishop, 1981). Axes are the same as in Figure 4 except in (D) the y-axis represents the normalized response to a grating stimulus of limited extent.
Figure 6
Figure 6
Simulated orientation tuning for simple cell, S1 in response to a bar 0.5° in length. The OT curves are shown for (A) the orientation-biased LGN field with a weak surround driving the simple cell, (B) the unoriented LGN field with a stronger surround that disynaptically inhibits the simple cell, (C) the feed-forward input rate received by the simple cell, and (D) the simple cell S1. In (A–D) the y-axis represents the maximum firing rate in spikes/seconds, and the x-axis represents the bar length in degrees.
Figure 7
Figure 7
Orientation-tuning curves of (A) the simulated simple cell S1, (B) the simulated simple-like hypercomplex cell, (C) a real simple cell with length summation (data adapted from Rose, 1977), and (D) a real simple-like hypercomplex cell (data adapted from Orban et al., 1979) in response to bars of different lengths. Axes the same as in Figure 6.
Figure 8
Figure 8
Orientation-tuning curves of (A) the simulated simple cell S2 and (C) a real simple cell with length summation (data adapted from Vidyasagar and Siguenza, 1985) in response to gratings of different SFs. (B) OT curves of the simulated simple-like hypercomplex cell in response to Gabor patches of different SFs. Legends indicate the SF in cpd. In each plot the y-axis represents the maximum firing rate in spikes/seconds, and the x-axis represents the orientation of the grating or Gabor patch stimulus in degrees.
Figure 9
Figure 9
Half-width-at-half-height (HWHH) versus bar length and HWHH versus spatial frequency. HWHH versus bar length curves produced by (A) the model and (C) real simple cells in response to bars (Data adapted from Henry et al., and Orban et al., 1979). In (A,C) the y-axis represents the HWHH in degrees, and the x-axis represents the bar length in degrees. HWHH versus SF curves produced by (B) the model in response to gratings and Gabor patches and (D) real simple cells in response to gratings (Data adapted from Vidyasagar and Siguenza, 1985). In (B,D) the y-axis represents the HWHH in degrees, and the x-axis represents the SF in cpd. Legend – S1: simple cell S1, S2: simple cell S2, SH: simple-like hypercomplex cell.
Figure 10
Figure 10
Effects of iontophoretic application of bicuculline. (A,E) plot the length–response functions of simple cell S1 and a real simple cell with length summation (Data adapted from Vidyasagar, 1984b) for a bar stimulus of the preferred orientation, respectively. (B,F) plot the length–response functions of a simulated simple-like hypercomplex cell and a real simple-like hypercomplex cell (Data adapted from Vidyasagar, 1984b) for a bar stimulus of the preferred orientation, respectively. (C,G) plot the SF-response functions of simple cell S2 and a real simple cell with length summation (Data adapted from Vidyasagar and Mueller, 1994) for a grating stimulus of the preferred orientation, respectively. (D,H) plot the OT curves for the simulated simple cell S2 for a bar length 1.66° and a real simple cell (Data adapted from Tsumoto et al., 1979), respectively. Control responses are indicated by solid lines, while responses under the influence of bicuculline are indicated by dashed lines.
Figure 11
Figure 11
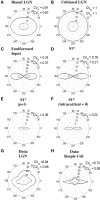
Effects of electrical stimulation in the LGN on orientation selectivity of LGN and simple cells. (A–F) show simulations for the simple cell S1* (see text) in response to bars of length 4.17° either without or during electrical stimulation of the LGN. (A,B) show the responses of the orientation-biased and unoriented LGN cells that provide the feed-forward input to the simple cell, respectively. (C,D) show the responses of the combined feed-forward input to, and the output of, the S1* simple cell, respectively. (E,F) illustrate the output of the S1* simple cell when either the power-law exponent is reduced to p = 1 (from 1.85) or the intra-cortical input is set to zero (i.e., Wce = Wci = Wse = Wsi = 0), respectively. (G,H) demonstrate the responses of a real LGN cell and a real simple cell to bars, respectively, both with or without electrical stimulation in the LGN (adapted from Viswanathan et al., 2011). In all subfigures, responses to visual stimulation alone are indicated by the solid lines, whereas responses to visual stimulation during electrical stimulation are indicated by the dashed lines. Moreover, the CVN and CVE values next to each subfigure indicate the circular variance values calculated from the responses to normal visual stimulation alone or visual stimulation during electrical stimulation, respectively.
Figure 12
Figure 12
“Cardinal” construction of 18 simple cell orientation-tuning curves tuned to the full range of orientation preferences by linearly combining orientation-biased LGN cells with only four orientation biases. Orientation-tuning curves were obtained by stimulating with a bar of length 4.16°. (A) The orientation-tuning curves of the four LGN cells with orientation bias. The unoriented LGN response in (B) was subtracted from a linear combination of the orientation-biased LGN cells to produce the orientation-tuning curves of the feed-forward input to the simple cells in (C). (D) The tuning curves of the simple cells obtained after recurrent competition. For the sake of clarity, tuning curves alternate between solid, dashed, and dash-dot lines.

Similar articles

Cited by

References

    1. Allison J. D., Smith K. R., Bonds A. B. (2001). Temporal-frequency tuning of cross-orientation suppression in the cat striate cortex. Vis. Neurosci. 18, 941–948 - PubMed
    1. Alonso J. M., Usrey W. M., Reid R. C. (2001). Rules of connectivity between geniculate cells and simple cells in cat primary visual cortex. J. Neurosci. 21, 4002–4015 - PMC - PubMed
    1. Bartsch A. P., van Hemmen J. L. (2001). Combined Hebbian development of geniculocortical and lateral connectivity in a model of primary visual cortex. Biol. Cybern. 84, 41–5510.1007/s004220170003 - DOI - PubMed
    1. Berman N. J., Douglas R. J., Martin K. A., Whitteridge D. (1991). Mechanisms of inhibition in cat visual cortex. J. Physiol. (Lond.) 440, 697–722 - PMC - PubMed
    1. Bloomfield S. A., Sherman S. M. (1988). Postsynaptic potentials recorded in neurons of the cat’s lateral geniculate nucleus following electrical stimulation of the optic chiasm. J. Neurophysiol. 60, 1924–1945 - PubMed