. 2011 Oct 11:5:84.
doi: 10.3389/fnsys.2011.00084. eCollection 2011.

Map formation in the olfactory bulb by axon guidance of olfactory neurons

Affiliations

Map formation in the olfactory bulb by axon guidance of olfactory neurons

Benjamin Auffarth et al. Front Syst Neurosci. .

Abstract

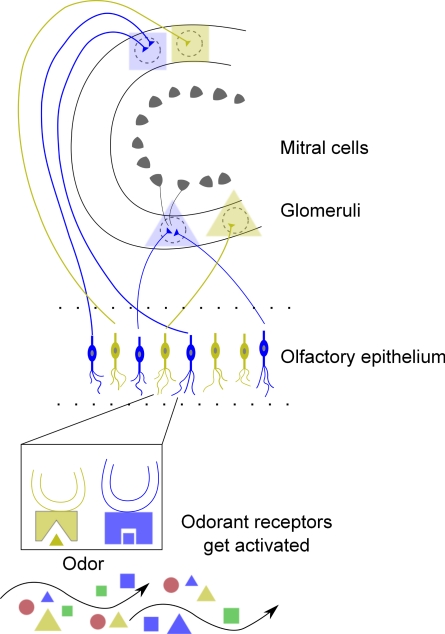
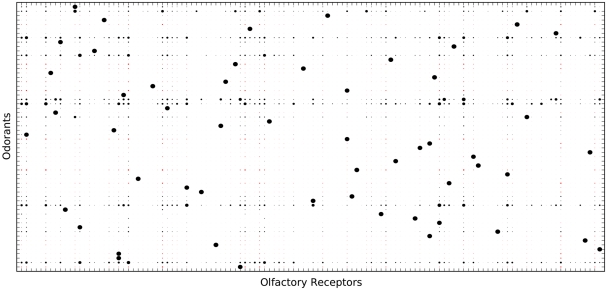
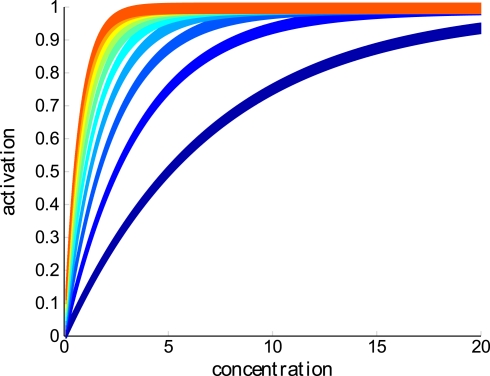
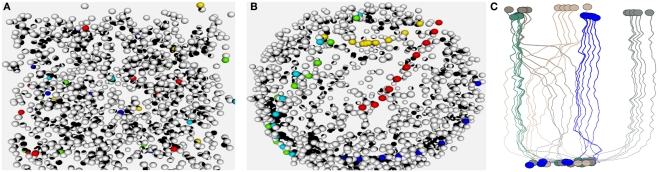
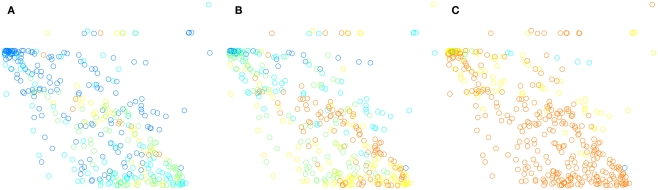
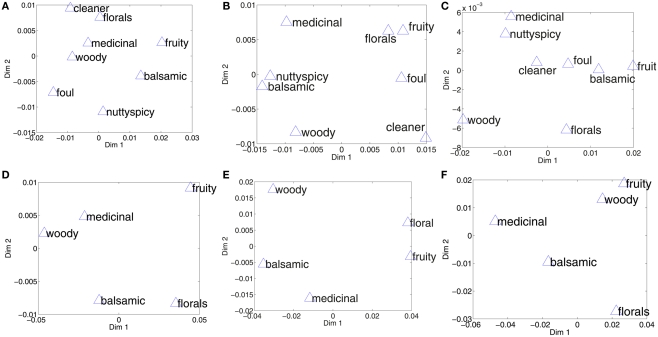
The organization of representations in the brain has been observed to locally reflect subspaces of inputs that are relevant to behavioral or perceptual feature combinations, such as in areas receptive to lower and higher-order features in the visual system. The early olfactory system developed highly plastic mechanisms and convergent evidence indicates that projections from primary neurons converge onto the glomerular level of the olfactory bulb (OB) to form a code composed of continuous spatial zones that are differentially active for particular physico-chemical feature combinations, some of which are known to trigger behavioral responses. In a model study of the early human olfactory system, we derive a glomerular organization based on a set of real-world, biologically relevant stimuli, a distribution of receptors that respond each to a set of odorants of similar ranges of molecular properties, and a mechanism of axon guidance based on activity. Apart from demonstrating activity-dependent glomeruli formation and reproducing the relationship of glomerular recruitment with concentration, it is shown that glomerular responses reflect similarities of human odor category perceptions and that further, a spatial code provides a better correlation than a distributed population code. These results are consistent with evidence of functional compartmentalization in the OB and could suggest a function for the bulb in encoding of perceptual dimensions.

Keywords: axonal guidance; glomeruli; odor category; olfaction; olfactory bulb; olfactory coding; perception; plasticity.


Figures

Figure 1
Figure 1
Schematic of the early olfactory system including the olfactory epithelium and bulb. Each ORN expresses one OR which responds to different odorants (see Figure 2). In the first step of the sensory pathway, odorant molecules bind to ORs in the olfactory cilium which activate ORNs in the epithelium which in turn transduce the input signal into action potentials. ORNs expressing the same OR generally project to the same glomerulus (Bozza et al., ; Mombaerts, 2004) and connect to the principal neurons of the OB, the mitral, and tufted cells (MT cells). These principal neurons forward their output to higher-order brain regions. Bulbar interneurons, granule cells (not shown) receive lateral inhibition and feedback from piriform cortex (Haberly and Price, 1977). The colors and symbols indicate molecular features of odorants and a chemotopic convergence from ORN axons to glomeruli. According to odotope theory (Shepherd, ; Mori, 1995), individual MT cells transmit information about a range of odor molecules with related molecular structures (so called odotopes). Cleland et al. (2007) and Johnson and Leon (2000) argued that qualitative odor perception is determined by glomerular activity patterns. They described also that different glomerular activity patterns, elicited, e.g., by increased concentration can lead to qualitatively different odor percepts.
Figure 2
Figure 2
Olfactory receptor-odorant affinity matrix. In total, 384 ORs were generated with graded affinity to each of the 447 odorants. Shown is a subset of 60 ORs and the 30 odorants to which these ORs have the highest affinity. Affinity is indicated by the radii of the circles. Black circles stand for excitatory OR response, red circles stand for inhibitory responses.
Figure 3
Figure 3
Dose-responses of ORNs of different OR types (affinities) to a single ligand at linearly increasing concentrations. Compare to Eq. 2.
Figure 4
Figure 4
(A,B) Show a 3D visualization of the ORN layer organization before and after calculating the projection. The visualization was done based on the Visualization Toolkit (VTK) C++ libraries (Schroeder et al., 1996). ORNs of five OR families are highlighted by color. In (B) you can see how ORNs of a certain type (indicated by color) cluster together. Subfigure (C) is an illustration of how olfactory axons project from epithelium (bottom) to glomeruli (top) in a small network consisting of five OR types and five ORNs per type. Colors indicate OR identity.
Figure 5
Figure 5
Glomerular activations at three different concentrations. (A) shows glomerular responses at a low concentration, (B) at a medium concentration, and (C) at a high concentration. Plots are shown in two dimensions for clearer illustration (the actual space is in three dimensions). The color map starts from dark blue for small activations and includes shades of blue, cyan, green, yellow, and red, and ends with dark red for high values. At low concentration few glomeruli are activated (indicated by red). As concentration increases more glomeruli are activated, until the glomerular map becomes very unspecific and saturated.
Figure 6
Figure 6
Perceptual spaces constructed from pair-wise distances reduced to two dimensions by multi-dimensional scaling. (A) Shows the perceptual space in Chrea (2004), as per Zarzo (2008). (B) Shows the space as given by the distances from spatial encodings. (C) Shows the space as given by distances between activations of the entire glomerular layer, independent of spatial arrangement of glomeruli. The lower panel compares the perceptual space, (D) for the BH small data set, and the distances between the categories in the spatial encoding, (E), and the population encoding, (F).

Similar articles

Cited by

References

    1. Abbott L. F., Luo S. X. (2007). A step toward optimal coding in olfaction. Nat. Neurosci. 10, 1342–1343 - PubMed
    1. Acree T., Arn H. (1998). “Flavornet: a database of aroma compounds based on odor potency in natural products,” in Food Flavors: Formation, Analysis and Packaging Influences, Proceedings of the 9th International Flavor Conference The George Charalambous Memorial Symposium, Vol. 40, eds Contis E., Ho C.-T., Mussinan C., Parliment T., Shahidi F., Spanie A. (Amsterdam: Elsevier Science), 27
    1. Adam Y., Mizrahi A. (2010). Circuit formation and maintenance – perspectives from the mammalian olfactory bulb. Curr. Opin. Neurobiol. 20, 134–140 - PubMed
    1. Aloni R., Olender T., Lancet D. (2006). Ancient genomic architecture for mammalian olfactory receptor clusters. Genome Biol. 7, R88. - PMC - PubMed
    1. Alt H., Knauer C., Wenk C. (2003). Comparison of distance measures for planar curves. Algorithmica 38, 45–5810.1007/s00453-003-1042-5 - DOI