. 2011 Oct 11:2:70.
doi: 10.3389/fphys.2011.00070. eCollection 2011.

Measurement of calcium dissociation rates from troponin C in rigor skeletal myofibrils

Affiliations

Measurement of calcium dissociation rates from troponin C in rigor skeletal myofibrils

Sean C Little et al. Front Physiol. .

Abstract

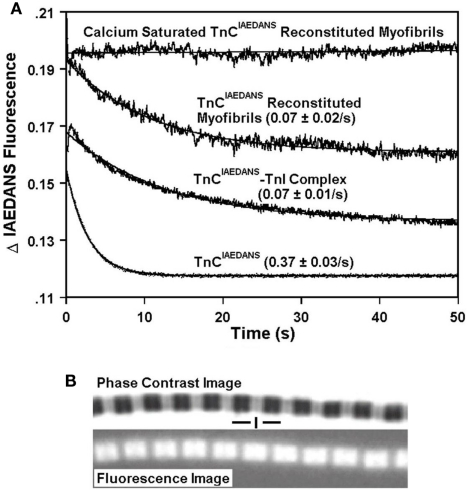
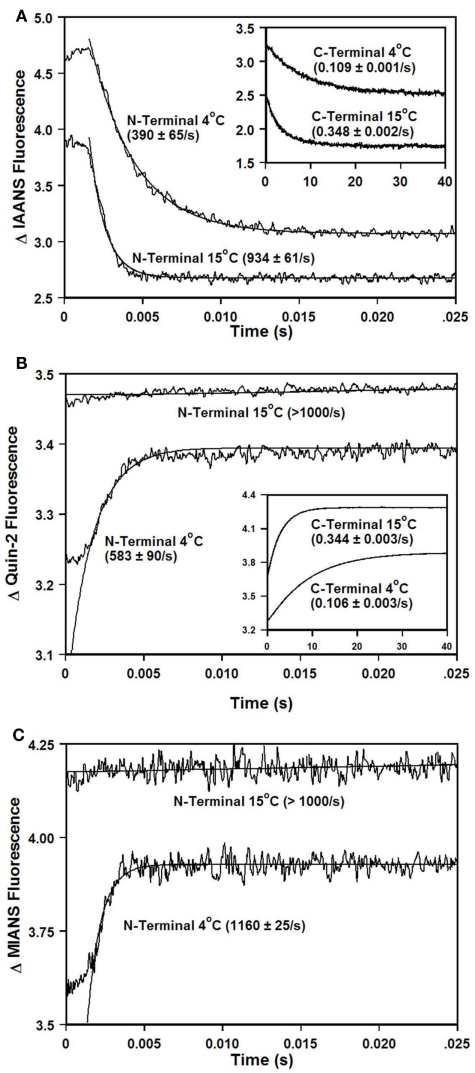
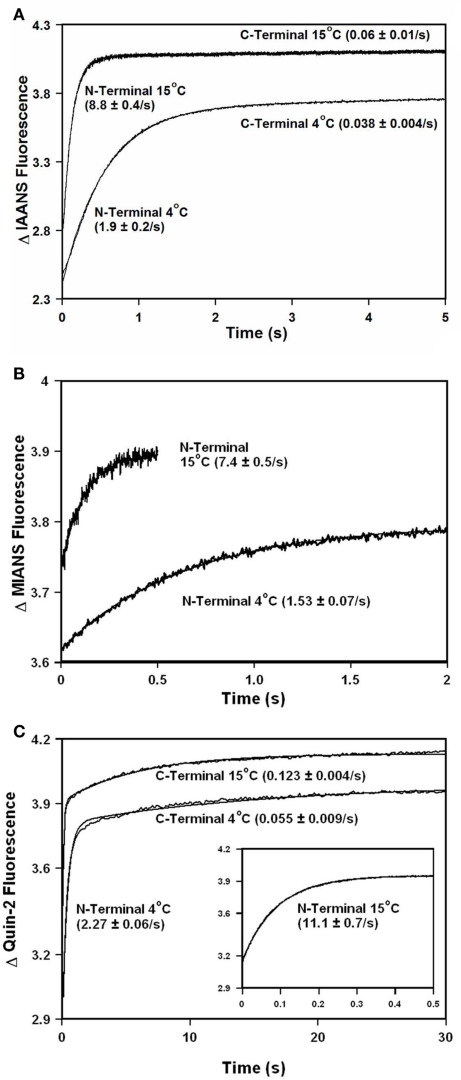
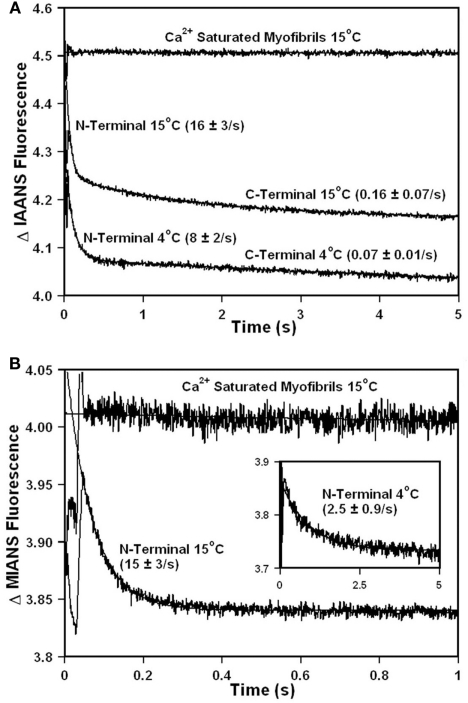
Ca2+ dissociation from the regulatory domain of troponin C may influence the rate of striated muscle relaxation. However, Ca(2+) dissociation from troponin C has not been measured within the geometric and stoichiometric constraints of the muscle fiber. Here we report the rates of Ca(2+) dissociation from the N-terminal regulatory and C-terminal structural domains of fluorescent troponin C constructs reconstituted into rabbit rigor psoas myofibrils using stopped-flow technology. Chicken skeletal troponin C fluorescently labeled at Cys 101, troponin C(IAEDANS), reported Ca(2+) dissociation exclusively from the structural domain of troponin C at ∼0.37, 0.06, and 0.07/s in isolation, in the presence of troponin I and in myofibrils at 15°C, respectively. Ca(2+) dissociation from the regulatory domain was observed utilizing fluorescently labeled troponin C containing the T54C and C101S mutations. Troponin [Formula: see text] reported Ca(2+) dissociation exclusively from the regulatory domain of troponin C at >1000, 8.8, and 15/s in isolation, in the presence of troponin I and in myofibrils at 15°C, respectively. Interestingly, troponin [Formula: see text] reported a biphasic fluorescence change upon Ca(2+) dissociation from the N- and C-terminal domains of troponin C with rates that were similar to those reported by troponin [Formula: see text] and troponin C(IAEDANS) at all levels of the troponin C systems. Furthermore, the rate of Ca(2+) dissociation from troponin C in the myofibrils was similar to the rate of Ca(2+) dissociation measured from the troponin C-troponin I complexes. Since the rate of Ca(2+) dissociation from the regulatory domain of TnC in myofibrils is similar to the rate of skeletal muscle relaxation, Ca(2+) dissociation from troponin C may influence relaxation.

Keywords: calcium; dissociation; muscle; myofibril; relaxation; skeletal; troponin.


Figures

Figure 1
Figure 1
Characterization of the Ca2+ dissociation rates from TnCIAEDANS in isolation, in the presence of TnI and in myofibrils. (A) Shows the time course of decrease in IAEDANS fluorescence as Ca2+ was removed by EGTA from the C-terminal Ca2+-binding sites of TnCIAEDANS ± TnI and in reconstituted myofibrils. TnCIAEDANS (0.6 μM) ± TnI (1.2 μM) in 10 mM MOPS, 90 mM KCl, 1 mM Mg2+, 1 mM DTT at pH 7.0 plus 200 μM Ca2+ was rapidly mixed with an equal volume of the same buffer plus 10 mM EGTA at 15°C. Similar experiments were performed with ∼1 mg/ml reconstituted myofibrils except the buffer also contained 0.02% Tween-20. The flat line represents the fluorescence level of Ca2+ saturated myofibrils in which EGTA in the second syringe was replaced with 200 μM Ca2+. IAEDANS emission fluorescence was monitored through a 420- to 470-nm band-pass filter with excitation at 340 nm. The TnCIAEDANS and TnCIAEDANS–TnI complex traces have been normalized to that of the TnCIAEDANS reconstituted myofibrils trace and staggered for visual clarity. (B) Shows the phase contrast (top panel) and IAEDANS fluorescence (bottom panel) images obtained from a representative rigor psoas myofibril reconstituted with TnCIAEDANS. The vertical line designates the location of the Z-line, and the horizontal lines designate the location of the A bands.
Figure 2
Figure 2
Calcium binding to TnCIAANST54C,C101S±TnI. (A) Shows a helical representation of apo TnC and Ca2+ saturated TnC ± TnI with T54 depicted in space fill format. The Protein Data Bank files utilized for this figure were 1TOP (apo TnC; Satyshur et al., 1994), 2TN4 (Ca2+–TnC; Houdusse et al., 1997), and 1YTZ (Ca2+–TnC–TnI, TnT is not shown for clarity; Vinogradova et al., 2005) and were rendered using Rasmol (Sayle and Milner-White, 1995). (B) Shows the Ca2+ dependent increase and decrease in IAANS fluorescence for TnCIAANST54C,C101S (●) and the Ca2+ dependent decrease in MIANS fluorescence for TnCMIANST54C,C101S (□) as a function of pCa. TnCIAANST54C,C101S fluorescence was fit with the sum of two independent Hill equations. (C) Shows the Ca2+ dependent decrease in IAANS and MIANS fluorescence for the TnCIAANST54C,C101S –TnI (●) and TnCMIANST54C,C101S –TnI (□) complexes as a function of pCa. Microliter amounts of Ca2+ were added to the different fluorescent TnC constructs (0.6 μM) ± TnI (1.2 μM) in 200 mM MOPS, 90 mM KCl, 2 mM EGTA, 1 mM Mg2+, 1 mM DTT, pH 7.0, at 15°C. IAANS fluorescence emission was monitored at 450 nm with excitation at 330 nm, whereas MIANS fluorescence emission was monitored at 435 nm with excitation at 325 nm. Hundred percentage fluorescence corresponds to the highest fluorescent state whereas 0% fluorescence corresponds to the lowest fluorescent state of the two respective conditions (±TnI).
Figure 3
Figure 3
Comparison of the calcium dependence of skeletal muscle force generation by native and TnC reconstituted fibers. The Ca2+ dependence of isometric force generation in native (■ TnCEndog) single rabbit skinned psoas fibers is compared to that of fibers reconstituted with TnCT54C,C101S (●) or TnCIAANST54C,C101S (▲) as a function of pCa. The experimental conditions are described in “Experimental Procedures.” Each data point represents the mean ± SE from at least four separate fibers individually normalized and fit with a logistic sigmoid function mathematically equivalent to the Hill equation. The inset shows the phase contrast (top of paired panels) and IAANS or MIANS fluorescence (bottom of paired panels) images obtained from representative rigor psoas myofibrils reconstituted with TnCIAANST54C,C101S or TnCMIANST54C,C101S. The vertical lines designate the location of the Z-lines, and the horizontal lines designate the location of the A bands.
Figure 4
Figure 4
Comparison of calcium dissociation kinetics from isolated TnCIAANST54C,C101S, TnCT54C,C101S, andTnCMIANST54C,C101S. (A) Shows the time course of decrease in IAANS fluorescence as Ca2+ was removed by EGTA from the N-terminal regulatory and C-terminal structural [(A) inset] Ca2+-binding sites of TnCIAANST54C,C101S. TnCIAANST54C,C101S (0.6 μM) in 10 mM MOPS, 90 mM KCl, 1 mM Mg2+, 1 mM DTT at pH 7.0 plus 200 μM Ca2+ was rapidly mixed with an equal volume of the same buffer plus 10 mM EGTA at 4 and 15°C. IAANS emission fluorescence was monitored through a 420- to 470-nm band-pass filter with excitation at 330 nm. (B) Shows the time course of increase in Quin-2 fluorescence as Ca2+ was removed from the N-terminal regulatory and C-terminal structural [(B) inset] Ca2+-binding sites of TnCT54C,C101S by Quin-2. TnCT54C,C101S (6 μM) in 10 mM MOPS, 90 mM KCl, 1 mM Mg2+, 1 mM DTT at pH 7.0 plus 60 μM Ca2+ was rapidly mixed with an equal volume of the same buffer plus 150 μM Quin-2 at 4 and 15°C. Control experiments where Ca2+ (60 μM) was rapidly mixed with an equal volume of Quin-2 (150 μM) were flat lines. Quin-2 emission fluorescence was monitored through a 510-nm broad band-pass interference filter with excitation at 330 nm. (C) Shows the time course of increase in MIANS fluorescence as Ca2+ was removed by EGTA from the N-terminal regulatory Ca2+-binding sites of TnCMIANST54C,C101S. TnCMIANST54C,C101S (0.6 μM) in 10 mM MOPS, 90 mM KCl, 1 mM Mg2+, 1 mM DTT at pH 7.0 plus 200 μM Ca2+ was rapidly mixed with an equal volume of the same buffer plus 10 mM EGTA at 4 and 15°C. MIANS emission fluorescence was monitored through a 420- to 470-nm band-pass filter with excitation at 325 nm. The traces in (A) through (C) have been staggered for visual clarity.
Figure 5
Figure 5
Comparison of calcium dissociation kinetics from TnCIAANST54C,C101S, TnCMIANST54C,C101S, and TnCT54C,C101S in the presence of TnI. (A) Shows the time course of increase in IAANS fluorescence as Ca2+ was removed by EGTA from the N-terminal regulatory and C-terminal structural Ca2+-binding sites of the TnCIAANST54C,C101S –TnI complex. TnCIAANST54C,C101S (0.6 μM) plus TnI (1.2 μM) in 10 mM MOPS, 90 mM KCl, 1 mM Mg2+, 1 mM DTT at pH 7.0 plus 200 μM Ca2+ was rapidly mixed with an equal volume of the same buffer plus 10 mM EGTA at 4 and 15°C. IAANS emission fluorescence was monitored as described in the legend of Figure 4A. (B) Shows the time course of increase in MIANS fluorescence as Ca2+ was removed by EGTA from the N-terminal regulatory Ca2+-binding sites of the TnCMIANST54C,C101S –TnI complex. TnCMIANST54C,C101S (0.6 μM) plus TnI (1.2 μM) in 10 mM MOPS, 90 mM KCl, 1 mM Mg2+, 1 mM DTT at pH 7.0 plus 200 μM Ca2+ was rapidly mixed with an equal volume of the same buffer plus 10 mM EGTA at 4 and 15°C. MIANS emission fluorescence was monitored as described in the legend of Figure 4C. (C) Shows the time course of increase in Quin-2 fluorescence as Ca2+ was removed from the N-terminal regulatory [(C) inset shows expanded 15°C trace] and C-terminal structural Ca2+-binding sites of the TnCT54C,C101S–TnI complex by Quin-2. TnCT54C,C101S (6 μM) plus TnI (9 μM) in 10 mM MOPS, 90 mM KCl, 1 mM Mg2+, 1 mM DTT at pH 7.0 plus ∼30 μM Ca2+ was rapidly mixed with an equal volume of the same buffer plus 150 μM Quin-2 at 4 and 15°C. Control experiments where Ca2+ (30 μM) was rapidly mixed with an equal volume of Quin-2 (150 μM) were flat lines. Quin-2 emission fluorescence was monitored as described in the legend of Figure 4B. The traces in (A) through (C) have been staggered for visual clarity.
Figure 6
Figure 6
Comparison of calcium dissociation kinetics from TnCIAANST54C,C101SandTnCMIANST54C,C101S reconstituted myofibrils. (A) Shows the time course of decrease in IAANS fluorescence as Ca2+ was removed by EGTA from the N-terminal regulatory and C-terminal structural Ca2+-binding sites of TnCIAANST54C,C101S reconstituted rigor rabbit psoas myofibrils. ∼1 mg/ml TnCIAANST54C,C101S reconstituted myofibrils in 10 mM MOPS, 90 mM KCl, 1 mM Mg2+, 1 mM DTT, 0.02% Tween-20 at pH 7.0 plus 200 μM Ca2+ was rapidly mixed with an equal volume of the same buffer plus 10 mM EGTA at 4 and 15°C. The flat line represents the 15°C fluorescence level of Ca2+ saturated myofibrils in which EGTA in the second syringe was replaced with 200 μM Ca2+. IAANS emission fluorescence was monitored as described in the legend of Figure 4A. (B) Shows the time course of decrease in MIANS fluorescence as Ca2+ was removed by EGTA from the N-terminal regulatory Ca2+-binding sites of TnCMIANST54C,C101S reconstituted rigor rabbit psoas myofibrils. ∼1 mg/ml TnCMIANST54C,C101S reconstituted myofibrils in 10 mM MOPS, 90 mM KCl, 1 mM Mg2+, 1 mM DTT, 0.02% Tween-20 at pH 7.0 plus 200 μM Ca2+ was rapidly mixed with an equal volume of the same buffer plus 10 mM EGTA at 4 [(B) inset] and 15°C. MIANS emission fluorescence was monitored as described in the legend of Figure 4C. The 4°C trace in (A) has been staggered for visual clarity.

Similar articles

Cited by

References

    1. Baylor S. M., Hollingworth S., Chandler W. K. (2002). Comparison of simulated and measured calcium sparks in intact skeletal muscle fibers of the frog. J. Gen. Physiol. 120, 349–36810.1085/jgp.20028620 - DOI - PMC - PubMed
    1. Cantino M. E., Allen T. S., Gordon A. M. (1993). Subsarcomeric distribution of calcium in demembranated fibers of rabbit psoas muscle. Biophys. J. 64, 211–22210.1016/S0006-3495(93)81358-4 - DOI - PMC - PubMed
    1. Cantino M. E., Eichen J. G., Daniels S. B. (1998). Distributions of calcium in A and I bands of skinned vertebrate muscle fibers stretched to beyond filament overlap. Biophys. J. 75, 948–95610.1016/S0006-3495(98)77583-6 - DOI - PMC - PubMed
    1. Davis J. P., Rall J. A., Alionte C., Tikunova S. B. (2004). Mutations of hydrophobic residues in the N-terminal domain of troponin C affect calcium binding and exchange with the troponin C-troponin I96-148 complex and muscle force production. J. Biol. Chem. 279, 17348–1736010.1074/jbc.M410830200 - DOI - PubMed
    1. Davis J. P., Rall J. A., Reiser P. J., Smillie L. B., Tikunova S. B. (2002). Engineering competitive magnesium binding into the first EF-hand of skeletal troponin C. J. Biol. Chem. 277, 49716–4972610.1074/jbc.M208488200 - DOI - PubMed