Review
. 2011:2011:579840.
doi: 10.1155/2011/579840. Epub 2011 Oct 12.

A neural correlate of predicted and actual reward-value information in monkey pedunculopontine tegmental and dorsal raphe nucleus during saccade tasks

Affiliations
Review

A neural correlate of predicted and actual reward-value information in monkey pedunculopontine tegmental and dorsal raphe nucleus during saccade tasks

Ken-ichi Okada et al. Neural Plast. 2011.

Abstract

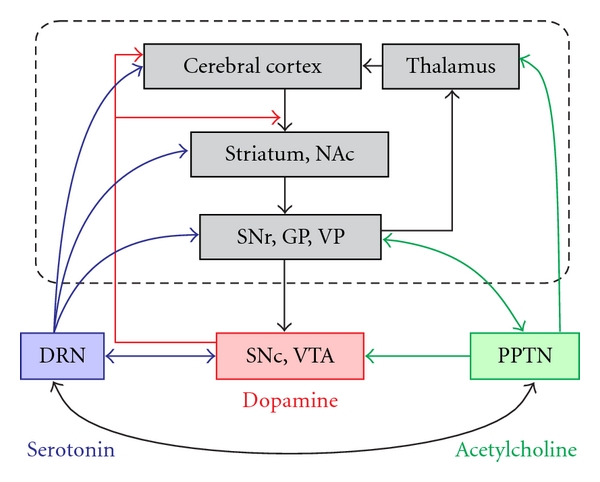
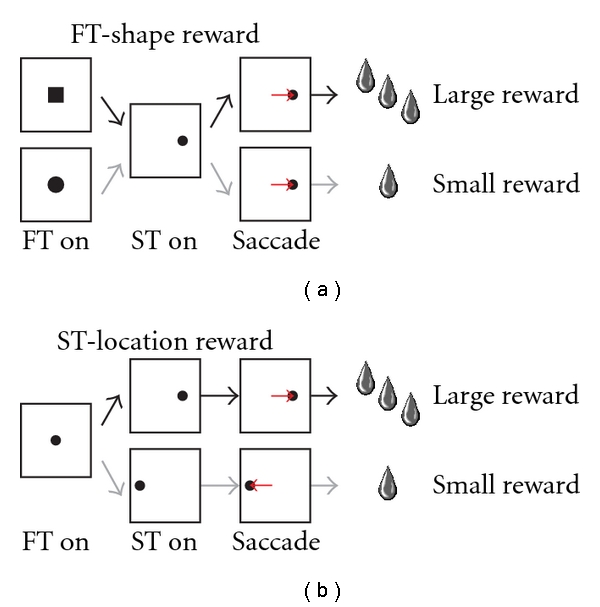
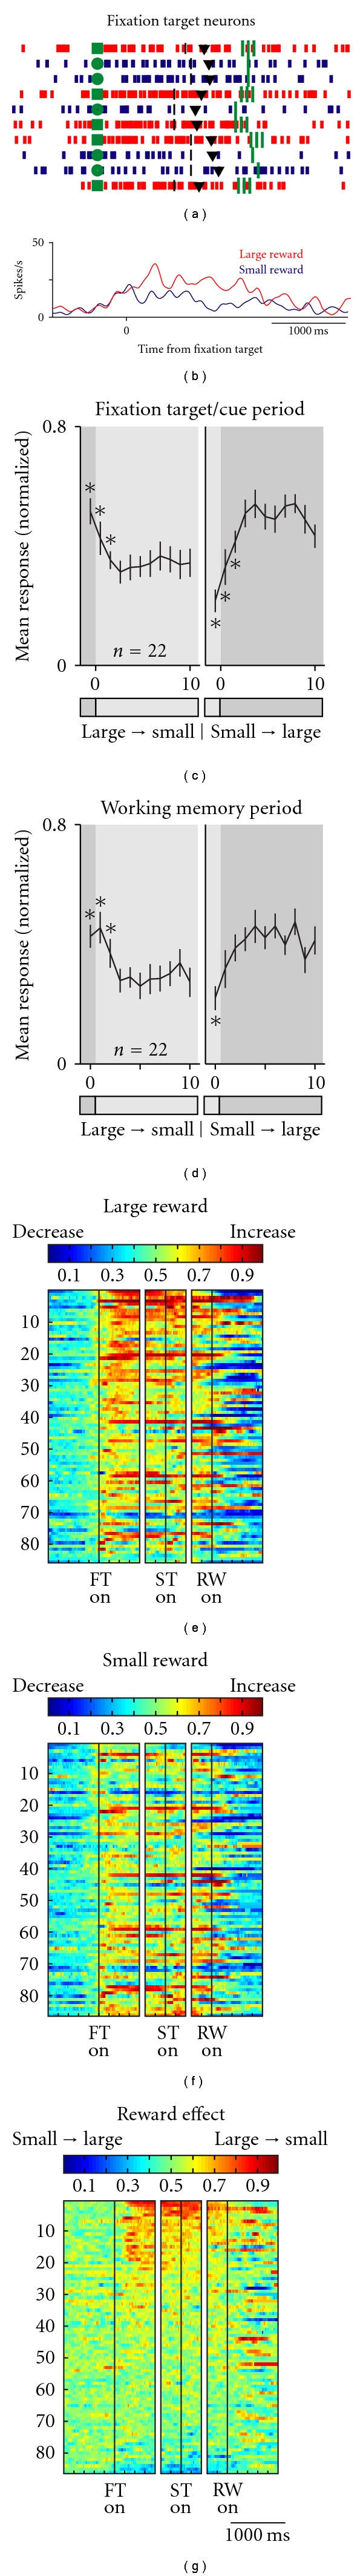
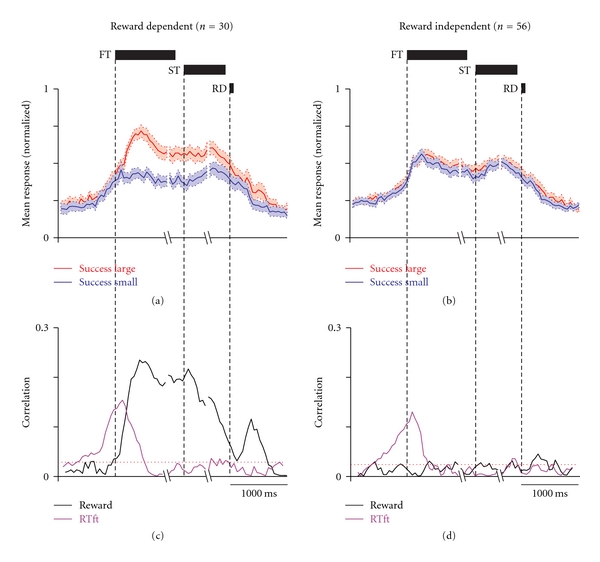
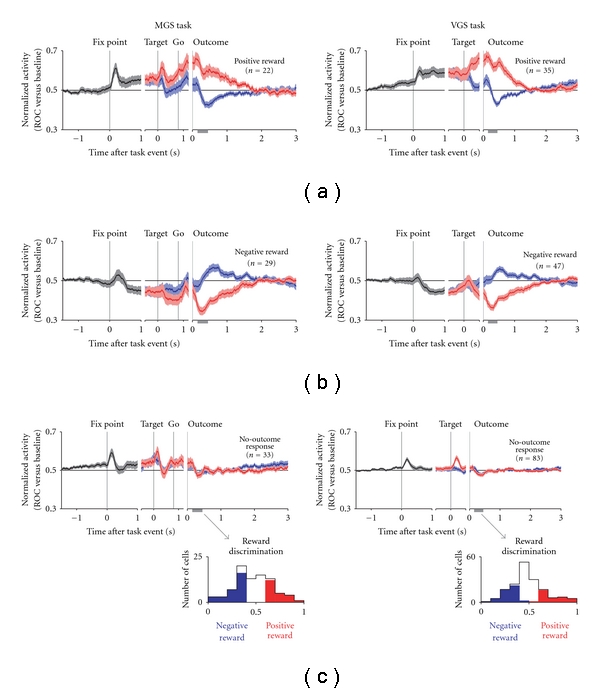
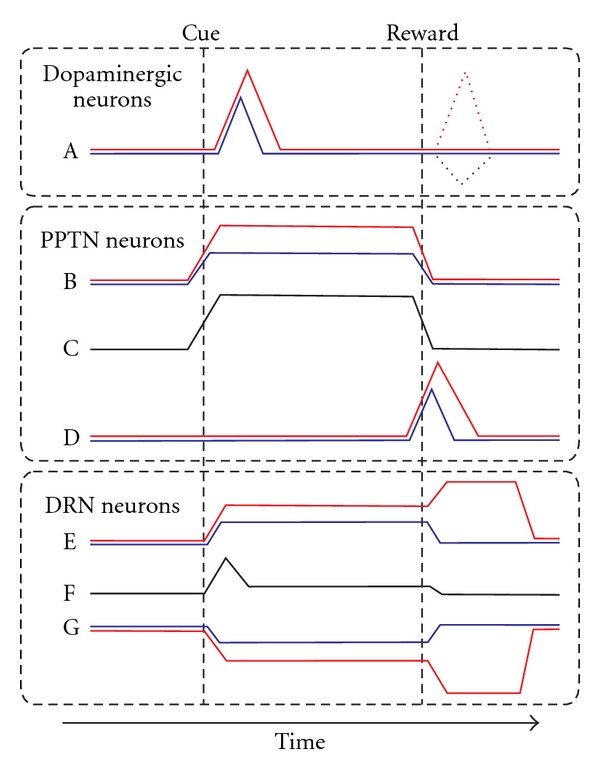
Dopamine, acetylcholine, and serotonin, the main modulators of the central nervous system, have been proposed to play important roles in the execution of movement, control of several forms of attentional behavior, and reinforcement learning. While the response pattern of midbrain dopaminergic neurons and its specific role in reinforcement learning have been revealed, the role of the other neuromodulators remains rather elusive. Here, we review our recent studies using extracellular recording from neurons in the pedunculopontine tegmental nucleus, where many cholinergic neurons exist, and the dorsal raphe nucleus, where many serotonergic neurons exist, while monkeys performed eye movement tasks to obtain different reward values. The firing patterns of these neurons are often tonic throughout the task period, while dopaminergic neurons exhibited a phasic activity pattern to the task event. The different modulation patterns, together with the activity of dopaminergic neurons, reveal dynamic information processing between these different neuromodulator systems.


Figures

Figure 1
Figure 1
Simplified cortico-basal ganglia circuitry with dopaminergic, cholinergic, and serotonergic innervation. The main cortico-basal ganglia circuit is highlighted by the dashed rectangle and the gray-shaded boxes. Midbrain dopaminergic neurons receive inhibitory input from basal ganglia nuclei and project to the striatum and cerebral cortices. The PPTN and DRN interact with dopaminergic neurons and basal ganglia nuclei. Here, we consider only the major routes by which the basal ganglia and neuromodulators are interconnected. NAc: nucleus accumbens, SNr: substantia nigra pars reticulate, GP: globus pallidus, VP: ventral pallidum, SNc: substantia nigra pars compacta, VTA: ventral tegmental area, DRN: dorsal raphe nucleus, PPTN: pedunculopontine tegmental nucleus.
Figure 2
Figure 2
Schematic diagrams for the two-valued reward saccade tasks. (a) The reward magnitude was cued by the shape of the initial central fixation target (square or circle) for recordings from PPTN neurons. (b) The location of the saccade target (left or right) was associated with large or small rewards, respectively, in recordings from DRN neurons. FT: fixation target, ST: saccade target.
Figure 3
Figure 3
Activity of fixation target neurons of the PPTN for the saccade task. (a, b) A rastergram and peritask event spike density function for the activity of a representative fixation target neuron over 10 successive trials, aligned to the onset of the fixation target. The red and blue rasters (a) and traces (b) indicate large and small reward trials, respectively. In (a), the green squares and circles indicate fixation target onset, the black bars indicate the onset of the saccade target, the black triangles indicate saccade onset, and the green lines indicate the times at which the large (3 bars) and small (1 bar) rewards were delivered. (c) Responses of fixation target neurons to fixation target (squares and circles) presentation (mean response of 200–600 ms after fixation target onset, fixation target/cue period) after reversal of cue-reward contingency. The left panel shows the large-to-small reward reversal, and the right panel shows the small-to-large reward reversal. Large-reward trials are indicated by the dark gray bars, while small-reward trials are indicated by the clear areas. Shown are the mean and standard error of the mean (SEM) of the normalized neuronal activity for the nth trial after contingency reversal. The asterisks (*) indicate the activity that was significantly different from the activity during the last 5 trials of the block with the reversed contingency (P < 0.01, Mann-Whitney U test). (d) Similar to (c) but for the responses after fixation target offset (working memory period, 200–600 ms after fixation target offset). (e–g) The activity of each fixation responsive neuron is presented as a row of pixels (n = 86). (e, f) Changes in the neuronal firing rate from baseline are compared in the large- (e) and small- (f) reward trials. The color of each pixel indicates the ROC value based on the comparison of the firing rate between a control period just before fixation onset (400-ms duration) and a test window centered on the pixel (100-ms duration). Warm colors (ROC > 0.5) indicate increases in the firing rate relative to the control period, whereas cool colors (ROC < 0.5) indicate decreases in the firing rate. (g) Changes in reward-dependent modulation. The ROC value of each pixel was based on the comparison of the firing rate between the large- and small-reward trials. Warm colors (ROC > 0.5) indicate higher firing rates in the large-reward trials than in the small ones. In these 3 panels (e–g), the neurons have been sorted in order of their ROC values for the reward prediction effect during the task period. FTon: fixation target onset; STon: saccade target onset; RWon: reward onset. (Modified from [42].)
Figure 4
Figure 4
Correlations between PPTN neuronal responses with reward value and task performance. (a, b) Population spike density function of reward magnitude-dependent (a) and -independent (b) fixation target-responsive neurons averaged for large- (red) and small- (blue) reward trials, aligned to fixation target onset, saccade target onset, and reward delivery. The spike density is the population average normalized for the peaks of the individual neurons. The thick lines indicate the mean normalized activity, and the light-shaded areas are ± 1 SEM. (c, d) Correlation coefficient (absolute value) plots of the neuronal responses shown in (a) and (b) with the reaction time to fixate upon the fixation target (purple) and the reward magnitude (black). The horizontal dotted red line indicates the significance level (P = 0.05) of the correlations. FT: fixation target, ST: saccade target, RD: reward delivery. (Modified from [42].)
Figure 5
Figure 5
Activity of reward delivery neurons of the PPTN for the saccade task. (a, b) A rastergram and peritask event spike density function for the activity of a representative reward delivery neuron over 10 successive trials, aligned to reward delivery. (c) Responses of the reward delivery neurons to reward delivery of large and small rewards after the reversal of cue-reward contingency. (d) Population response of reward delivery neurons to free (black) and large (red) rewards. The responses represent the average firing rate normalized for the peak responses of the individual neurons (n = 9). The thick lines indicate the mean normalized activity, and the light-shaded areas are ± 1 SEM. (e–g) The activity of each reward-responsive neuron is presented as a row of pixels (n = 35). (e, f) Changes in the neuronal firing rate from baseline are compared in the large- (e) and small- (f) reward trials. (g) Changes in reward-dependent modulation. In these 3 panels (e–g), the neurons have been sorted in order of their ROC values for the reward effect during the postreward delivery period. FTon: fixation target onset; STon: saccade target onset; RWon: reward onset. (Modified from [42].)
Figure 6
Figure 6
Activity of two example DRN neurons for the saccade task. For each neuron, (a) and (b), the rasters and histograms for the leftward and rightward saccades are shown separately. The changes in their firing rates are shown by the peritask event spike density function at the top. The activity in the large- and small-reward trials is shown in red and blue, respectively. The data are shown in 3 sections: the left section is aligned to the time of fixation point onset (FPon), the middle section is aligned to target onset (TGon) and fixation point offset (FPoff), and the right section is aligned to reward onset (RWon). Note that the reward offset (RWoff) applies only to the large-reward trials. The black dots indicate saccade onset (SACon), and the light blue dots indicate reward onset and offset. (Modified from [44].)
Figure 7
Figure 7
Population activity of DRN neurons. The activity of each neuron is presented as a row of pixels (n = 84). (a, b) Changes in the neuronal firing rate from baseline are compared in the large- (a) and small- (b) reward trials. The color of each pixel indicates the ROC value based on the comparison of the firing rate between a control period just before fixation onset (400-ms duration) and a test window centered on the pixel (100-ms duration). Warm colors (ROC > 0.5) indicate increases in the firing rate relative to the control period, whereas cool colors (ROC < 0.5) indicate decreases in the firing rate. (c) Changes in reward-dependent modulation. The ROC value of each pixel was based on the comparison of the firing rate between the large- and small-reward trials. Warm colors (ROC > 0.5) indicate higher firing rates during the large-reward trials than during the small ones. In all panels (a–c), the neurons have been sorted in order of their ROC values for the reward effect during the postreward (400–800 ms) period (c). FPon: fixation point onset, TGon: target onset, FPoff: fixation point offset, RWon and off: reward onset and offset. (Modified from [44].)
Figure 8
Figure 8
Changes in the reaction times and activity of DRN and putative dopaminergic neurons with reward contingency reversal. The reaction times (a) and normalized neuronal activity during the postreward period of DRN (400–800 ms after reward onset) and putative dopaminergic neurons (0–400 ms after reward onset) are plotted. In (b), the data are shown for DRN neurons with a large-reward preference (left), DRN neurons with a small-reward preference (middle), and putative dopaminergic neurons (right). Error bars, SEM. (Modified from [44].)
Figure 9
Figure 9
Population-averaged activity of DRN neurons separated by their reward signals in response to the outcome. (a–c) Normalized activity is shown for the memory-guided saccade task (MGS, left) and visually-guided saccade task (VGS, right), shown separately for positive-reward neurons (a, top), negative-reward neurons (b, middle), and no-outcome response neurons (c, bottom). The colors indicate the average of all trials (black), large-reward trials (red), and small-reward trials (blue). The neurons were sorted into these categories on the basis of significant reward discrimination after outcome onset (gray bar on the x-axis; P < 0.05, Wilcoxon rank-sum test). The histograms below (c) show the reward discrimination for each neuron, with the colors indicating positive-reward neurons (red) and negative-reward neurons (blue). For the plots of normalized activity, the activity of each neuron was normalized by computing its ROC area versus baseline activity during the intertrial interval. The thick lines indicate the mean normalized activity, and the light shaded areas are ±1 SEM. (Modified from [45].)
Figure 10
Figure 10
Schematic drawing of the activity changes of dopaminergic, PPTN, and DRN neurons for the two-valued saccade task. Cue and reward indicate the timing of reward-cue presentation (either fixation target shape or saccade target location) and large- and small-reward delivery, respectively. The colors indicate the responses in the large-reward trials (red) and small-reward trials (blue) and the responses of neurons with no significant reward modulation (black). (A) Dopaminergic neurons exhibited phasic burst firing to a reward-predictive cue and an unexpected reward (dashed lines). (B, D) Two different groups of PPTN neurons exhibited a tonic reward prediction response (B) and a phasic actual reward response (D). (C) PPTN neurons with no significant reward modulation often exhibited tonic activity during the task period. (E, G) DRN neurons exhibited correlated central fixation and reward modulation, preferring either larger (E) or smaller rewards (G). (F) DRN neurons with no significant reward modulation often exhibited a phasic response to target presentation.

Similar articles

Cited by

References

    1. Waelti P, Dickinson A, Schultz W. Dopamine responses comply with basic assumptions of formal learning theory. Nature. 2001;412(6842):43–48. - PubMed
    1. Richmond BJ, Liu Z, Shidara M. Neuroscience. Predicting future rewards. Science. 2003;301(5630):179–180. - PubMed
    1. Satoh T, Nakai S, Sato T, Kimura M. Correlated coding of motivation and outcome of decision by dopamine neurons. Journal of Neuroscience. 2003;23(30):9913–9923. - PMC - PubMed
    1. Samejima K, Ueda Y, Doya K, Kimura M. Representation of action-specific reward values in the striatum. Science. 2005;310(5752):1337–1340. - PubMed
    1. Graybiel AM. The basal ganglia: learning new tricks and loving it. Current Opinion in Neurobiology. 2005;15(6):638–644. - PubMed

Publication types

LinkOut - more resources