

Double blockade of angiotensin II (AT(1) )-receptors and ACE does not improve weight gain and glucose homeostasis better than single-drug treatments in obese rats
- PMID: 22014027
- PMCID: PMC3423257
- DOI: 10.1111/j.1476-5381.2011.01726.x
Double blockade of angiotensin II (AT(1) )-receptors and ACE does not improve weight gain and glucose homeostasis better than single-drug treatments in obese rats
Abstract
Background and purpose: Combination therapies are becoming increasingly important for the treatment of high blood pressure. Little is known about whether double blockade of angiotensin II (AT(1) ) receptors and angiotensin-converting enzyme (ACE) exert synergistic metabolic effects.
Experimental approach: Spontaneously hypertensive rats were allowed to choose between palatable chocolate bars and standard chow and were simultaneously treated with the AT(1) blocker telmisartan (8 mg·kg(bw) (-1) ·day(-1) ), the ACE inhibitor ramipril (4 mg·kg(bw) (-1) ·day(-1) ) or a combination of the two (8 + 4 mg·kg(bw) (-1) ·day(-1) ) for 12 weeks.
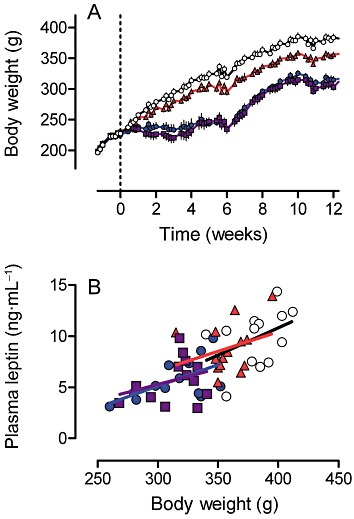
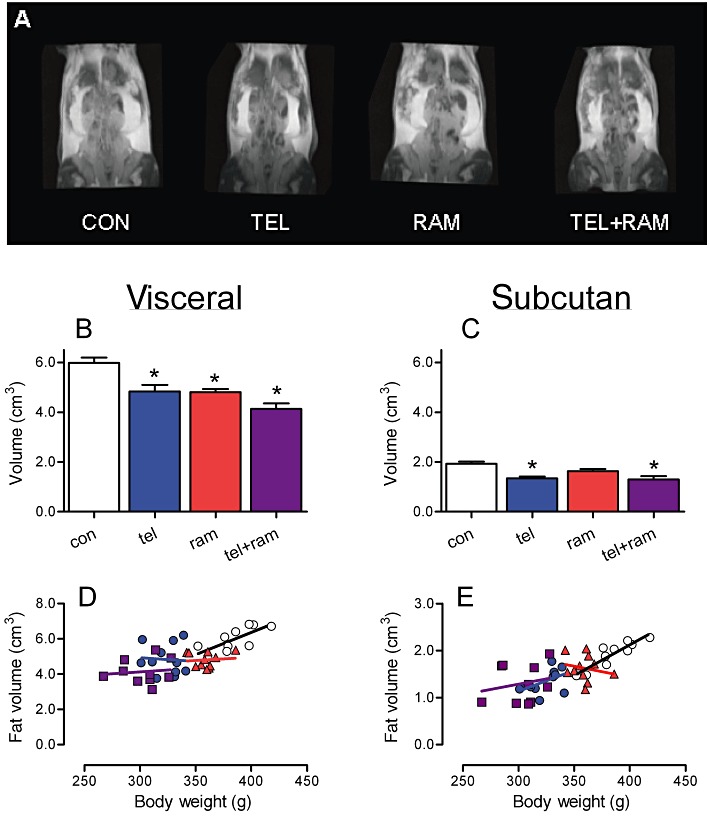
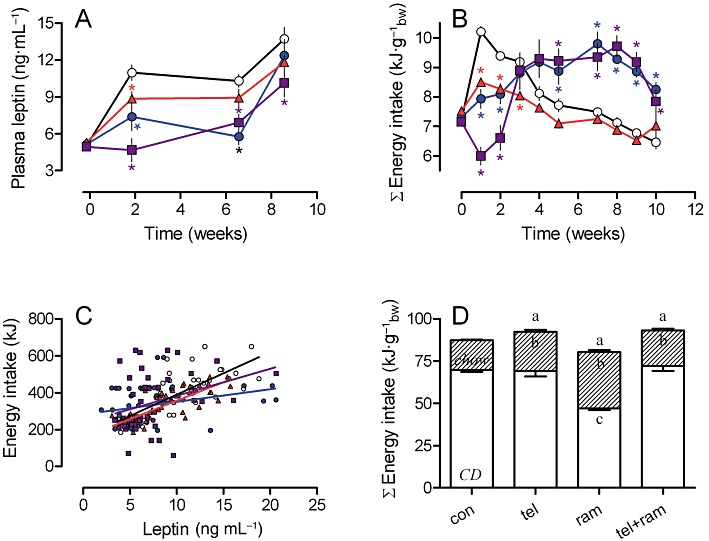
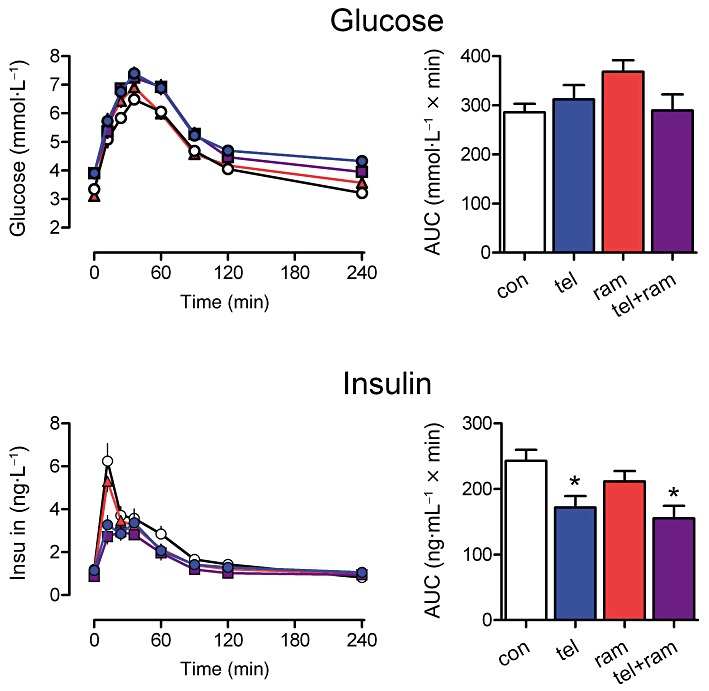
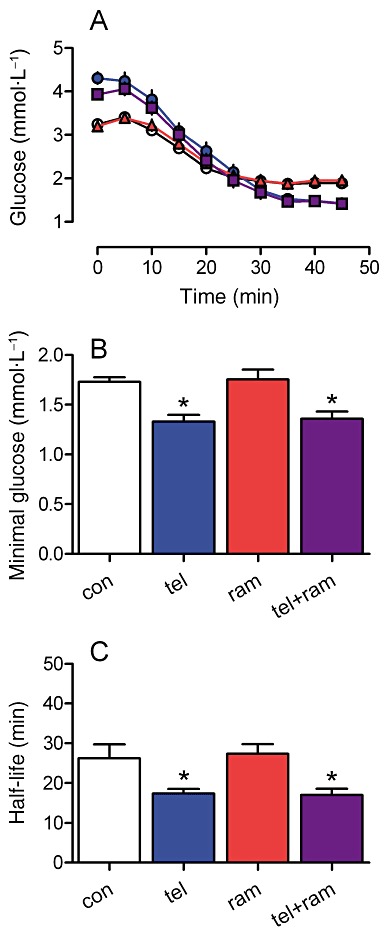
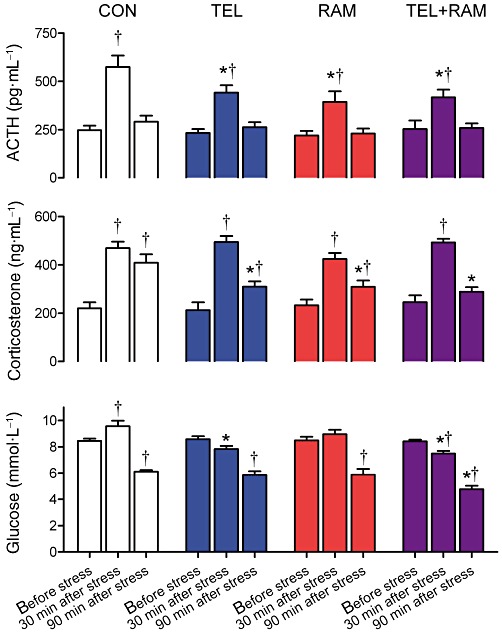
Key results: Although food-dependent energy intake was increased by telmisartan and telmisartan + ramipril compared with ramipril or controls, body weight gain, abundance of fat and plasma leptin levels were decreased. Increased insulin levels in response to an oral glucose tolerance test were comparably attenuated by telmisartan and telmisartan + ramipril, but not by ramipril. During an insulin tolerance test, glucose utilization was equally as effectively improved by telmisartan and telmisartan + ramipril. In response to a stress test, ACTH, corticosterone and glucose increased in controls. These stress reactions were attenuated by telmisartan and telmisartan + ramipril.
Conclusions and implications: The combination of telmisartan + ramipril was no more efficacious in regulating body weight and glucose homeostasis than telmisartan alone. However, telmisartan was more effective than ramipril in improving metabolic parameters and in reducing body weight. The association between the decrease in stress responses and the diminished glucose levels after stress supports our hypothesis that the ability of telmisartan, as an AT(1) receptor blocker, to alleviate stress reactions may contribute to its hypoglycaemic actions.
© 2011 The Authors. British Journal of Pharmacology © 2011 The British Pharmacological Society.
Figures
References
-
- Abou-Samra AB, Catt KJ, Aguilera G. Involvement of protein kinase C in the regulation of adrenocorticotropin release from rat anterior pituitary cells. Endocrinology. 1986;118:212–217. - PubMed
-
- Aguilera G, Kiss A, Luo X. Increased expression of type 1 angiotensin II receptors in the hypothalamic paraventricular nucleus following stress and glucocorticoid administration. J Neuroendocrinol. 1995;7:775–783. - PubMed
-
- Albiston AL, McDowall SG, Matsacos D, Sim P, Clune E, Mustafa T, et al. Evidence that the angiotensin IV (AT(4)) receptor is the enzyme insulin-regulated aminopeptidase. J Biol Chem. 2001;276:48623–48626. - PubMed
-
- Araki K, Masaki T, Katsuragi I, Tanaka K, Kakuma T, Yoshimatsu H. Telmisartan prevents obesity and increases the expression of uncoupling protein 1 in diet-induced obese mice. Hypertension. 2006;48:51–57. - PubMed
-
- Benndorf RA, Rudolph T, Appel D, Schwedhelm E, Maas R, Schulze F, et al. Telmisartan improves insulin sensitivity in nondiabetic patients with essential hypertension. Metabolism. 2006;55:1159–1164. - PubMed
Publication types
MeSH terms
Substances
LinkOut - more resources
Full Text Sources
Medical
Research Materials
Miscellaneous
