. 2011 Oct 20:11:456.
doi: 10.1186/1471-2407-11-456.

Effects of magnolol on UVB-induced skin cancer development in mice and its possible mechanism of action

Affiliations

Effects of magnolol on UVB-induced skin cancer development in mice and its possible mechanism of action

Chandeshwari Chilampalli et al. BMC Cancer. .

Abstract

Background: Magnolol, a plant lignan isolated from the bark and seed cones of Magnolia officinalis, has been shown to have chemopreventive effects on chemically-induced skin cancer development. The objectives of this investigation are to study the anticarcinogenic effects of magnolol on UVB-induced skin tumor development in SKH-1 mice, a model relevant to humans, and determine the possible role of apoptosis and cell cycle arrest involved in the skin tumor development.

Methods: UVB-induced skin carcinogenesis model in SKH-1 mice was used for determining the preventive effects of magnolol on skin cancer development. Western blottings and flow cytometric analysis were used to study the effects of magnolol on apoptosis and cell cycle.

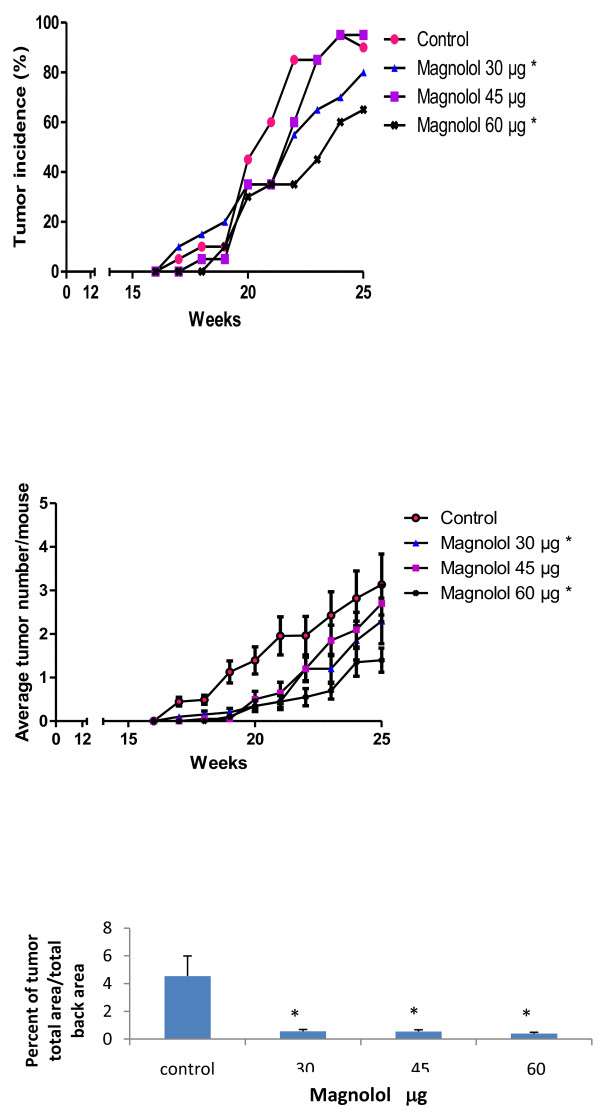
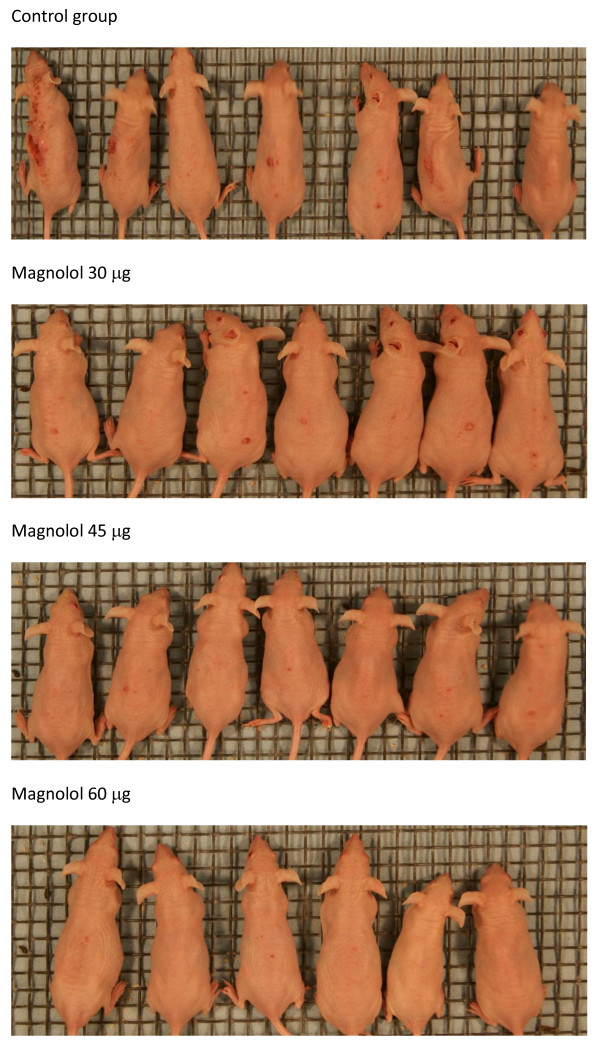
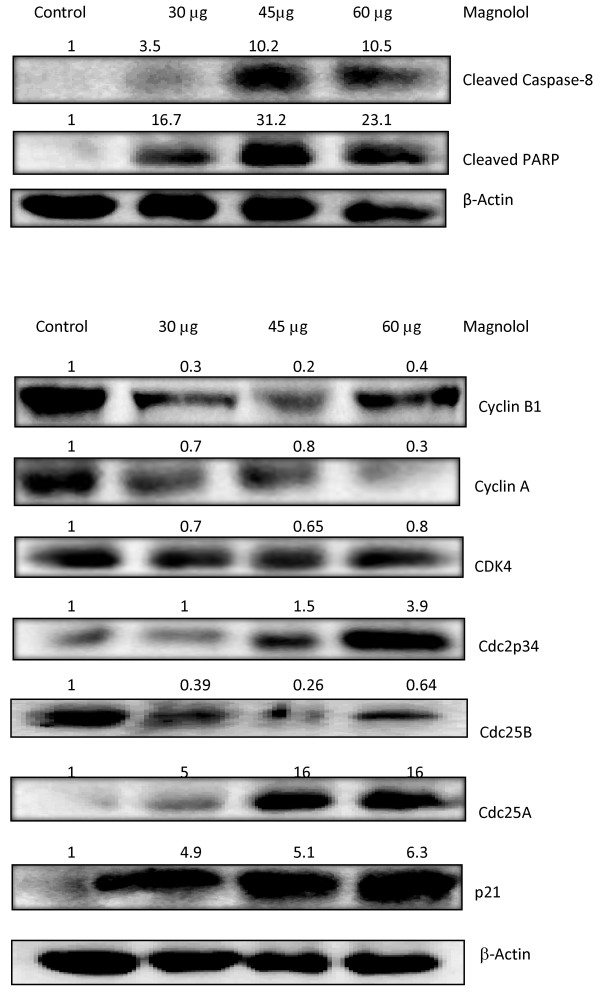
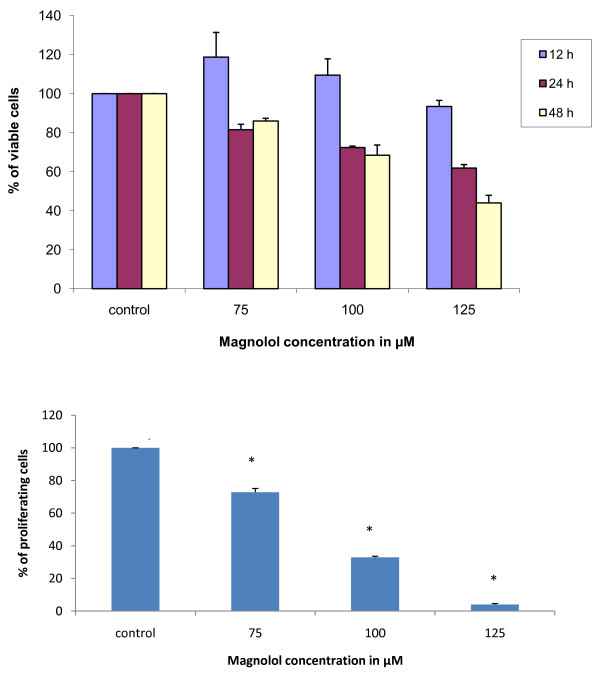
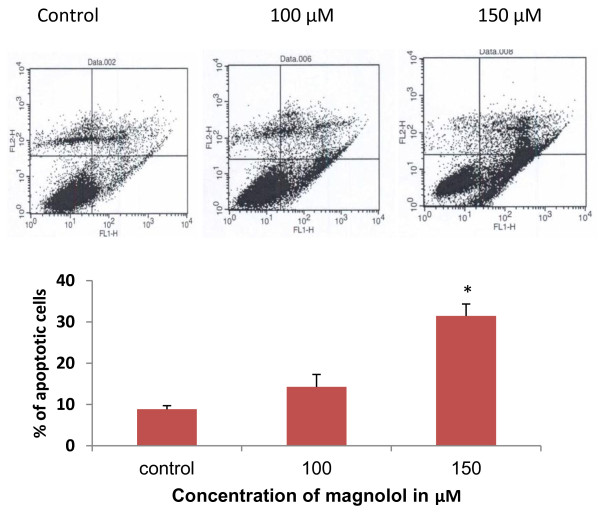
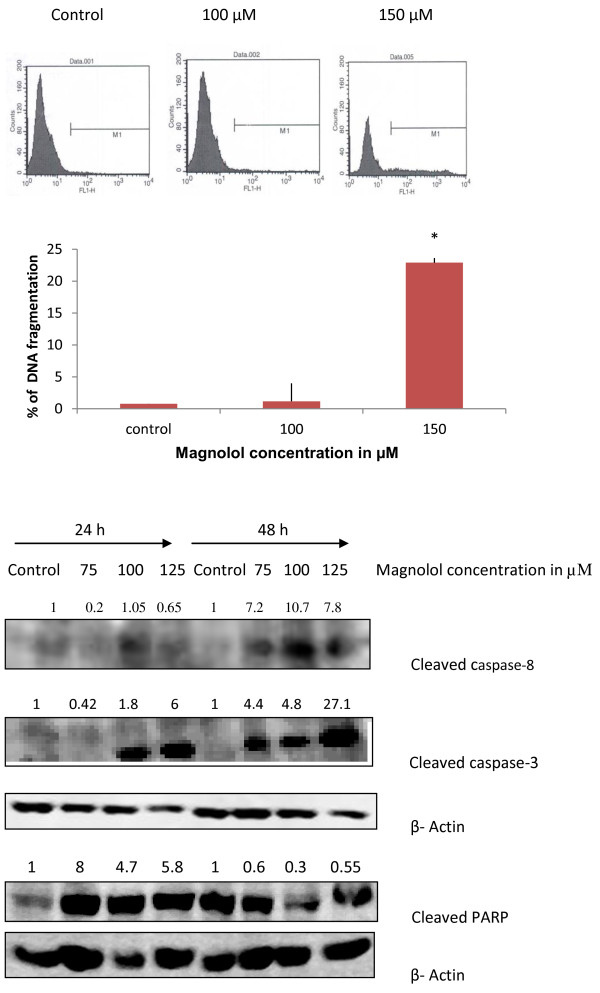
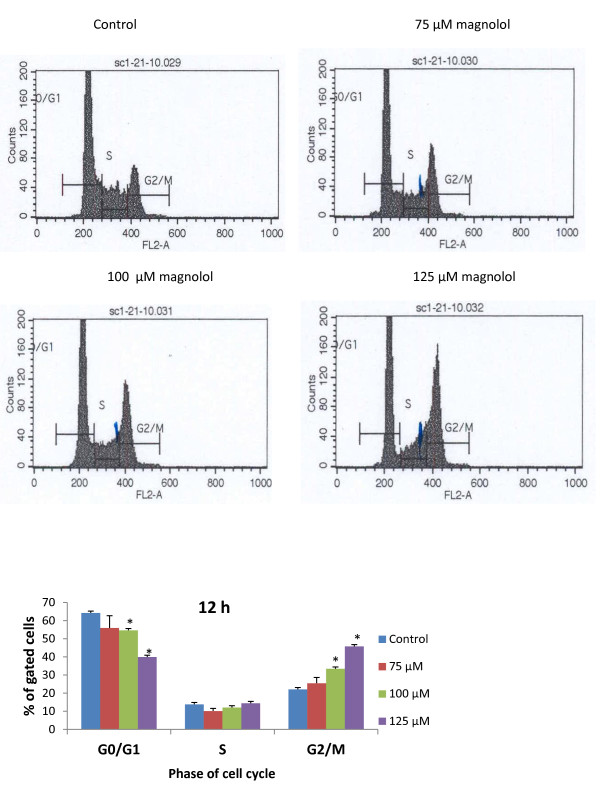
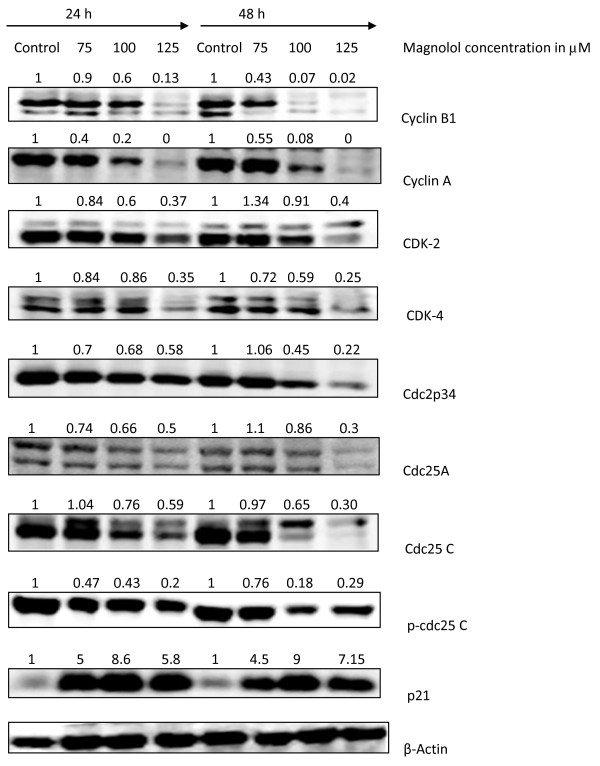
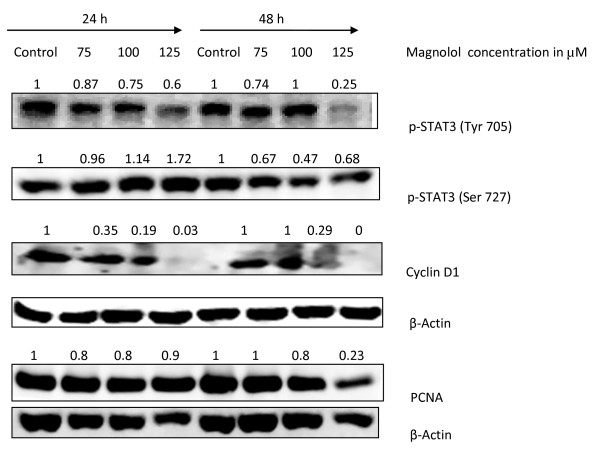
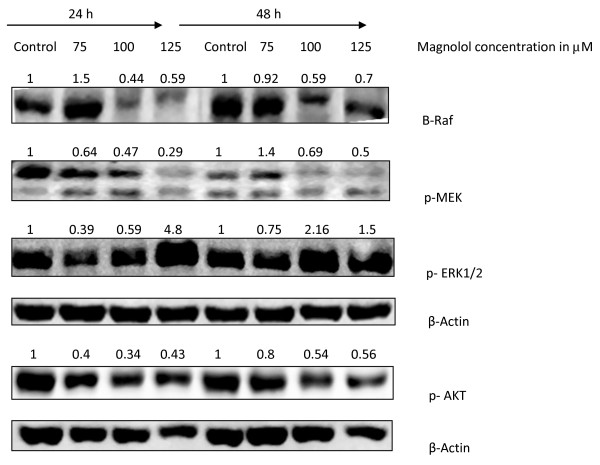
Results: Magnolol pretreated groups (30, 60 μ g) before UVB treatments (30 mJ/cm2, 5 days/week) resulted in 27-55% reduction in tumor multiplicity as compared to control group in SKH-1 mice. Magnolol pretreatment increased the cleavage of caspase-8 and poly-(-ADP-ribose) polymerase (PARP), increased the expression of p21, a cell cycle inhibitor, and decreased the expression of proteins involved in the G2/M phase of cell cycle in skin samples from SKH-1 mice.Treatment of A431 cells with magnolol decreased cell viability and cell proliferation in a concentration dependent manner. Magnolol induced G2/M phase cell cycle arrest in A431 cells at 12 h with a decreased expression of cell cycle proteins such as cyclin B1, cyclin A, CDK4, Cdc2 and simultaneous increase in the expression of Cip/p21, a cyclin-dependent kinase inhibitor. Magnolol induced apoptosis in vivo and in vitro with an increased cleavage of caspase-8 and PARP. Phospho-signal transducers and activators of transcription 3 (Tyr705), B-Raf, p-MEK, and p-AKT were down-regulated, whereas phosphorylation of ERK was induced by magnolol in A431 cells.

Conclusions: Magnolol pretreatments prevent UVB-induced skin cancer development by enhancing apoptosis, causing cell cycle arrest at G2/M phase, and affecting various signaling pathways. Magnolol could be a potentially safe and potent anticarcinogenic agent against skin cancer.


Figures

Figure 1
Figure 1
Effects of magnolol pretreatment on tumor incidence, tumor multiplicity and tumor area in UVB-induced skin carcinogenesis in SKH-1 mice. (A) Effects of topical magnolol pretreatment on tumor incidence. From the 20th week to the end of the experiment magnolol 30 μ g and 60 μ g reduced significantly tumor incidence. Each point represents the percentage of animals bearing at least one tumor, values derived from 20 mice. *Significant difference (p < 0.05). (B) Effects of magnolol pretreatment on tumor multiplicity. Magnolol 30 and 60 μ g pretreatment significantly decreased tumor multiplicities from the 16th to 25th week of UVB induced carcinogenesis. Each point represents mean number of tumors per mouse ± SE derived from 20 mice. *Significant difference (p < 0.05). (C) Effects of magnolol treatment on tumor area. Average ratio of total tumor area to total back area of the SKH-1 mice. Each bar represents mean ratio of tumor area per mouse ± SE derived from 20 mice.* Significant difference (p < 0.05)
Figure 2
Figure 2
Effects of magnolol treatment on UVB induced skin tumors in SKH-1 mice. Mice were exposed five days a week to 30 mJ/cm2 UVB one hour before different topical treatments. Control group (n = 20) was treated with 200 μ l of acetone. Treatment groups (n = 20 each) received 30, 45 or 60 μ g of magnolol dissolved in 200 μ l of acetone. Pictures were taken at the end of the 25th week. Animals were randomly chosen for the pictures.
Figure 3
Figure 3
Effects of magnolol on the expression and activation of proteins in UVB-induced photocarcinogenesis in SKH-1 mice. (A) Effects of magnolol on the cleavage of apoptotic proteins. Proteins were isolated from epidermal tissues of mice, lysates were prepared and subjected to Western blot analysis. β-actin was used to verify equal loading of the samples for each membrane. Bands are representative from three experiments. (B) Effects of magnolol pretreatment on the expression of cell cycle proteins. Proteins were extracted from the mice's back skin as mentioned in materials and methods. Lysates were subjected to Western blot analysis. β-actin was used as loading control. Bands are representative from three experiments.
Figure 4
Figure 4
Effects of magnolol on cell viability and cell proliferation in A431 cells. (A) Effects of magnolol on cell viability. A431 cells were treated with control media or magnolol (75-125 μM) for 12, 24 and 48 hours. At the end of the respective treatment MTT assay was performed. Values are expressed as mean ± SE of eight replicates in each treatment. (B) Effects of magnolol on cell proliferation in A431 cells. Cells were treated in similar conditions as described for MTT assay for 48 hours, and then BrdU incorporation assay was performed. Values are expressed as mean ± SE of three replicates in each treatment.
Figure 5
Figure 5
Effects of magnolol on apoptosis in A431 cells as assessed by annexin-V/PI staining. Cells were treated with magnolol (0-150 μM) for 48 h, at the end of the treatment adherent and non-adherent cells were collected and treated with annexin-V labeled with a fluorophore, which can identify apoptotic cells by binding to phosphatidylserine exposed on apoptotic cells; and with propidium iodide that stained dead cells. Dot plot of annexin-V (FL1-H)/PI (FL2-H) staining of A431 cells by flow cytometry. The lower right quadrant shows early apoptotic cells that are labeled with annexin-V, having green fluorescence. The upper right quadrant stained by annexin-V and PI indicates late apoptotic cells. The lower left quadrant contains viable cells which exclude PI and are negative for annexin-V staining, and the upper left quadrant are necrotic cells stained by PI only. The bar graph describes the percentages of apoptotic cells after each treatment. In each case data represent mean ± SE of three observations. *p < 0.05 indicates statistical significant difference in magnolol treated groups compared with the control.
Figure 6
Figure 6
Effects of magnolol on DNA fragmentation and activation of apoptotic proteins in A431 cells. (A) DNA fragmentation. Cells were treated with magnolol (0-150 μM) for 48 hours, at the end of the treatment, adherent and non-adherent cells were collected and subjected to TUNEL assay. The gate M1 includes the apoptotic cells with fragmented DNA, which were positive for green fluorescence. The bar graph indicates the percentages of apoptotic cells with fragmented DNA. In each case, data represents mean ± SE of three observations. *p < 0.05 indicates statistical significant difference in magnolol treated groups compared with the control. (B) Effects of magnolol on the activation of apoptotic proteins in A431 cells. Cells were treated with magnolol for 24 and 48 h, cells were then collected. Cell lysates were prepared and subjected to SDS-PAGE and Western blot analysis. Membranes were probed with appropriate antibodies. Pictures are representative from three experiments.
Figure 7
Figure 7
Effects of magnolol on the cell cycle phases distribution in A431 cells. (A) Cell cycle histograms. Cells were treated with magnolol (0, 75, 100 and 125 μM) for 12 h. At the end of the treatment, cells were harvested and digested with RNase. Cellular DNA was stained with propidium iodide and analyzed by flow cytometer as described in the Materials and Methods. (B) Data from the cell cycle distribution histograms were summarized into a bar graph and presented as the mean ± SE of three observations. *p < 0.05 indicates statistical significance in magnolol treated groups as compared to the control.
Figure 8
Figure 8
Effects of magnolol on the expression of cell cycle regulatory proteins in A431cells. Cells were treated with varying concentrations of magnolol (0, 75, 100, 125 μM) for 24 and 48 h and thereafter cell lysates were prepared. Total cell lysates were subjected to SDS-PAGE followed by Western blot analysis. β-actin was used to verify equal loading of samples
Figure 9
Figure 9
Effects of magnolol on STAT3 phosphorylation in A431 cells. Sub confluent cells were treated with 0, 75, 100 and 125 μM of magnolol for 24 and 48 h. At the end of each treatment, cells were harvested and total cell lysates were evaluated by Western blotting for phosphorylation of STAT3 (Tyr 705 and Ser 727), PCNA and cyclin D1. Protein loading was verified by reprobing membrane for β-Actin.
Figure 10
Figure 10
Effects of magnolol on B-Raf expression and MEK/ERK/AKT phosphorylation in A431 cells. Cells were treated with varying concentrations of magnolol (0-125 μM) for 24 and 48 h. Cells were harvested and total cell lysates were prepared at the end of each treatment and subjected to Western blot analysis for various proteins.

Similar articles

Cited by

References

    1. Rogers HW, Weinstock MA, Harris AR, Hinckley MR, Feldman SR, Fleischer AB, Coldiron BM. Incidence estimate of nonmelanoma skin cancer in the United States, 2006. Arch Dermatol. 2010;146:283–287. doi: 10.1001/archdermatol.2010.19. - DOI - PubMed
    1. Siegel R, Ward E, Brawley O, Jemal A. Cancer Statistics, 2011. CA Cancer J Clin. 2011;61:212–236. doi: 10.3322/caac.20121. - DOI - PubMed
    1. Kremer KH. Sunlight and skin cancer: Another link revealed. Proc Natl Acad Sci USA. 1997;95:11–14. - PMC - PubMed
    1. Lu YP, Lou YR, Yen P, Mitchell D, Huang MT, Conney AH. Time course for early adaptive responses to ultraviolet B light in the epidermis of SKH-1 mice. Cancer Res. 1999. pp. 4591–4602. - PubMed
    1. Katiyar SK, Korman NJ, Mukhtar H, Agarwal R. Protective effects of silymarin against photocarcinogenesis in a mouse skin model. J Natl Cancer Inst. 1997;89:556–566. doi: 10.1093/jnci/89.8.556. - DOI - PubMed

Publication types

MeSH terms