. 2011 Dec;82(5):1185-203.
doi: 10.1111/j.1365-2958.2011.07877.x. Epub 2011 Nov 7.

Quantitative proteomics reveals metabolic and pathogenic properties of Chlamydia trachomatis developmental forms

Affiliations

Quantitative proteomics reveals metabolic and pathogenic properties of Chlamydia trachomatis developmental forms

Hector A Saka et al. Mol Microbiol. 2011 Dec.

Abstract

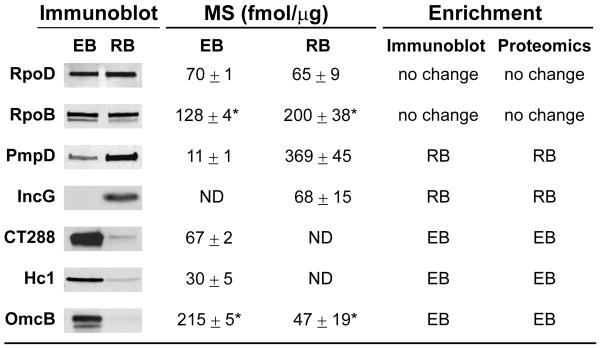
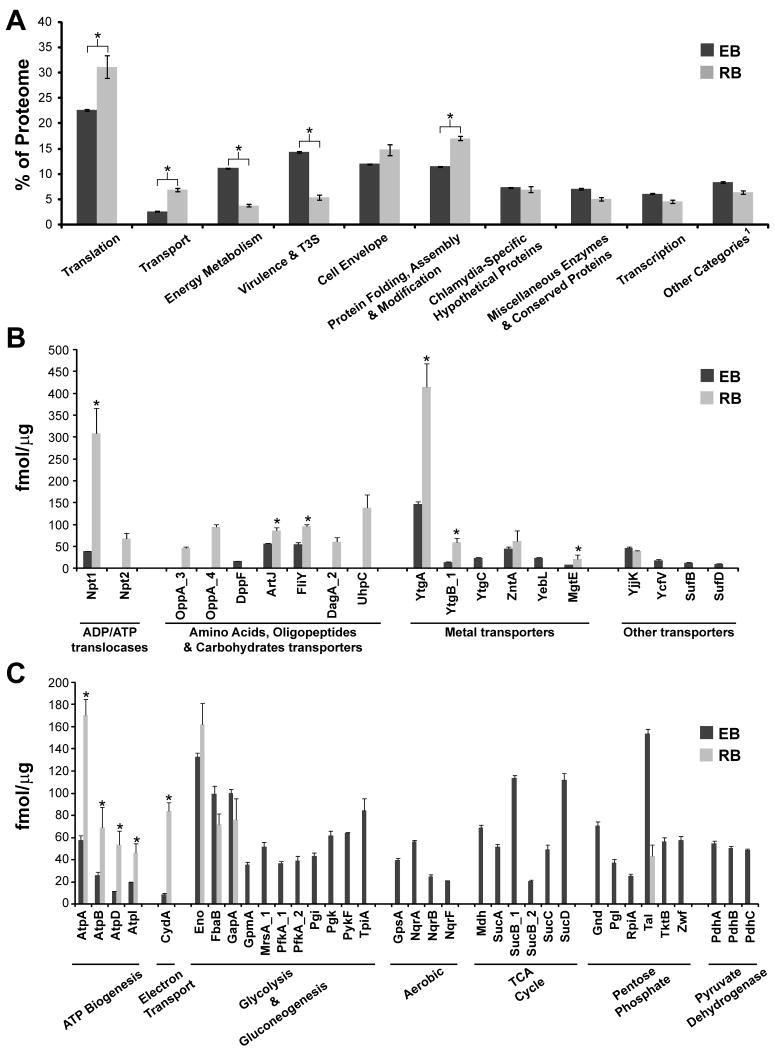
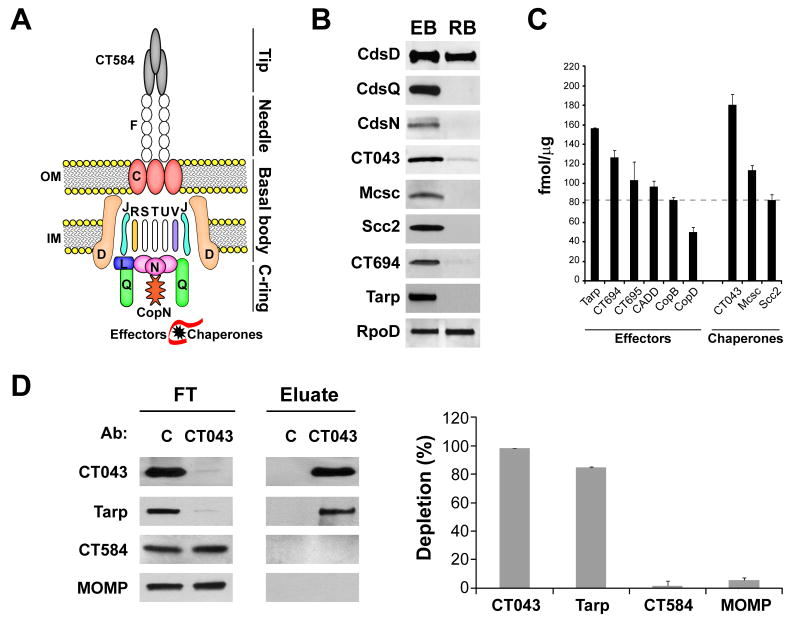
Chlamydia trachomatis is an obligate intracellular pathogen responsible for ocular and genital infections of significant public health importance. C. trachomatis undergoes a biphasic developmental cycle alternating between two distinct forms: the infectious elementary body (EB), and the replicative but non-infectious reticulate body (RB). The molecular basis for these developmental transitions and the metabolic properties of the EB and RB forms are poorly understood as these bacteria have traditionally been difficult to manipulate through classical genetic approaches. Using two-dimensional liquid chromatography - tandem mass spectrometry (LC/LC-MS/MS) we performed a large-scale, label-free quantitative proteomic analysis of C. trachomatis LGV-L2 EB and RB forms. Additionally, we carried out LC-MS/MS to analyse the membranes of the pathogen-containing vacuole ('inclusion'). We developed a label-free quantification approaches to measure protein abundance in a mixed-proteome background which we applied for EB and RB quantitative analysis. In this manner, we catalogued the relative distribution of > 54% of the predicted proteins in the C. trachomatis LGV-L2 proteome. Proteins required for central metabolism and glucose catabolism were predominant in the EB, whereas proteins associated with protein synthesis, ATP generation and nutrient transport were more abundant in the RB. These findings suggest that the EB is primed for a burst in metabolic activity upon entry, whereas the RB form is geared towards nutrient utilization, a rapid increase in cellular mass, and securing the resources for an impending transition back to the EB form. The most revealing difference between the two forms was the relative deficiency of cytoplasmic factors required for efficient type III secretion (T3S) in the RB stage at 18 h post infection, suggesting a reduced T3S capacity or a low frequency of active T3S apparatus assembled on a 'per organism' basis. Our results show that EB and RB proteomes are streamlined to fulfil their predicted biological functions: maximum infectivity for EBs and replicative capacity for RBs.


Figures

Figure 1
Figure 1. Immunoblot analysis of selected developmental stage-specific C. trachomatis proteins
The relative abundance in EBs and RBs for a subset of chlamydial proteins was determined by immunoblot analysis and compared to mass spectrometry (MS)-based quantification. Quantitative trends were defined as “enrichment in EB” or “enrichment in RB” when EB to RB fold change was ≥ 2 and ≤ -2; otherwise they were considered as “no change”. Proteins that were below MS detection limits are indicated with “ND” (not detected). Asterisks added to RpoB and OmcB quantitative values represent a “quantitative flag”, indicating that mass spectrometry-based quantification may be less accurate due to differences in the tryptic peptide profiles observed for those proteins.
Figure 2
Figure 2. Validation of label-free protein quantification of a complex mixture of proteins from two different species (“mixed proteomes”)
A. We generated an artificial E. coli – mouse brain model system to assess the accuracy of MS-based label free quantification of proteins in a multi-species protein lysate. In addition, four exogenous proteins were spiked at pre-defined ratios as indicated (theoretical ratio) into 1:1 E. coli:mouse brain lysate (Sample 1, representing a “mixed proteome”) or E. coli lysates (Sample 2, representing a single proteome). After trypsin digestion and LC-MS/MS analysis, the quantitative measurements (fmol/μg) of proteins were assessed with and without species-specific correction. When species-specific correction was applied, the corrected measured ratio was almost identical to the theoretical ratio. B-C. Lower panels show a graphic representation of the direct quantitative comparison of all proteins from Sample 1 and Sample 2, without and with species-specific correction, as indicated. Note that when all proteins in the sample are considered and no correction is applied (B), an obvious quantitative bias towards lower quantities in Sample 1 by approximately 2× is observed, as expected. When using the total micrograms of only the identified E. coli proteins to normalize protein concentration as means of “species-specific” correction (C), the result is that the correct ratio of E. coli and spiked-in proteins are reproduced. ADH1_YEAST, yeast alcohol dehydrogenase; ENO1_YEAST, yeast enolas; ALBU_BOVIN, bovine albumin; PYGM_RABBIT, rabbit glycogen phosphorylase. A logarithmic scale was used for x and y axis.
Figure 3
Figure 3. Identification and quantification of the C. trachomatis L2 proteome
(A) Venn diagrams indicating the number of proteins identified and quantified by LC/LC-MS/MS (left panel) and the overlap in protein identification among the two C. trachomatis developmental forms (right panel). (B) Frequency histogram displays the distribution of the number of unique peptides per protein. The primary y axis (bars) shows the number of proteins detected for each particular number of peptides per protein in EB and RB samples. The secondary y axis (dotted lines) is a representation of the cumulative percentage of proteins detected along decreasing number of unique peptides per protein; 67.3% and 80.6% of proteins in EBs and RBs, respectively, were identified with 2 or more peptides to match.
Figure 4
Figure 4. Semitryptic peptide analysis indicates that C. trachomatis polymorphic membrane proteins (PMPs) are extensively processed
(A) Semitryptic peptides corresponding to PMPs were analyzed and mapped to the corresponding protein sequence. Potential cleavage sites identified are shown (red arrows). Cleavage motif, amino acid position, domains and signal peptides are shown. Signal peptides are indicated based on SignalP 3.0 prediction (http://www.cbs.dtu.dk/services/SignalP/) trained for Gram negative bacterial species. (B) Pie chart representing the relative abundance of different PMPs in the EB and RB forms, expressed as percentage of total mass corresponding to PMPs.
Figure 5
Figure 5. Quantitative comparison of the EB and RB proteomes
(A) Proteins were grouped into functional categories (as detailed in Table S1) and the total mass for each category was calculated. Values represent the mean contribution of each category expressed as percentage of the total proteome, resulting from four independent MS-based determinations. Error bars represent the standard deviation. Asterisks indicate statistically significant differences (p<0.01, Alternate Welch T-test not assuming equal standard deviation). 1. All protein categories that individually represented less than 3% of all quantified proteins both in EB and RB were grouped together as “Other”; these are “Base & Nucleotide Metabolism”, “DNA Replication, Modification, Repair & Recombination”, “Central Intermediary Metabolism”, “Standard Protein Secretion”, “Amino Acid Biosynthesis”, “Signal Transduction”, “Biosynthesis of Cofactors” and “Cell Division”. Expression levels for individual proteins for which quantitative values could be calculated within the category “Transport” (B) and “Energy Metabolism” (C) are represented and expressed as the mean (fmol/μg) resulting from four independent mass spectrometry-based determinations. Sub-categories are indicated. Error bars indicate the standard deviation. Asterisks indicate statistically significant differences (p<0.05, Alternate Welch T-test not assuming equal standard deviation).
Figure 6
Figure 6. T3S chaperones, cytoplasmic accessory factors and effectors are abundant in the EB form
(A) Cartoon displays a schematic representation of the chlamydial T3S-system (Betts-Hampikian & Fields, 2010). Cds proteins are shown with letter designation only. Proteins for which expression was detected are shown in color. OM: outer membrane. IM: inner membrane. (B) Comparison of expression levels for selected T3S-components (basal body component CdsD and cytoplasmic accessory factors CdsQ and CdsN), -chaperones (Mcsc, CT043, Scc2), and effectors (Tarp, CT694) between EB and RB forms, as determined by immunoblots. (C) Expression levels for recognized T3S-effectors and –chaperones in EBs are represented as the mean (fmol/μg) resulting from four independent mass spectrometry-based determinations. Dotted line indicates the 75th percentile for the EB proteome (82.5 fmol/μg), highlighting that the shown effectors and chaperones rank in the top 25% of proteins by abundance. Error bars indicate the standard deviation. (D) The most abundant chaperone, CT043, is associated with the most abundant T3S effector, Tarp. Immunoblots correspond to immunoprecipitation experiments using rabbit-raised anti-CT043 antibody. The flow through (FT) and the bound material (Eluate) obtained after incubating EB lysates with beads crosslinked with either pre-immune serum (used as a control, C) or anti-CT043 sera, were blotted for CT043, Tarp, CT584 and MOMP (left panel). Quantitative immunoblots show the % depletion of Tarp, CT043, CT584 and MOMP compared to controls, after incubation with anti-CT043 crosslinked beads (right panel). Note co-depletion of Tarp by anti-CT043 antibodies. Result is representative of at least three independent experiments.
Figure 7
Figure 7. Identification of C. trachomatis proteins associated with inclusion membranes
(A) Immunoblots showing fractionation of total membranes extracted from uninfected cells and from cells infected with C. trachomatis L2 (40 hours post-infection). Na/K ATPase and TRAPα were used as markers for plasma and endoplasmic reticulum membranes, respectively. IncA and IncG were used as markers for inclusion membranes and MOMP indicates the fractions enriched in intact bacteria. Proteins from fractions 2 and 3, which were enriched for IncA and IncG, were extracted and analyzed by LC-MS/MS. (B) Compendium of C. trachomatis L2 proteins associated with inclusion membranes. We highlight previously identified inclusion membrane proteins (Li et al., 2008a) and proteins not abundant in EBs.

Similar articles

Cited by

References

    1. Albrecht M, Sharma CM, Reinhardt R, Vogel J, Rudel T. Deep sequencing-based discovery of the Chlamydia trachomatis transcriptome. Nucleic Acids Res. 2010;38:868–877. - PMC - PubMed
    1. Bannantine JP, Griffiths RS, Viratyosin W, Brown WJ, Rockey DD. A secondary structure motif predictive of protein localization to the chlamydial inclusion membrane. Cell Microbiol. 2000;2:35–47. - PubMed
    1. Bebear C, de Barbeyrac B. Genital Chlamydia trachomatis infections. Clin Microbiol Infect. 2009;15:4–10. - PubMed
    1. Beeckman DS, Vanrompay DC. Bacterial secretion systems with an emphasis on the chlamydial Type III secretion system. Curr Issues Mol Biol. 2010;12:17–41. - PubMed
    1. Belland RJ, Zhong G, Crane DD, Hogan D, Sturdevant D, Sharma J, Beatty WL, Caldwell HD. Genomic transcriptional profiling of the developmental cycle of Chlamydia trachomatis. Proc Natl Acad Sci U S A. 2003;100:8478–8483. - PMC - PubMed

Publication types

MeSH terms