. 2011 Dec 5;8(6):2331-8.
doi: 10.1021/mp2002297. Epub 2011 Nov 1.

In vivo optical imaging of membrane-type matrix metalloproteinase (MT-MMP) activity

Affiliations

In vivo optical imaging of membrane-type matrix metalloproteinase (MT-MMP) activity

Lei Zhu et al. Mol Pharm. .

Abstract

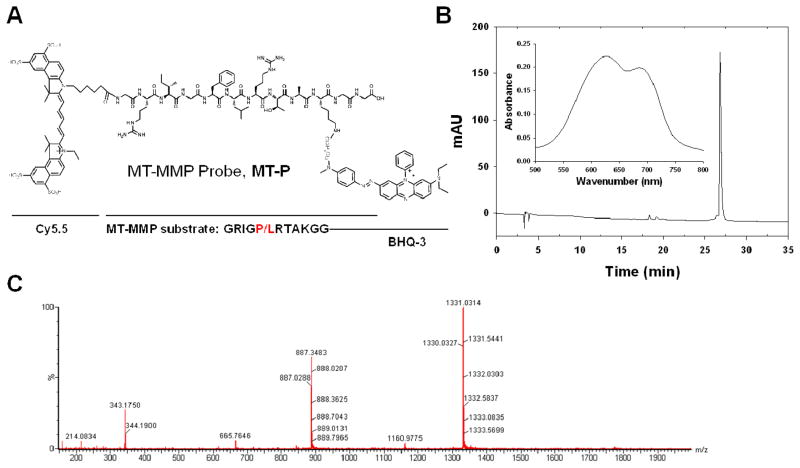
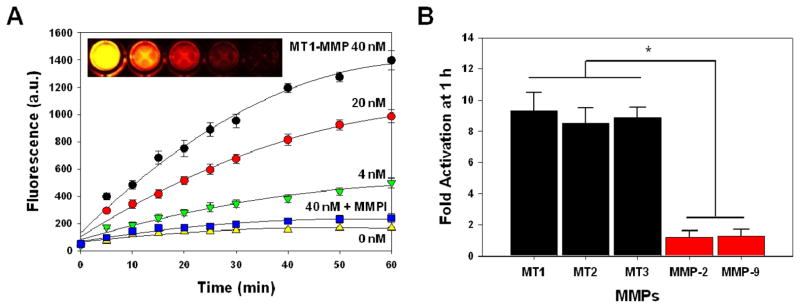
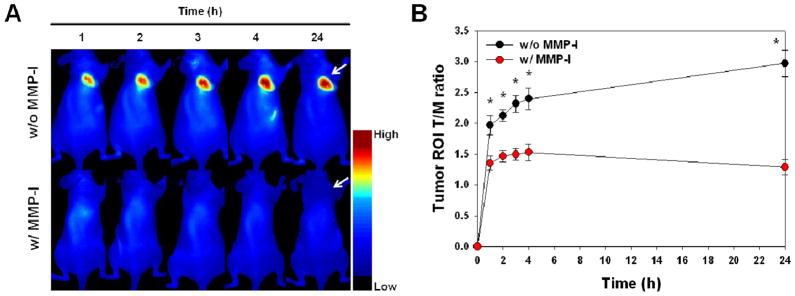
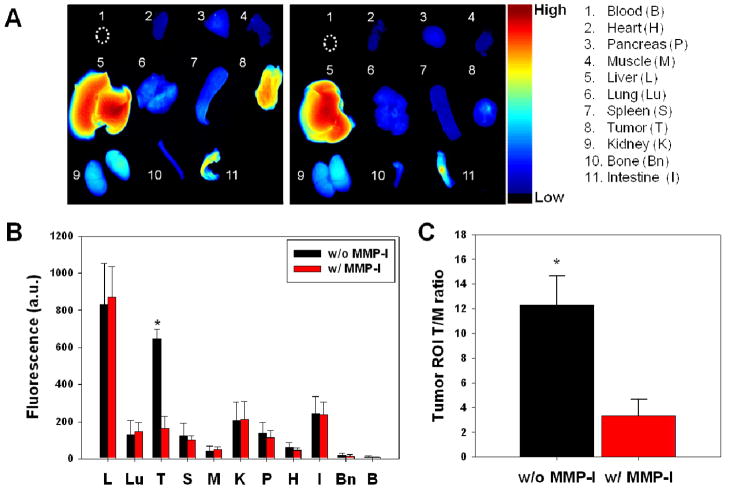
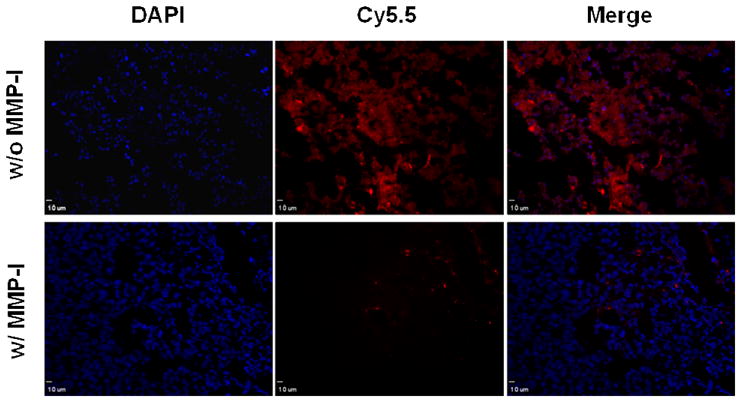
Herein we demonstrate for the first time that a fluorogenic probe can be used as an in vivo imaging agent for visualizing activities of membrane-tethered, membrane-type matrix metalloproteinases (MT-MMPs). An MT-MMP fluorogenic probe that consisted of an MT1-MMP (MMP-14) substrate and near-infrared (NIR) dye-quencher pair exhibited rapid, efficient boosts in fluorescence upon cleavage by MT1-MMP in tumor-bearing mice. In particular, unlike similar fluorogenic probes designed to target extracellular, soluble-type MMPs (EC-MMPs)--which can be cleared from the bloodstream after activation--the fluorescence signals activated by MT1-MMP enable clear visualization of MT1-MMP-positive tumors in animal models for up to 24 h. The results indicate that a simple form of a fluorogenic probe that is less effective in EC-MMP imaging is an effective probe for imaging MT-MMP activities in vivo. These findings can be widely applied to designing probes and to applications targeting various membrane-anchored proteases in vivo.


Figures

Figure 1
Figure 1
(A) Chemical structure of MT-MMP-specific fluorogenic probe, MT-P. The cleavage site is between Phe and Leu. (B) HPLC and UV-VIS (inset) spectra of MT-P. (C) LC/MS spectrum of MT-P.
Figure 2
Figure 2
Recovery of fluorescence of MT-P in the presence of various activated MMPs. (A) Fluorescence emission kinetic spectra of MT-P in the presence of various concentrations of activated MT1-MMP (0, 4, 20 and 40 nM) and MT1-MMP (40 nM) with a broad spectrum MMP inhibitor (MMP-I) following a 60 min incubation at 37 °C. (B) Fluorescence activation of MT-P in a solution containing various activated MMPs following a 60 min incubation at 37 °C. Means ± SD. (n = 3). *P < 0.05 for MT-MMPs relative to EC-MMPs.
Figure 3
Figure 3
(A) Representative Western blot analyses of MDA-MB-435 cell lysates for MT1-MMP (64 kDa). (B-D) Fluorescent immunostaining of MT1-MMP expression in an MDA-MB-435 tumor section counterstained with (B) DAPI (blue, marks the nucleus), (C) primary antibody for MT1-MMP and (D) their merged images.
Figure 4
Figure 4
Whole-mouse optical imaging. (A) Representative serial in vivo NIR fluorescence images of MT1-MMP-positive MDA-MB-435 tumor-bearing mice injected intravenously with MT-P under the condition without and with MMP inhibitor (MMP-I). Images were acquired at the indicated time points and were normalized by the maximum average value. The color bar indicates radiant efficiency (low, 0; high, 0.139×10⁶). Arrows indicate tumors. (B) Tumor ROI T/M ratio (the ratio of the signal in the ROI of the tumor compared to the muscle region) analysis of MDA-MB-435 tumor in vivo. Means ± SD. (n = 3–6 per group). *P < 0.05.
Figure 5
Figure 5
(A) Representative images of dissected organs and tissues of MDA-MB-435 tumor–bearing mice sacrificed at 24 hours after intravenous injection of MT-P without (left) and with (right) MMPI. The color bar indicates radiant efficiency (low, 0; high, 0.133×10⁶). (B) Biodistribution of MT-P at 24 h post-injection. (C) Tumor ROI T/M analysis of fluorescence intensity in excised tumor. Means ± SD. (n = 3–6 per group). *P < 0.05.
Figure 6
Figure 6
NIR fluorescence images of tumor sections injected with MT-P (red) without and with MMP inhibitor. Tumor sections were counterstained with DAPI (blue). Scale bar, 10 μm.

Similar articles

Cited by

References

    1. Liotta LA, Tryggvason K, Garbisa S, Hart I, Foltz CM, Shafie S. Metastatic potential correlates with enzymatic degradation of basement membrane collagen. Nature. 1980;284(5751):67–8. - PubMed
    1. Egeblad M, Werb Z. New functions for the matrix metalloproteinases in cancer progression. Nat Rev Cancer. 2002;2(3):161–74. - PubMed
    1. Kessenbrock K, Plaks V, Werb Z. Matrix metalloproteinases: regulators of the tumor microenvironment. Cell. 2010;141(1):52–67. - PMC - PubMed
    1. Coussens LM, Fingleton B, Matrisian LM. Matrix metalloproteinase inhibitors and cancer: trials and tribulations. Science. 2002;295(5564):2387–92. - PubMed
    1. Lee M, Fridman R, Mobashery S. Extracellular proteases as targets for treatment of cancer metastases. Chem Soc Rev. 2004;33(7):401–9. - PubMed

Publication types

Substances