. 2012 Feb;69(4):701-12.
doi: 10.1111/j.1365-313X.2011.04825.x. Epub 2011 Dec 16.

The chloroplast division mutant caa33 of Arabidopsis thaliana reveals the crucial impact of chloroplast homeostasis on stress acclimation and retrograde plastid-to-nucleus signaling

Affiliations

The chloroplast division mutant caa33 of Arabidopsis thaliana reveals the crucial impact of chloroplast homeostasis on stress acclimation and retrograde plastid-to-nucleus signaling

Klára Šimková et al. Plant J. 2012 Feb.

Abstract

Retrograde plastid-to-nucleus signaling tightly controls and coordinates the nuclear and plastid gene expression that is required for plastid biogenesis and chloroplast activity. As chloroplasts act as sensors of environmental changes, plastid-derived signaling also modulates stress responses of plants by transferring stress-related signals and altering nuclear gene expression. Various mutant screens have been undertaken to identify constituents of plastid signaling pathways. Almost all mutations identified in these screens target plastid-specific but not extraplastidic functions. They have been suggested to define either genuine constituents of retrograde signaling pathways or components required for the synthesis of plastid signals. Here we report the characterization of the constitutive activator of AAA-ATPase (caa33) mutant, which reveals another way of how mutations that affect plastid functions may modulate retrograde plastid signaling. caa33 disturbs a plastid-specific function by impeding plastid division, and thereby perturbing plastid homeostasis. This results in preconditioning plants by activating the expression of stress genes, enhancing pathogen resistance and attenuating the capacity of the plant to respond to plastid signals. Our study reveals an intimate link between chloroplast activity and the susceptibility of the plant to stress, and emphasizes the need to consider the possible impact of preconditioning on retrograde plastid-to-nucleus signaling.


Figures

Figure 1
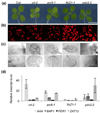
Figure 1. Characterization of the caa33 mutant
(a) Phenotype and luciferase activity of the flu/AAA:LUC+/caa33 mutant and the flu/AAA::LUC+ parental line grown under continuous light (CL) (90 µmol.m−2.s−1) on MS agar plates for 10 d (top panel) and in soil for 21 d (bottom panel). Bioluminescence images (LUC) and corresponding visible pictures (Light) are presented. Scale bars represent 0.5 cm. (b) Relative transcript levels of AAA-ATPase (AAA) and the AAA:LUC+ reporter gene (LUC) in cotyledons of 10-d-old seedlings and rosette leaves of 21-d-old flu/AAA:LUC+/caa33 mutant plants. Transcript levels were determined by qRT-PCR and are expressed relative to the parental flu/AAA:LUC+ line. Results represent mean values of two independent experiments ±SD. (c) Spontaneous cell death formation in the caa33 mutant. Staining with Trypan Blue (TB) and propidium iodine (PI) was done using 10-d-old light-grown seedlings of flu/AAA:LUC+ and flu/AAA:LUC+/caa33.
Figure 2
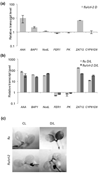
Figure 2. The expression of 1O2-responsive genes in 5-d-old seedlings of flu, flu/ex1/ex2, flu/caa33 and flu/caa33 /ex1/ex2 grown under continuous light
Relative AAA-ATPase (AAA) transcript levels as determined by qRT-PCR. The transcript level in flu was set as “1”. Results represent mean values of two independent experiments ±SD.
Figure 3
Figure 3. Identification and complementation of the caa33 mutation
(a) Mapping of CAA33. Initial mapping analysis revealed genetic linkage of CAA33 to markers located on the lower arm of chromosome V. Fine mapping localized the caa33 mutation in an 80 kb region covered by BAC clones K7B16 and K3K7. (b) A single G to A nucleotide substitution was found in the first exon of the At5g51020 locus in the caa33 mutant, resulting in a Gly31 to Asp amino acid exchange. Filled boxes indicate exons, lines indicate transcribed regions. (c) Allelism test of flu/caa33 with the crl mutant. The flu/caa33 mutant was crossed with crl and the F1 generation was raised. Phenotypes of 2-week-old F1, flu/caa33 and flu and 4-week-old crl plants grown under continuous light. Scale bar represents 1 cm. (d) Complementation of flu/caa33. Phenotypes of 10-d-old seedlings of flu, flu/caa33/35S:CRL and flu/caa33. Scale bar represents 0.5 cm. (e) Trypan Blue staining of cotyledons of 10-d-old seedlings of flu, flu/caa33/35S:CRL and flu/caa33 grown under continuous light. Scale bar represents 0.3 cm. (f) Confocal image of chlorophyll autofluorescence in mesophyll cells of 10-d-old seedlings of flu, flu/caa33/35S:CRL and flu/caa33 grown under continuous light. Scale bar represents 30 µm. (g) Relative transcript levels of AAA-ATPase, BAP1 and ZAT12 in cotyledons of 10-d-old seedlings of flu/caa33/35S:CRL and flu/caa33 grown under continuous light. Expression levels were analysed by qRT-PCR and expressed relative to flu. Results represent mean values of two independent experiments ±SD.
Figure 4
Figure 4. Mesophyll cells of crl-2 mutant contain enlarged chloroplasts
(a) GFP fluorescence (left panel), chlorophyll autofluorescence (middle panel) and merged image (right panel) showing mesophyll cells of transgenic plants expressing CRL-GFP under the control of 35S promoter. Scale bars represent 18 µm. (b) Chlorophyll autofluorescence confocal laser scanning microscopy images of chloroplasts in mesophyll and guard cells of 5-d-old crl-2 and wild type (Col) seedlings grown under continuous light. Scale bar represents 20 µm. (c) Frequency distribution of chloroplast sizes in cotyledons of 5-d-old seedlings of crl-2 and wild type (Col). Percentage of plastids of different sizes measured from 100 Col (dark grey bars) and caa33 (light grey bars) chloroplasts are presented. Average of two experiments is presented. (d) GFP fluorescence (upper panel) and red autofluorescence of free protochlorophyllide (lower panel) in etioplasts of 4-d-old dark grown flu/crl-2/SSU-GFP and flu/SSU-GFP seedlings. Scale bar represents 30 µm.
Figure 5
Figure 5. A comparison of crl-2, arc6-1, ftsZ1-1 and pdv2-2 plants
Seedlings were grown for 10 d under continuous light. (a) Morphological phenotypes of the selected mutant lines. Scale bar represents 0.5 cm. (b) Chlorophyll autofluorescence confocal laser scanning microscopy images of mesophyll cells of the selected mutant lines. Scale bar represents 30 µm. (c) Trypan Blue staining of cotyledons (upper panel) and true leaves (lower panel) of the selected mutant lines. Scale bar represents 0.25 cm. (d) Relative transcript levels of AAA-ATPase, BAP1, FER1 and ZAT12 marker genes in cotyledons of 10-d-old crl-2, arc6-1, ftsZ1-1 and pdv2-2 seedlings. Transcript levels were determined by qRT-PCR relative to the corresponding wild type line (Col-0 for crl-2, ftsZ1-1 and pdv2-2, and WS-2 for arc6-1). Results represent mean values of two independent experiments ±SD.
Figure 6
Figure 6. The response of flu/crl-2 to the release of singlet oxygen
Relative transcript levels of ROS-marker genes were analyzed in 5-d-old seedlings grown under continuous light and transferred to the dark for 8 h without or with a subsequent exposure to light. (a) Transcript levels in flu/crl-2 at the end of the 8 h dark period as determined by qRT-PCR relative to flu. Results represent mean values of two independent experiments ±SD. (b) Fold-inductions in flu (flu D/L; light grey bars) and flu/crl-2 (flu/crl-2 D/L; dark grey bars) after 1 h re-illumination. Transcript levels were determined by qRT-PCR relative to transcript levels at the end of the dark period. Results represent mean values of two independent experiments ±SD. (c) Trypan Blue staining of 5-d-old seedlings of flu and flu/crl-2 grown under continuous light (CL) or following an 8h-D/16 h-L shift (D/L).
Figure 7
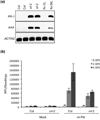
Figure 7. Constitutive stress acclimation in the crl-2 mutant
(a) Trancript levels of the PATHOGEN-RELATED PROTEIN1 (PR1), AAA-ATPase and ACTIN2 genes in 10-d-old seedlings of wild type (Col), crl-2 and flu grown under continuous light (wt, crl-2, flu CL) or transferred to the dark for 8 h and re-exposed to light for 1 h (flu D/L). (b) Constitutive, enhanced pathogen resistance of crl-2. 10-d-old seedlings of wild type (Col) and crl-2 seedlings were spray-inoculated with virulent Pseudomonas syringae pv tomato DC3000 (vir-Pst) expressing a LUCIFERASE reporter gene (Fan et al., 2007). Seedlings were inoculated for 0, 3 and 4 d (DPI) and the bacterial growth was determined by measuring the luciferase activity in plant extracts as relative fluorescence units (RFU). Mock-treated plants sprayed with a solvent without bacteria were used as controls. Values represent the average and standard deviation of three experiments.

Similar articles

Cited by

References

    1. Alonso JM, Stepanova AN, Leisse TJ, Kim CJ, Chen H, Shinn P, Stevenson DK, Zimmerman J, Barajas P, Cheuk R, Gadrinab C, Heller C, Jeske A, Koesema E, Meyers CC, Parker H, Prednis L, Ansari Y, Choy N, Deen H, Geralt M, Hazari N, Hom E, Karnes M, Mulholland C, Ndubaku R, Schmidt I, Guzman P, Aguilar-Henonin L, Schmid M, Weigel D, Carter DE, Marchand T, Risseeuw E, Brogden D, Zeko A, Crosby WL, Berry CC, Ecker JR. Genome-wide insertional mutagenesis of. Arabidopsis thaliana, Science. 2003;301:653–657. - PubMed
    1. Alvarez ME, Pennell RI, Meijer PJ, Ishikawa A, Dixon RA, Lamb C. Reactive oxygen intermediates mediate a systemic signal network in the establishment of plant immunity. Cell. 1998;92:773–784. - PubMed
    1. Apel K, Hirt H. Reactive oxygen species: metabolism, oxidative stress, and signal transduction. Annu. Rev. Plant Biol. 2004;55:373–399. - PubMed
    1. Asano T, Yoshioka Y, Kurei S, Sakamoto W, Machida Y. A mutation of the CRUMPLED LEAF gene that encodes a protein localized in the outer envelope membrane of plastids affects the pattern of cell division, cell differentiation, and plastid division in Arabidopsis. Plant J. 2004;38:448–459. - PubMed
    1. Ball L, Accotto G-P, Bechtold U, Creissen G, Funck D, Jimenez A, Kular B, Leyland N, Meija-Carranza J, Reynolds H, Karpinski S, Mullineaux PM. Evidence for a direct link between glutathione biosynthesis and stress defense gene expression in Arabidopsis. Plant Cell. 2004;16:2448–2462. - PMC - PubMed

Publication types

MeSH terms