. 2012 Feb;36(2):310-7.
doi: 10.1111/j.1530-0277.2011.01624.x. Epub 2011 Oct 20.

The impact of alcohol on BCG-induced immunity against Mycobacterium tuberculosis

Affiliations

The impact of alcohol on BCG-induced immunity against Mycobacterium tuberculosis

Elizabeth Porretta et al. Alcohol Clin Exp Res. 2012 Feb.

Abstract

Background: Alcoholics are at heightened risk for developing active tuberculosis. This study evaluates chronic alcohol consumption in a murine model of vaccination with Mycobacterium bovis Bacille Calmette-Guèrin (BCG) and subsequent pulmonary infection with virulent Mycobacterium tuberculosis.

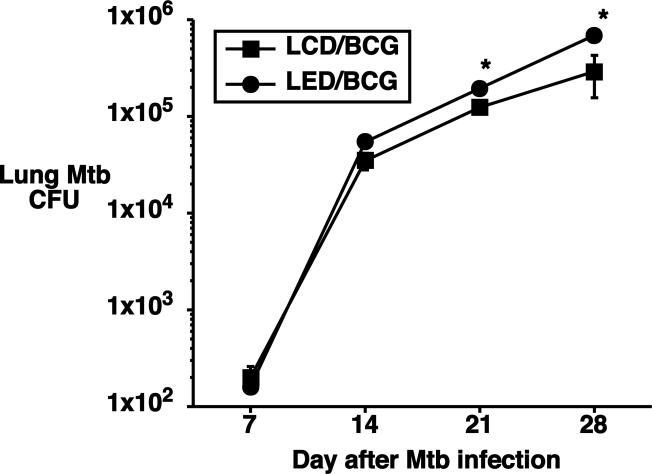
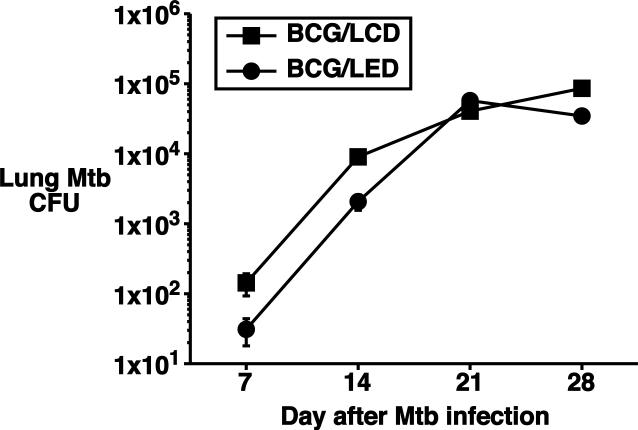
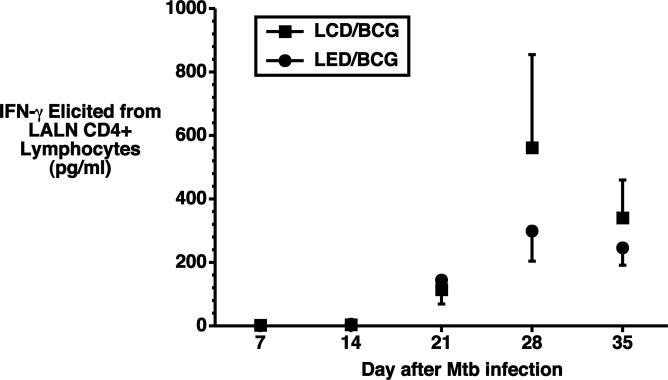
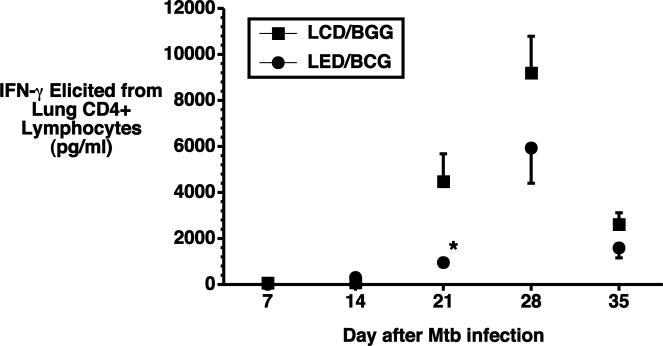
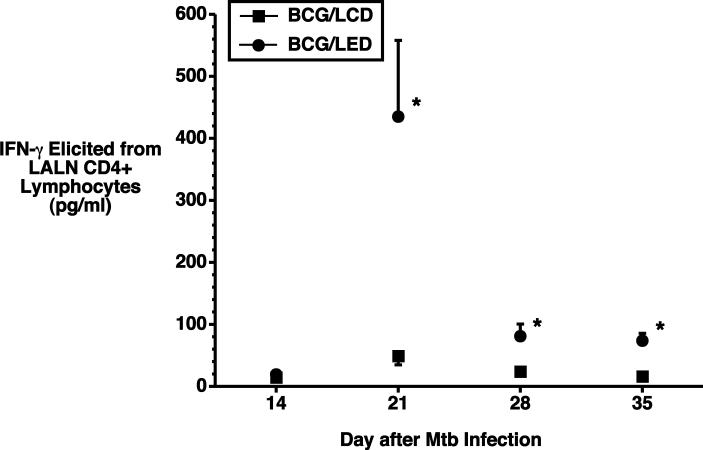
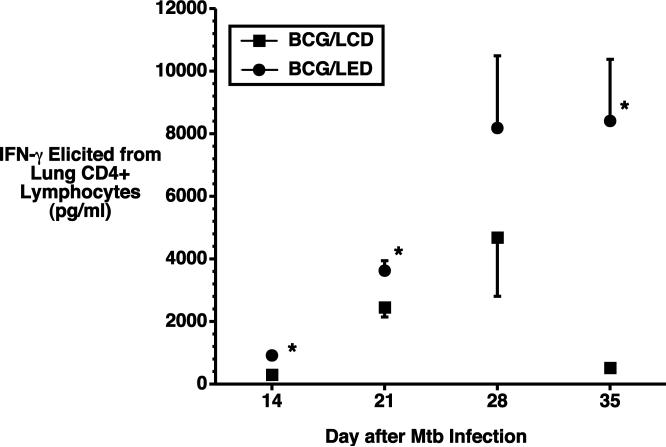
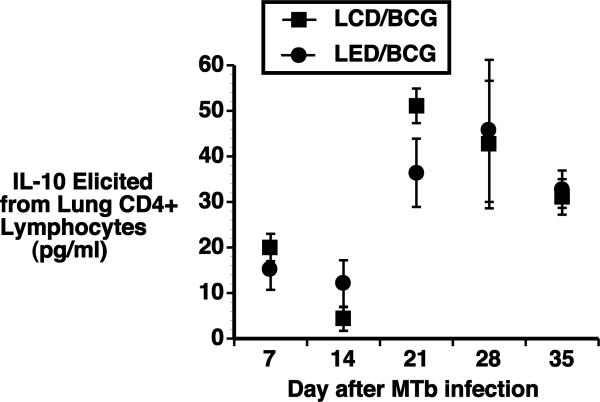
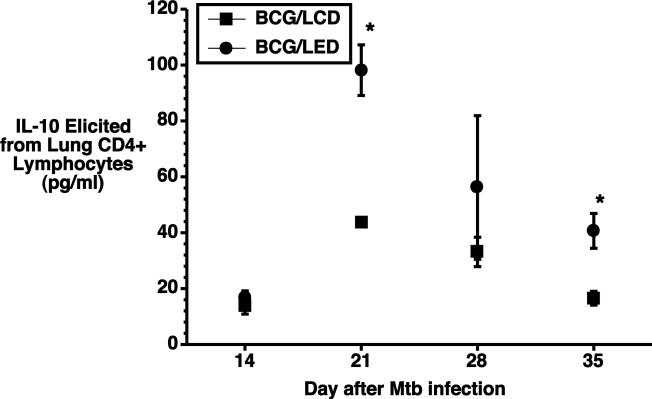
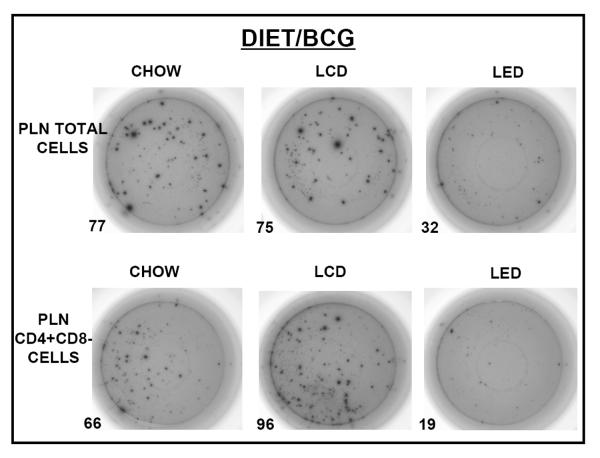
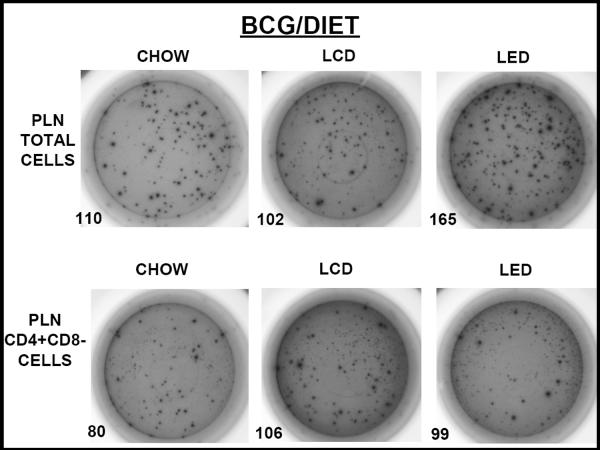
Methods: BALB/c mice were administered the Lieber-DeCarli liquid ethanol diet or pair-fed the liquid control diet for 3 weeks either before or after subcutaneous vaccination with M. bovis BCG. At least 3 weeks after BCG vaccination, groups of mice on the aforesaid diets were challenged with intratracheal infection with M. tuberculosis H37Rv. Lung mycobacterial burden, and lung and lung-associated lymph node CD4(+) lymphocyte production of tuberculosis-specific interferon (IFN)-γ were assayed. Popliteal lymph node lymphocytes from both dietary regimens undergoing BCG vaccination (in the absence of M. tuberculosis infection) were also evaluated for purified protein derivative-induced IFN-γ production by ELISpot assay.

Results: Mice begun on alcohol prior to vaccination with M. bovis BCG demonstrated impaired control of pulmonary challenge with virulent M. tuberculosis, as well as impaired lung CD4(+) and popliteal lymph node T-cell IFN-γ responses. If BCG vaccination was delivered prior to initiation of alcohol feeding, the mice remained protected against a subsequent challenge with M. tuberculosis, and BCG-induced immunity was not impaired in either the lung or the popliteal lymph nodes.

Conclusions: Alcohol consumption blunts the development of the adaptive immune response to M. bovis BCG vaccination, which impairs the control of a secondary challenge with M. tuberculosis, but only if the alcohol exposure is begun prior to BCG vaccination. These results provide insight into mechanisms by which alcohol consumption impairs antimycobacterial immunity, including in response to vaccination and subsequent pathogenic challenge.


Figures

Figure 1
Figure 1
1A. Lung burden of M. tuberculosis H37Rv in mice consuming either the LCD or LED diet prior to M. bovis BCG-vaccination and M. tuberculosis infection. There are significantly more organisms present in the LED/BCG mice at 21 and 28 days, at which times the LED mice had 157% and 237% increases in cfu respectively, compared to the LCD mice. *p<0.05 LCD/BCG vs LED/BCG. Figure 1A mean cfu ± SEM: Day 7: LCD/BCG = 2±0×102; LED/BCG = 1.6±0.6×10²; Day 14: LCD/BCG = 3.5±0.6×10⁴; LED/BCG = 5.4±0.7×10⁴; Day 21: LCD/BCG = 1.2±0.1×10⁵; LED/BCG = 2.0±0.1×10⁵; Day 28: LCD/BCG = 2.9±0.6×10⁵; LED/BCG = 6.9±1.4×10⁵. 1B. Lung burden of M. tuberculosis H37Rv in mice vaccinated with M. bovis BCG prior to consuming either the LCD or LED diet and M. tuberculosis infection. There are no significant differences in the burdens in the BCG/LED and BCG/LCD mice. Figure 1B mean cfu ± SEM: Day 7: BCG/LCD = 1.4±0.5×10²; BCG/LED =3.1±1.3×101; Day 14: BCG/LCD = 9.0±1.6×10³; BCG/LED = 2.1±0.5×10³; Day 21: BCG/LCD = 4.1±0.8×10⁴; BCG/LED =5.7±1.3×10⁴; Day28: BCG/LCD = 8.6±1.5×10⁴; BCG/LED = 3.5±0.6×10⁴.
Figure 1
Figure 1
1A. Lung burden of M. tuberculosis H37Rv in mice consuming either the LCD or LED diet prior to M. bovis BCG-vaccination and M. tuberculosis infection. There are significantly more organisms present in the LED/BCG mice at 21 and 28 days, at which times the LED mice had 157% and 237% increases in cfu respectively, compared to the LCD mice. *p<0.05 LCD/BCG vs LED/BCG. Figure 1A mean cfu ± SEM: Day 7: LCD/BCG = 2±0×102; LED/BCG = 1.6±0.6×10²; Day 14: LCD/BCG = 3.5±0.6×10⁴; LED/BCG = 5.4±0.7×10⁴; Day 21: LCD/BCG = 1.2±0.1×10⁵; LED/BCG = 2.0±0.1×10⁵; Day 28: LCD/BCG = 2.9±0.6×10⁵; LED/BCG = 6.9±1.4×10⁵. 1B. Lung burden of M. tuberculosis H37Rv in mice vaccinated with M. bovis BCG prior to consuming either the LCD or LED diet and M. tuberculosis infection. There are no significant differences in the burdens in the BCG/LED and BCG/LCD mice. Figure 1B mean cfu ± SEM: Day 7: BCG/LCD = 1.4±0.5×10²; BCG/LED =3.1±1.3×101; Day 14: BCG/LCD = 9.0±1.6×10³; BCG/LED = 2.1±0.5×10³; Day 21: BCG/LCD = 4.1±0.8×10⁴; BCG/LED =5.7±1.3×10⁴; Day28: BCG/LCD = 8.6±1.5×10⁴; BCG/LED = 3.5±0.6×10⁴.
Figure 2
Figure 2
2A. Elicited IFN-γ levels after stimulation of LALN (Figures 2A & 2C) and lung (Figures 2B & 2D) CD4+ lymphocytes from LED/BCG and LCD/BCG, and BCG/LED and BCG/LCD groups by M. tuberculosis-infected PMs. ELISA assays performed on 48-hour cell culture supernatants. There are no differences in IFN-γ between the LCD/BCG and LED/BCG LALN CD4+ T cells (Figure 2A), but there is significantly more IFN-γ from the BCG/LED LALN CD4+ lymphocytes vs the BCG/LCD at 21, 28 and 35 days after M. tuberculosis infection (Figure 2C). *p<0.05 BCG/LED vs BCG/LCD. For the lung CD4+ lymphocytes, there is significantly less IFN-γ produced by the LED/BCG CD4+ T cells at 21 days after M. tuberculosis infection, and trends to less IFN-γ at 28 and 35 days after M. tuberculosis infection (Figure 2B). *p<0.05 LCD/BCG vs LED/BCG. In the BCG/LED group, there is more IFN-γ produced at all time points, significantly so at 14, 21 and 35 days following M. tuberculosis infection (Figure 2D). *p<0.05 BCG/LED vs BCG/LCD.
Figure 2
Figure 2
2A. Elicited IFN-γ levels after stimulation of LALN (Figures 2A & 2C) and lung (Figures 2B & 2D) CD4+ lymphocytes from LED/BCG and LCD/BCG, and BCG/LED and BCG/LCD groups by M. tuberculosis-infected PMs. ELISA assays performed on 48-hour cell culture supernatants. There are no differences in IFN-γ between the LCD/BCG and LED/BCG LALN CD4+ T cells (Figure 2A), but there is significantly more IFN-γ from the BCG/LED LALN CD4+ lymphocytes vs the BCG/LCD at 21, 28 and 35 days after M. tuberculosis infection (Figure 2C). *p<0.05 BCG/LED vs BCG/LCD. For the lung CD4+ lymphocytes, there is significantly less IFN-γ produced by the LED/BCG CD4+ T cells at 21 days after M. tuberculosis infection, and trends to less IFN-γ at 28 and 35 days after M. tuberculosis infection (Figure 2B). *p<0.05 LCD/BCG vs LED/BCG. In the BCG/LED group, there is more IFN-γ produced at all time points, significantly so at 14, 21 and 35 days following M. tuberculosis infection (Figure 2D). *p<0.05 BCG/LED vs BCG/LCD.
Figure 3
Figure 3
Elicited IL-10 levels after stimulation of lung CD4+ lymphocytes from LED/BCG and LCD/BCG (Figure 3A), and BCG/LED and BCG/LCD (Figures 3B) groups by M. tuberculosis-infected PMs. There are no differences in IL-10 levels between the LED/BCG and LCD/BCG groups in Figure 3A; however, in Figure 3B there are higher levels of IL-10 in the BCG/LED group at all time points, reaching statistical significance at 21, and 35 days after M. tuberculosis infection. *p<0.05 BCG/LED vs BCG/LCD.
Figure 3
Figure 3
Elicited IL-10 levels after stimulation of lung CD4+ lymphocytes from LED/BCG and LCD/BCG (Figure 3A), and BCG/LED and BCG/LCD (Figures 3B) groups by M. tuberculosis-infected PMs. There are no differences in IL-10 levels between the LED/BCG and LCD/BCG groups in Figure 3A; however, in Figure 3B there are higher levels of IL-10 in the BCG/LED group at all time points, reaching statistical significance at 21, and 35 days after M. tuberculosis infection. *p<0.05 BCG/LED vs BCG/LCD.
Figure 4
Figure 4
Representative ELISPOT assay of PPD-stimulated IFN-γ spot-forming cells in the popliteal lymph nodes of mice vaccinated with BCG. Figure 4A: ELISPOTs from representative mice in Chow/BCG, LCD/BCG and LED/BCG diet groups, with fewer spots present in the LED group. The assay was repeated after selection and removal of the CD8+ T cells from the total cells, thereby enriching the cells for CD4+ T cells, without differences from the total cells. Figure 4B: ELISPOTs from representative mice in BCG/Chow, BCG/LCD and BCG/ LED diet groups, with no fewer spots in the LED group. The assay was also repeated after selection and removal of the CD8+ T cells from the total cells, thereby enriching the cells for CD4+ T cells, with no change in the results.
Figure 4
Figure 4
Representative ELISPOT assay of PPD-stimulated IFN-γ spot-forming cells in the popliteal lymph nodes of mice vaccinated with BCG. Figure 4A: ELISPOTs from representative mice in Chow/BCG, LCD/BCG and LED/BCG diet groups, with fewer spots present in the LED group. The assay was repeated after selection and removal of the CD8+ T cells from the total cells, thereby enriching the cells for CD4+ T cells, without differences from the total cells. Figure 4B: ELISPOTs from representative mice in BCG/Chow, BCG/LCD and BCG/ LED diet groups, with no fewer spots in the LED group. The assay was also repeated after selection and removal of the CD8+ T cells from the total cells, thereby enriching the cells for CD4+ T cells, with no change in the results.

Similar articles

Cited by

References

    1. Anderson G, Jenkinson E, Moore N, Owen J. MHC class II-positive epithelium and mesenchyme cells are both required for T-cell development in the thymus. Nature. 1993;362:70–73. - PubMed
    1. Antas PRZ, Castello-Branco LRR. New vaccines against tuberculosis: lessons learned from BCG immunization in Brazil. Trans Royal Soc Trop Med Hygiene. 2008;102:628–630. - PubMed
    1. ATS/CDC Targeted tuberculin testing and treatment of latent tuberculosis infection. Am J Respir Crit Care Med. 2000;161:S221–S247. - PubMed
    1. Baldwin S, D'Souza C, Roberts A, Kelly B, Frank A, Lui M, Ulmer J, Huygen K, McMurray D, Orme I. Evaluation of new vaccines in the mouse and guinea pig model of tuberculosis. Infec Immun. 1998;66:2951–2959. - PMC - PubMed
    1. Barber A, Coyle S, Marano M, Fischer E, Calvano S, Fong Y, Moldawer L, Lowry S. Glucocorticoid therapy alters hormonal and cytokine responses to endotoxin in man. J Immunol. 1993;150:1999–2006. - PubMed

Publication types