. 2012 Mar;36(3):443-56.
doi: 10.1111/j.1530-0277.2011.01631.x. Epub 2011 Oct 20.

Ethanol alters opioid regulation of Ca(2+) influx through L-type Ca(2+) channels in PC12 cells

Affiliations

Ethanol alters opioid regulation of Ca(2+) influx through L-type Ca(2+) channels in PC12 cells

Donna L Gruol et al. Alcohol Clin Exp Res. 2012 Mar.

Abstract

Background: Studies at the behavioral and synaptic level show that effects of ethanol on the central nervous system can involve the opioid signaling system. These interactions may alter the function of a common downstream target. In this study, we examined Ca(2+) channel function as a potential downstream target of interactions between ethanol and μ or κ opioid receptor signaling.

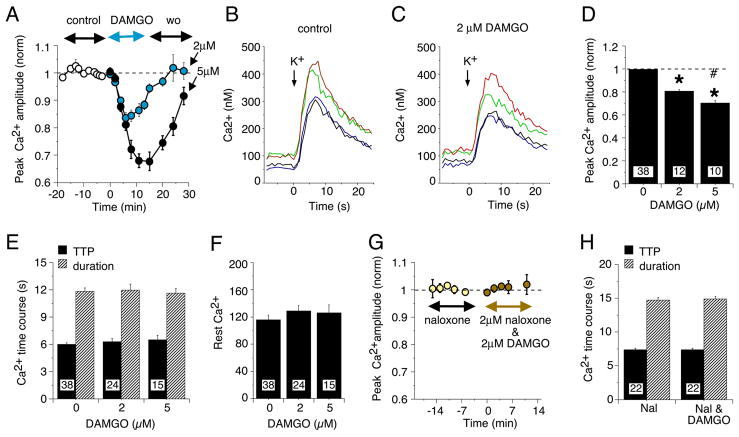
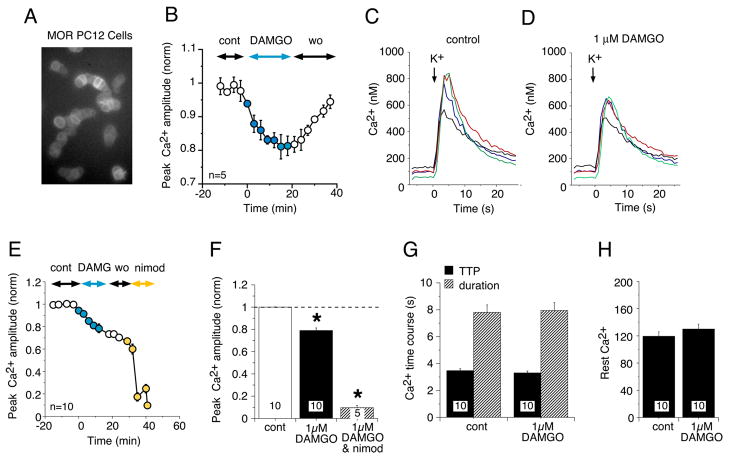
Methods: The studies were carried out in a model system, undifferentiated PC12 cells transfected with μ or κ opioid receptors. The PC12 cells express L-type Ca(2+) channels, which were activated by K(+) depolarization. Ca(2+) imaging was used to measure relative Ca(2+) flux during K(+) depolarization and the modulation of Ca(2+) flux by opioids and ethanol.

Results: Ethanol, μ receptor activation, and κ receptor activation all reduced the amplitude of the Ca(2+) signal produced by K(+) depolarization. Pretreatment with ethanol or combined treatment with ethanol and μ or κ receptor agonists caused a reduction in the amplitude of the Ca(2+) signal that was comparable to or smaller than that observed for the individual drugs alone, indicating an interaction by the drugs at a downstream target (or targets) that limited the modulation of Ca(2+) flux through L-type Ca(2+) channels.

Conclusions: These studies provide evidence for a cellular mechanism that could play an important role in ethanol regulation of synaptic transmission and behavior through interactions with the opioid signaling.


Figures

Figure 1
Figure 1
Effect of DAMGO on membrane depolarization produced by high K+ saline (100 mM) in rMOR transformed PC12 cells. A. Digitized images of live PC12 cells used for electrophysiological studies. The fluorescence image shows expression of MOR-EGFP, which is primarily localized at the cell membrane. B. Current clamp recordings showing membrane depolarizations produced by K+ saline applied at the arrow by brief micropressure application at different durations. Increasing the duration of application increased the depolarization. C. Simultaneous current clamp (bottom panel) and Ca2+ recordings (top panel) during K+ depolarization showing that the membrane depolarization elicited a Ca2+ signal. D. Effect of the L-type VGCC blocker nimodipine (nimod) on the K+ evoked Ca2+ signal. Graph shows mean values (±SEM) for the peak amplitude of the K+ evoked Ca2+ signal under control conditions and in the presence of nimodipine. Inset shows representative Ca2+ signals before and after nimodipine application. Nimodipine significantly reduced the Ca2+ signal indicating that the primary VGCC responsible for the Ca2+ signal was the L-type VGCC. Asterisk indicates significant difference from control values (p< 0.05, unpaired t-test). E. Mean peak amplitude (±SEM) of the membrane depolarization produced by different durations of K+ application before and after addition of DAMGO (1 μM) to the recording saline. Representative recordings are shown to the right. DAMGO did not significantly alter the peak amplitude of the membrane depolarization. F. Mean values (±SEM) for the amplitude and duration of the K+-evoked membrane depolarization before and after application of 2 μM DAMGO. G. Mean values (±SEM) for resting membrane potential before and after application of 2 μM DAMGO. H. Current clamp recordings showing the membrane response produced by intracellular application of depolarizing and hyperpolarizing current pulses under control conditions and in the presence of DAMGO (1 μM). Depolarization of the membrane did not produce spike events due the immature status of the cells (H, bottom panels). I. A representative current-voltage relationship derived from measurement of voltage responses produced by intracellular current injection as shown in H. J. Mean values (±SEM) for membrane input resistance before and after application of 2 μM DAMGO. Input resistance was calculated from the slope of current-voltage curves such as that shown in I. For all graphs, numbers in bars show the number of cells studied.
Figure 2
Figure 2
DAMGO inhibition of K+ evoked Ca2+ signal. A. Normalized mean peak amplitude (± SEM, n=32) of the K+ (100 mM) evoked Ca2+ signal under control conditions (saline superfusion), after superfusion of 2 or 5 μM DAMGO and during washout with saline (wo). The two doses were tested on different populations of cells. In each experiment, the peak amplitude of the Ca2+ signal was normalized to the mean value for the peak amplitude during control conditions on an individual cell basis. Horizontal arrows show time of saline and DAMGO superfusion and washout. In this and other figures, the dotted line shows control levels. DAMGO reduced the peak amplitude of the Ca2+ signal in a dose-dependent manner. B, C. Representative Ca2+ signals recorded in 4 cells under control (B) conditions and in the presence of 2 μM DAMGO (C). K+ (2 s application) was applied at the arrow. D. Normalized mean values for peak amplitude (± SEM) of the K+ evoked Ca2+ signal under control conditions (at time = 0), in the presence of 2 μM DAMGO and 5 μM DAMGO. Asterisk indicates significant difference from control values; the hatched character indicates significant difference from 2 μM DAMGO (p< 0.05, ANOVA) E. Mean values (±SEM) for time to peak (TTP) and duration (measured at half maximum peak amplitude) of the Ca2+ signals measured under control conditions and in the presence of DAMGO. F. Mean values (±SEM) for resting Ca2+ levels under control conditions and in the presence of DAMGO. G. Normalized mean peak amplitude (± SEM, n= 22) of the K+ evoked Ca2+ signal during superfusion of 2 μM naloxone and after superfusion of DAMGO (2 μM) plus naloxone. In each experiment, the peak amplitude of the Ca2+ signal was normalized to the mean value for the peak amplitude during control (naloxone alone) conditions on an individual cell basis. Horizontal arrows show the time of naloxone and naloxone plus DAMGO superfusion. Naloxone blocked the effect of DAMGO. H. Mean values (±SEM) for TTP and duration (measured at half maximum peak amplitude) of the K+ evoked Ca2+ signals measured in the presence of naloxone (Nal) and naloxone plus DAMGO. In graphs D, E, F and H, control values represent an average of all control measurements; drug values represent the peak effect. For all graphs, numbers in bars show the number of cells studied.
Figure 3
Figure 3
Interactions between ethanol and DAMGO. A, E. Normalized mean values for the peak amplitude (± SEM) of the K+ (100 mM) evoked Ca2+ signal under control conditions (saline superfusion) and superfusion of 20 mM ethanol or 20 mM ethanol plus 2 μM (A) or 5 μM (E) DAMGO. In each experiment, the peak amplitude of the Ca2+ signal was normalized to the mean value for the peak amplitude during control conditions on an individual cell basis. Horizontal arrows show the time of saline, ethanol and ethanol plus DAMGO superfusion. The peak amplitude of the Ca2+ signal was similar in ethanol alone and ethanol plus DAMGO. B, F. Normalized mean values for peak amplitude (± SEM) of the K+ evoked Ca2+ signals under control conditions (at time = −20), in the presence of 20 mM ethanol (at time= −6 min for 2 μM DAMGO (B); at time= −8 for 5 μM DAMGO (F)) and in the presence of 20 mM ethanol plus DAMGO (at time = 10 min for 2 μM DAMGO (B); at time = 8 for 5 μM DAMGO (F)). Dotted line shows control levels. C, G. Mean values (±SEM) for time to peak (TTP) and duration (measured at half maximum peak amplitude) of the Ca2+ signals measured under control conditions, in the presence of 20 mM ethanol and in the presence of 20 mM ethanol plus 2 μM DAMGO (C) or 20 mM ethanol plus 5 μM DAMGO (G). D, H. Mean values (±SEM) for resting Ca2+ levels under control conditions (D, H), in the presence of 20 mM ethanol and in the presence of 20 mM ethanol plus 2 μM DAMGO (D) or 20 mM ethanol plus 5 μM DAMGO (H). For all graphs, numbers in bars show the number of cells studied. Asterisk indicates significant difference from control value (p< 0.05, ANOVA).
Figure 4
Figure 4
DAMGO inhibition of Ca2+ signal produced by K+ saline in hMOR transformed PC12 cells. A. Digitized fluorescence image of live hMOR transformed PC12 cells used for Ca2+ imaging studies. The image shows expression of hMOR-EGFP, which is primarily localized at the cell membrane. B, E. Normalized mean peak amplitude values (± SEM) of the K+ evoked (60 mM) Ca2+ signal under control conditions (saline superfusion), during superfusion of 1 μM DAMGO and during washout with saline (wo). In each experiment, the peak amplitude of the Ca2+ signal was normalized to the mean value for the peak amplitude during control conditions on an individual cell basis. Horizontal arrows show time of saline (cont) and DAMGO superfusion and washout. In E, a short washout (wo) period is followed by superfusion of the L-type VGCC blocker nimodipine (nimod). Nimodipine significantly reduced the Ca2+ signal indicating that the primary VGCC responsible for the Ca2+ signal was the L-type VGCC. C, D. Representative Ca2+ signals evoked by K+ saline (applied at the arrow) in hMOR PC12 cells during control conditions (saline superfusion) (C) and after superfusion of DAMGO (D). Responses of 4 cells within a microscopic field are shown. F. Graph showing mean values (±SEM) for the peak amplitude of the K+-evoked Ca2+ signal under control conditions and in the presence of DAMGO and nimodipine. Dotted line shows control levels. Asterisk indicates significant difference from conditions without nimodipine (p< 0.05, ANOVA). G. Mean values (±SEM) for time to peak (TTP) and duration (measured at half maximum peak amplitude) of the K+-evoked Ca2+ signal under control conditions and in the presence of DAMGO. H. Mean values (±SEM) for resting Ca2+ levels under control conditions and in the presence of DAMGO. For all graphs, numbers in bars show the number of cells studied. In graphs shown in F–H, control values represent an average of all control measurements; drug values represent mean values for the peak effect.
Figure 5
Figure 5
Interactions between ethanol and DAMGO in the presence of ryanodine. A1-C1. Normalized mean values (± SEM) for the peak amplitude of the K+-evoked (60 mM) Ca2+ signal under control conditions (vehicle superfusion), during ryanodine superfusion and during superfusion with ryanodine plus DAMGO (A1), ryanodine plus 20 mM ethanol (B1), or ryanodine plus 20 mM ethanol plus DAMGO (C1). In each experiment, the peak amplitude of the Ca2+ signal was normalized to the mean value for the peak amplitude during control conditions on an individual cell basis. Horizontal arrows show the time of superfusion of the various drugs. A2-C2. Normalized mean values (± SEM) for peak amplitude of the K+-evoked Ca2+ signals under control conditions (average of all control values) and in the presence of the different drugs tested (t= time point of experiment for data used in graph). Dotted line indicates control values. Asterisk indicates significant difference from control conditions without ryanodine; hatched symbol indicates significantly different from the respective control condition (p< 0.05, ANOVA). Ryanodine plus DAMGO, ryanodine plus ethanol, and ryanodine plus ethanol plus DAMGO all reduced the peak amplitude of the Ca2+ signal to a similar extent. A3-C3. Mean values (±SEM) for time to peak (TTP) and duration (measured at half maximum peak amplitude) of the K+-evoked Ca2+ signal under control conditions (average of all control values) and in the presence of the different drugs tested at the peak of the drug effect. For all graphs, numbers in bars show the number of cells studied.
Figure 6
Figure 6
Dynorphin A inhibition of Ca2+ signal produced by K+ saline in KOR transformed PC12 cells. A. Digitized images of live PC12 cells used for Ca2+ imaging studies. The fluorescence image shows expression of KOR-EGFP, which is primarily localized at the cell membrane. B. Representative Ca2+ signals evoked by K+ saline (50 mM, applied at the arrow) in KOR PC12 cells during control conditions (saline superfusion) and after superfusion of dynorphin A (Dyn A). Responses of 4 cells within a microscopic field are shown. C. Normalized mean peak amplitude (± SEM, n= 27) of the K+ evoked Ca2+ signal under control conditions (saline superfusion) and during superfusion of 200 nM Dyn A. In each experiment, the peak amplitude of the Ca2+ signal was normalized to the mean value for the peak amplitude during control conditions on an individual cell basis. Horizontal arrows show time of saline (control) and Dyn A superfusion. D. The L-type VGCC blocker nimodipine significantly reduced the Ca2+ signal indicating that the primary VGCC responsible for the Ca2+ signal was the L-type VGCC. Graph shows mean values (±SEM) for the peak amplitude of the K+-evoked Ca2+ signal under control conditions and in the presence of nimodipine. E. Normalized mean values (± SEM) for peak amplitude of the K+-evoked Ca2+ signal under control conditions (at time = −3) and in the presence of 200 nM Dyn A (at t= 12 min). Asterisk indicates significant difference from control values; the hatched character indicates significant difference from 2 μM DAMGO (p< 0.05, ANOVA). F. Mean values (±SEM) for time to peak (TTP) and duration (measured at half maximum peak amplitude) of the K+-evoked Ca2+ signal under control conditions and in the presence of 200 nM Dyn A. G. Mean values (±SEM) for resting Ca2+ levels under control conditions and in the presence of 200 nM Dyn A.
Figure 7
Figure 7
Interactions between ethanol and Dyn A. A, D. Normalized mean values (± SEM) for the peak amplitude of the K+-evoked Ca2+ signal under control conditions (saline superfusion) and after superfusion 20 mM ethanol or 20 mM ethanol plus 200 nM Dyn A. In each experiment, the peak amplitude of the Ca2+ signal was normalized to the mean value for the peak amplitude during control conditions on an individual cell basis. Horizontal arrows show the time of saline (control), ethanol or ethanol plus Dyn A superfusion. B, E. Representative Ca2+ signals evoked by K+ saline (50 mM, applied at the arrow) in the KOR PC12 cells under control conditions and after superfusion of ethanol (20 mM)(B) or ethanol (20 mM) plus Dyn A (200 nM)(E). Responses of 4 cells within a microscopic field are shown. C, F. Normalized mean values (± SEM) for peak amplitude of the K+-evoked Ca2+ signals under control conditions (at time = −3) and in the presence of 20 mM ethanol (C; at t= 12 min) or 20 mM ethanol plus 200 nM Dyn A (F; at time = 12 min). Ethanol and ethanol plus Dyn A reduced the peak amplitude of the Ca2+ signal to a similar extent. Asterisk indicates significant difference from control value (p< 0.05, ANOVA). Dotted line indicates control values. For all graphs, numbers in bars show the number of cells studied.

Similar articles

Cited by

References

    1. Aguayo LG, Pancetti FC. Ethanol modulation of the gamma-aminobutyric acidA- and glycine-activated Cl- current in cultured mouse neurons. J Pharmacol Exp Ther. 1994;270(1):61–9. - PubMed
    1. Albillos A, Carbone E, Gandia L, Garcia AG, Pollo A. Opioid inhibition of Ca2+ channel subtypes in bovine chromaffin cells: selectivity of action and voltage-dependence. Eur J Neurosci. 1996;8(8):1561–70. - PubMed
    1. Aryal P, Dvir H, Choe S, Slesinger PA. A discrete alcohol pocket involved in GIRK channel activation. Nat Neurosci. 2009;12(8):988–95. - PMC - PubMed
    1. Baldelli P, Hernandez-Guijo JM, Carabelli V, Novara M, Cesetti T, Andres-Mateos E, Montiel C, Carbone E. Direct and remote modulation of L-channels in chromaffin cells: distinct actions on alpha1C and alpha1D subunits? Mol Neurobiol. 2004;29(1):73–96. - PubMed
    1. Belia S, Mannucci R, Lisciarelli M, Cacchio M, Fano G. Double effect of ethanol on intracellular Ca2+ levels in undifferentiated PC12 cells. Cell Signal. 1995;7(4):389–95. - PubMed

Publication types

MeSH terms