. 2011 Oct 18;20(4):427-42.
doi: 10.1016/j.ccr.2011.08.016.

FoxM1 promotes β-catenin nuclear localization and controls Wnt target-gene expression and glioma tumorigenesis

Affiliations

FoxM1 promotes β-catenin nuclear localization and controls Wnt target-gene expression and glioma tumorigenesis

Nu Zhang et al. Cancer Cell. .

Abstract

Wnt/β-catenin signaling is essential for stem cell regulation and tumorigenesis, but its molecular mechanisms are not fully understood. Here, we report that FoxM1 is a downstream component of Wnt signaling and is critical for β-catenin transcriptional function in tumor cells. Wnt3a increases the level and nuclear translocation of FoxM1, which binds directly to β-catenin and enhances β-catenin nuclear localization and transcriptional activity. Genetic deletion of FoxM1 in immortalized neural stem cells abolishes β-catenin nuclear localization. FoxM1 mutations that disrupt the FoxM1-β-catenin interaction or FoxM1 nuclear import prevent β-catenin nuclear accumulation in tumor cells. FoxM1-β-catenin interaction controls Wnt target gene expression, is required for glioma formation, and represents a mechanism for canonical Wnt signaling during tumorigenesis.


Figures

Figure 1
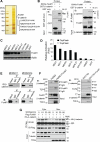
Figure 1. FoxM1 and β-Catenin Directly Interact In Vitro and In Vivo
(A) 293T cells were transfected with Flag-FoxM1 or a control plasmid. Cell extracts were subjected to IP using an anti-Flag antibody. The IP protein complex was subjected to LCMS/MS analysis. Four identified peptide sequences of β-catenin are shown. (B) GST pull-down was performed using purified GST-β-catenin and 6xHis-FoxM1, followed by IB with an anti-His antibody (left panel). IP was performed using purified 6xHis-FoxM1 and GST-β-catenin with an anti-FoxM1 antibody, followed by IB with anti-FoxM1 and anti-β-catenin antibodies (right panel). (C) Western blotting of the FoxM1 protein in 8 cell types, including 5 established GICs and 2 glioma cell lines. (D) Cells were transfected with the TOP-Flash or control FOP-Flash reporter to determine reporter activities 48 hr after transfection. Promoter activation (fold) was calculated relative to that in 293T cells. Values are mean ± SD for triplicate samples. (E) Nuclear extracts of MD11 and MD20s cells were subjected to IP using FoxM1 antibody or control IgG, followed by IB with β-catenin antibody (upper panels). Reciprocal IP was done using β-catenin antibody or control IgG, followed by IB with the FoxM1 antibody (lower panels). (F) Lysates of Hs683 and SW1783 cells that stably express T7-FoxM1 or a control vector were subjected to IP using anti-FoxM1 or anti-T7 antibodies, followed by IB with anti-β-catenin or anti-TCF4 antibodies. (G) 293T cells were cotransfected with Flag-FoxM1 and HA-β-catenin plasmids. The cells were treated with 20 ng/ml Wnt3a, and cytoplasmic or nuclear extracts were prepared at the indicated time points and subjected to IP and IB analyses with the indicated antibodies. Tubulin and TFIIb were used as controls for cytoplasmic and nuclear fractions, respectively. See also Figures S1.
Figure 2
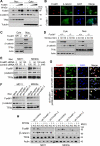
Figure 2. FoxM1 Promotes β-Catenin Nuclear Accumulation
(A, B) 293T cells were transfected with DsRed2-N1-FoxM1 plus CFP-β-catenin for 48 hr and then treated with 20 ng/ml Wnt3a. Sequential live images of FoxM1 and β-catenin nuclear localization/colocalization were taken every 10 sec after Wnt3a treatment using a confocal imaging system. (A) DsRed or CFP fluorescence intensities of the cells at each time point (0, 5, and 10 min) are shown as pseudocolor images. The white spots (colocalization points) of merged DsRed and CFP images indicate that FoxM1 and β-catenin colocalized in the cell (scale bar, 10 μm). The boxed area in the nucleus is shown at higher magnification in the upper right corner. (B) Three positions in the nucleus were randomly chosen, and fluorescence intensities at these positions were calculated for each time point. (C) Nuclear levels of β-catenin and FoxM1 in 293T cells treated with 20 ng/ml Wnt3a for indicated times were analyzed by IB. (D) Total levels of β-catenin and FoxM1 in 293T cells treated with 20 ng/ml Wnt3a for indicated times were analyzed by IB. (E) MD11 spheres were dissociated and plated on coverslips precoated with poly-l-ornithine and fibronectin in serum-free media with EGF and bFGF for 48 hr. The cells were then treated with control PBS or Wnt3a (20 ng/ml) for 4 hr. Cytoplasmic and nuclear levels of FoxM1 and β-catenin in the cells were analyzed by triple IF staining (scale bar, 40 μm). (F) MD11 cells were treated with cycloheximide (CHX, 50 mg/ml) and with or without Wnt3a (20 ng/ml) at the indicated time points. Cell extracts were prepared and analyzed by IB. See also Figure S2.
Figure 3
Figure 3. FoxM1 Is Required for Constitutive and Wnt3a-induced β-Catenin Nuclear Accumulation
(A) Cytoplasmic and nuclear levels of FoxM1 and β-catenin in 293T cells transfected with increasing amounts of the Flag-FoxM1 expression plasmid were analyzed by IB. The cells treated with 20 ng/ml Wnt3a for 60 min were used as a positive control. (B, C) FoxM1–/– NSCs were generated by isolation of primary NSCs (from FoxM1fl/fl mice), which were immortalized with the SV-40 large-T antigen and then infected with Ad-Cre to delete the floxed alleles of FoxM1. Cytoplasmic and nuclear levels of FoxM1 and β-catenin in immortalized FoxM1fl/fl and FoxM1–/– NSCs were analyzed by IF (B) and IB (C). (D) FoxM1–/– or FoxM1+/+ MEFs were immortalized with the SV-40 large-T antigen. They were then treated with Wnt3a (20 ng/ml) for the indicated times. Cytoplasmic and nuclear levels of FoxM1 and β-catenin were analyzed by IB. (E) Nuclear levels of FoxM1 and β-catenin were examined in MD11 and MD20s cells that were treated with two different amounts of the FoxM1 or control siRNA. (F) Nuclear levels of FoxM1 and β-catenin were examined in MD11 and MD20s cells that stably express two different shRNAs for FoxM1 (sh-FoxM1-1 or sh-FoxM1-2) or a control shRNA (sh-control). (G) Triple IF staining for FoxM1 (red), β-catenin (green), and nuclei (DAPI, blue) was performed in sh-FoxM1 and sh-control MD11 cells and in sh-FoxM1 MD11 cells that were transiently transfected with a pcDNA3.1-FoxM1 plasmid. Note that restoration of FoxM1 expression in sh-FoxM1 MD11 cells restores β-catenin nuclear localization (scale bar, 25 μm). (H) MD11 and MD20s cells that stably express sh-FoxM1 or sh-control were treated with 50 ng/ml Wnt3a for 2 hr. IB was performed on cytoplasmic or nuclear extracts.
Figure 4
Figure 4. FoxM1 Nuclear Translocation and Binding to β-Catenin Are Required for FoxM1-Mediated β-Catenin Nuclear Accumulation
(A) Schematic illustration of β-catenin deletion mutants (left panel) and a GST pull-down experiment using bacterially expressed and purified wild-type and mutant β-catenin as GST-fusion proteins and His-FoxM1 (right panel). (B) Schematic illustration of FoxM1 deletion mutants (left panel) and IP using bacterially expressed and purified His-tagged wild-type and mutant FoxM1 proteins and GST-β-catenin (right panel). (C) Schematic illustration of Flag-FoxM1 deletion mutants in a mammalian expression system (left panel). Lysates from 293T cells expressing the Flag-FoxM1 mutants and HA-β-catenin were subjected to IP (right panel). (D) 293T cells expressing Flag-FoxM1 or mutants were processed for triple IF staining for Flag-FoxM1 (red), β-catenin (green), and nuclei (DAPI, blue). White arrows indicate colocalization of FoxM1 and β-catenin in nuclei (scale bar, 10 μm). (E) 293T cells were cotransfected with Flag-FoxM1 or mutants plus the TOP-Flash or control FOP-Flash luciferase reporter. The ratios between TOP-Flash and FOP-Flash were determined 48 hr after transfection, and promoter activation (fold) was calculated relative to that in cells transfected with the control vector. Values are mean ± SD for triplicate samples from a representative experiment.
Figure 5
Figure 5. FoxM1 Activates Wnt/β-Catenin Signaling
(A) IB analysis of cytoplasmic and nuclear levels of β-catenin and FoxM1 in 293T cells that were transfected with a vector (Control), FoxM1 wild-type (WT), or FoxM1 with mutations at Arg-286 and His-287 (R286A/H287A) plasmid. (B) Mutual dependence of FoxM1 and β-catenin in activating the TOP-Flash reporter. FOP-Flash was used as negative control. 293T cells were cotransfected with Flag-FoxM1, β-catenin S33Y, DN-TCF4 expression plasmid, FoxM1-siRNA, or combinations as indicated. Values are mean ± SD for triplicate samples. Cells treated with 20 ng/ml Wnt3a for 12 hr were used as a positive control. (C) Activities of TOP-Flash or FOP-Flash in MD11 and MD20s cells cotransfected with an increasing amount of FoxM1-siRNA. Values are mean ± SD for triplicate samples. (D) Cellular levels of FoxM1, β-catenin, Axin2, LEF-1, and c-Myc in MD20s cells transfected with a vector or FoxM1 expression plasmid were analyzed by IB. (E) Cellular levels of FoxM1, β-catenin, Axin2, LEF-1, and c-Myc in MD11 or MD20s cells transfected with control-siRNA or FoxM1-siRNA were examined by IB. (F) Cellular levels of FoxM1, β-catenin, Axin2, LEF-1, c-Myc, and cyclin D1 in FoxM1-knockout NSCs were examined by IB. (G) Cellular levels of FoxM1, β-catenin, and Axin2 in 293T cells transfected with a vector (control), FoxM1 (WT), or FoxM1 R286A/H287A plasmid. See also Figure S3.
Figure 6
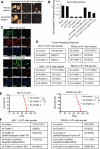
Figure 6. Mutual Recruitment of FoxM1 and β-Catenin to Wnt Target-Gene Promoters
(A) FoxM1 activates the LEF-1 promoter via the WREs. The three WREs of the LEF-1 promoter were mutated to generate the mutant LEF-1 promoter. The relative luciferase activity of wild-type (WT) or mutant (Mut) LEF-1 promoters was determined in 293T cells transfected with the FoxM1 or control vector. Values are mean ± SD for triplicate samples. (B, C) ChIP assays on WREs of LEF-1 promoter or the ORF region of LEF-1 gene were performed in MD11 cells (B) or 293T cells with or without Wnt3a treatment (20 ng/ml) for 6 hr (C). (D) ChIP assays on WREs of Axin2 promoter or the ORF region of Axin2 gene were performed in MD11 cells. (E) A luciferase reporter driven by the c-Myc promoter with wild-type TBEs (pBV-TBE1/2-luc) or mutant TBEs (pBV-TBE1m/2m-luc) was transfected into MD11 cells. Then ChIP assays were performed using PCR primer pairs flanking the c-Myc promoter (on the pBV vector). (F) FoxM1 and β-catenin co-occupied the LEF-1 promoter in MD11 cells. (G, H) ChIP assays were performed in MD11 cells that were transfected with FoxM1-siRNA, β-catenin-siRNA, or control siRNA. (I) Co-IP analyses of β-catenin–TCF4 interaction in 293T cells that were cotransfected withMyc-TCF4 and increasing amounts of FoxM1-siRNA and treated with 20 ng/ml Wnt3a for 6 hr. (J, K) Co-IP analyses of the association of FoxM1 with TCF4 in 293T cells that were cotransfected with Flag-FoxM1, Myc-TCF4, and β-catenin-siRNA (J) or in β-catenin–/– MEFs (K).
Figure 7
Figure 7. FoxM1 and β-Catenin Maintain GIC Self-Renewal and Glioma Formation
(A) Photographs of primary and secondary neurosphere formation of MD11 cells that express shRNAs for control, FoxM1, or β-catenin. Scale bar, 100 μm. (B) The primary and secondary neurosphere formation efficiency (spheres/cells plated) of the cells in (A). Values are mean ± SD for triplicate samples. shR: shRNA-resistant FoxM1 (or its mutant). (C) Dissociated MD11 cells from spheres were plated on coverslips precoated with poly-l- ornithine and fibronectin, and the indicated markers were examined via IF (scale bar, 40 μm). (D, E) MD11 or MD20s cells (5 × 10³ or 1 × 10⁵ cells/mouse) that express the indicated shRNAs were implanted intracranially in nude mice. Mice were killed when they were moribund or 120 days after implantation. Tumor formation was determined by histology. Tumor-initiating frequency was then calculated (D). Survival of mice (n=5) was evaluated by Kaplan-Meier analysis (E). *, p < 0.001. (F) ShRNA-resistant R286A/H287A mutant or β-catenin-NLS rescued the tumor-initiating capacity of GICs that express the FoxM1-shRNA. MD11 or MD20s-shFoxM1 cells (1 × 10⁵ cells/mouse) that express shRNA-resistant FoxM1 wt, shRNA-resistant R286A/H287A, or β-catenin-NLS were implanted intracranially in nude mice. Mice were killed when they were moribund or 70 days after implantation. Tumor-initiating frequency was then calculated. See also Figures S4.
Figure 8
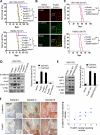
Figure 8. Interaction of FoxM1 and β-Catenin Controls Glioma Formation
(A) The tumorigenicity of SW1783 or Hs683 cells that stably express vector, FoxM1, FoxM1+sh-control, or FoxM1+sh-β-catenin and the survival of the mice were evaluated as described in Figure 7D. *, p < 0.001 and **, p < 0.01. (B) Sections of tumors produced by SW1783-FoxM1 cells or brain tissue from mice injected with SW1783-vector cells were IF-stained with FoxM1 and β-catenin antibodies, followed by confocal microscopic analysis. (C) The tumorigenicity of SW1783 or Hs683 cells that stably express vector, FoxM1 or FoxM1 R286A/H287A and the survival of the mice. *, p < 0.001. (D) Cellular levels of β-catenin, LEF-1, Axin2, c-Myc, and cyclin D1 (left panel) and activities of TOP-Flash or FOP-Flash (right panel) in SW1783 cells that stably express vector, FoxM1, FoxM1+sh-control, or FoxM1+sh-β-catenin. Values are mean ± SD for triplicate samples. (E) Cellular levels of β-catenin, LEF-1, Axin2, c-Myc, and cyclin D1 (left panel) and activities of TOP-Flash or FOP-Flash (right panel) in SW1783 cells that stably express vector, FoxM1, or FoxM1 R286A/H287A. Values are mean ± SD for triplicate samples. (F) Expression of FoxM1 and β-catenin was examined via IHC staining in 40 GBM specimens. Left: Representative β-catenin and FoxM1 expression levels are shown in three GBM tumor sections. Right: Staining of nuclear FoxM1 or β-catenin was scored as 1 to 4. The correlation was significant as determined by Pearson's correlation test (r = 0.682; p < 0.001). See also Figures S5.

Comment in

Similar articles

Cited by

References

    1. Chenn A, Walsh CA. Regulation of cerebral cortical size by control of cell cycle exit in neural precursors. Science. 2002;297:365–369. - PubMed
    1. Clevers H. Wnt/beta-catenin signaling in development and disease. Cell. 2006;127:469–480. - PubMed
    1. Henderson BR, Fagotto F. The ins and outs of APC and beta-catenin nuclear transport. EMBO Rep. 2002;3:834–839. - PMC - PubMed
    1. Hodgson JG, Yeh RF, Ray A, Wang NJ, Smirnov I, Yu M, Hariono S, Silber J, Feiler HS, Gray JW, et al. Comparative analyses of gene copy number and mRNA expression in GBM tumors and GBM xenografts. Neuro Oncol. 2009;11:477–487. - PMC - PubMed
    1. Huang H, He X. Wnt/beta-catenin signaling: new (and old) players and new insights. Curr. Opin. Cell Biol. 2008;20:119–125. - PMC - PubMed

Publication types

MeSH terms