. 2011 Dec;179(6):2952-62.
doi: 10.1016/j.ajpath.2011.08.036. Epub 2011 Oct 18.

Central nervous system fibrosis is associated with fibrocyte-like infiltrates

Affiliations

Central nervous system fibrosis is associated with fibrocyte-like infiltrates

Amy Aldrich et al. Am J Pathol. 2011 Dec.

Abstract

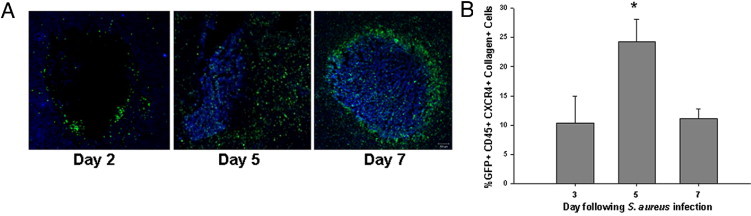
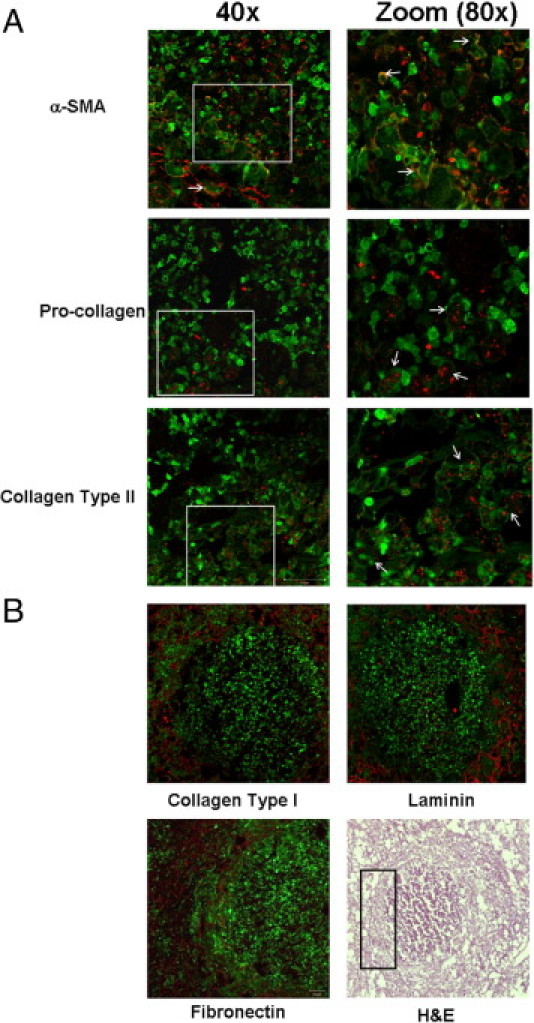
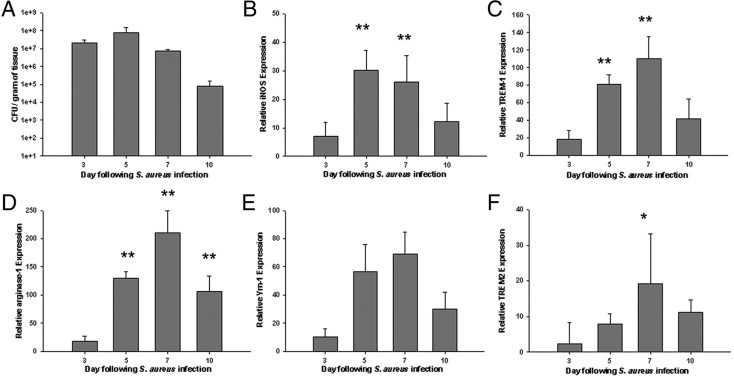
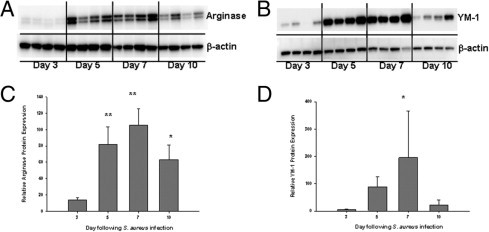
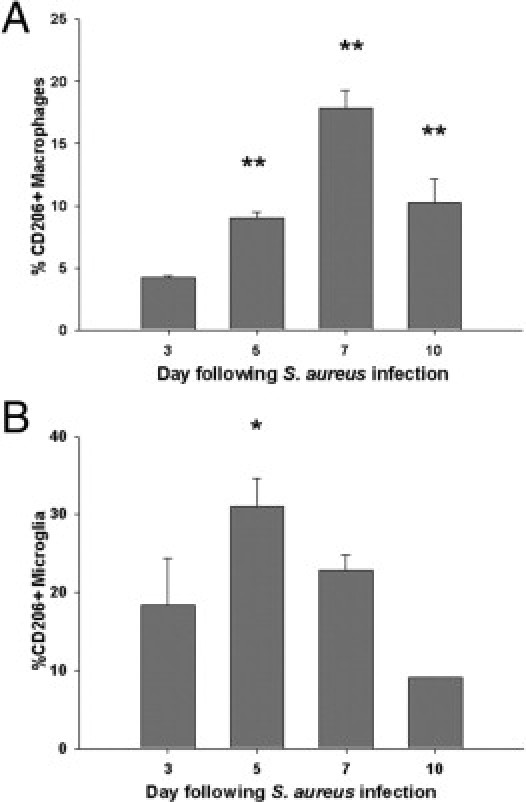
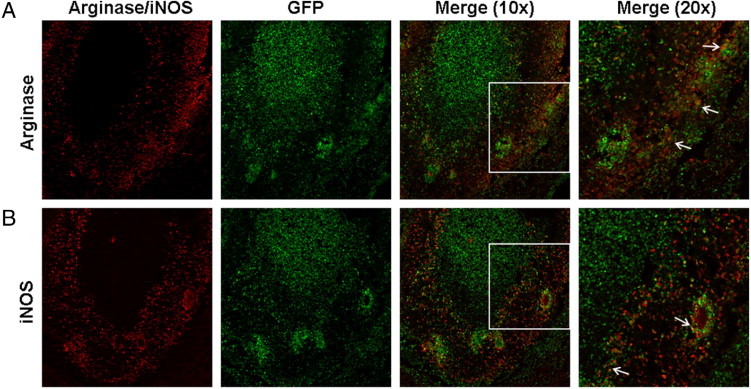
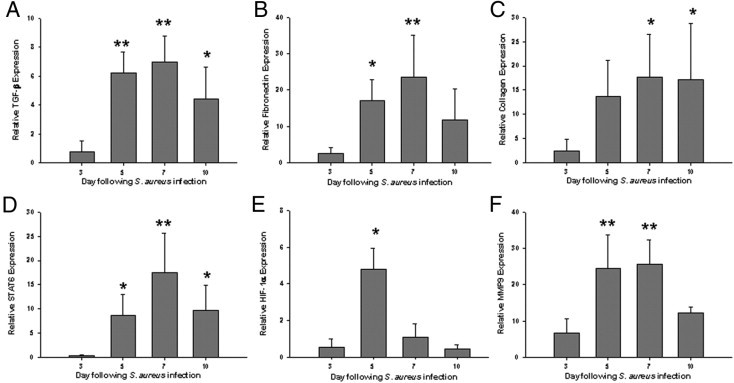
Fibrotic wall formation is essential for limiting pathogen dissemination during brain abscess development. However, little is known about the regulation of fibrotic processes in the central nervous system (CNS). Most CNS injury responses are associated with hypertrophy of resident astrocytes, a process termed reactive gliosis. Studies of fibrosis outside the CNS have identified two bone marrow-derived cell types, fibrocytes and alternatively activated M2 macrophages, as key mediators of fibrosis. The current study used bone marrow chimeras generated from green fluorescent protein transgenic mice to evaluate the appearance of these cell types and whether bone marrow-derived cells were capable of acquiring fibrotic characteristics during brain abscess development. Immunofluorescence staining revealed partial overlap between green fluorescent protein, α-smooth muscle actin, and procollagen, suggesting that a population of cells forming the brain abscess capsule originate from a bone marrow precursor. In addition, the influx of fibrocyte-like cells into brain abscesses immediately preceded the onset of fibrotic encapsulation. Fibrotic wall formation was also associated with increased numbers of alternatively activated M2 microglia and macrophages. To our knowledge, this is the first study demonstrating that bone marrow-derived infiltrates are capable of expressing fibrotic molecules during CNS inflammation.


Figures

Figure 1
Figure 1
Bone marrow derived fibrocyte-like cells infiltrate the brain during abscess formation. Brain abscesses were induced in GFP bone marrow chimera mice to track the appearance and localization of infiltrating bone marrow-derived cells during infection. A: Localization patterns of infiltrating cells differ depending on the stage of infection. B: The kinetics of fibrocyte (GFP+, CD45+, CXCR4+, collagen+) infiltration into brain abscesses was quantified by FACS with results combined from a total of four independent experiments (mean ± SEM). *P < 0.05 versus fibrocyte-like infiltrates at day 3.
Figure 2
Figure 2
Bone marrow–derived cells express fibrosis-associated molecules on entry into the infected CNS. Brain abscesses were induced in GFP bone marrow chimera mice and tissues collected at day 14 following infection for immunofluorescence staining and confocal microscopy. A: Ten-micrometer-thick sections were stained for α-SMA, procollagen, and type II collagen with staining localized along the brain abscess wall. Zoomed images (×80) demonstrated overlap between α-SMA, procollagen, and type II collagen (red) with a subset of GFP+ cells (green; arrows). B: Significant staining for type I collagen, laminin, and fibronectin (red) was also associated with the brain abscess capsule, and a H&E image depicting the region where high-power magnifications of staining were determined is delineated by a rectangle. Results are representative of tissues collected from six individual animals.
Figure 3
Figure 3
Expression kinetics of M1 and M2 activation markers during brain abscess formation. Brain abscesses were induced in C57BL/6 mice and evaluated at the indicated time points after infection for quantitation of bacterial burdens (A), or markers associated with classically activated M1 (B and C) or alternatively activated M2 (DF) macrophages/microglia. Gene expression levels in mice harboring brain abscesses were calculated after normalizing signals against GAPDH and are presented as the fold-change relative to sham animals injected with sterile agarose beads as a control. Results represent the mean ± SD of six to eight individual mice per time point. *P < 0.05, **P < 0.01 versus day 3.
Figure 4
Figure 4
M2 alternative activation marker expression coincides with fibrosis initiation in brain abscesses. Brain abscesses were induced in C57BL/6 mice, whereupon total protein from abscess homogenates was collected at the indicated time points after infection for Western blotting for arginase-1 (A and C) and YM-1 (B and D). Blots were stripped and reprobed with an antibody specific for β-actin to verify uniformity in gel loading. Results are presented from four individual animals per time point and are representative of two independent experiments. *P < 0.05, **P < 0.01 versus day 3.
Figure 5
Figure 5
The appearance of M2 macrophages and microglia coincides with the onset of brain abscess fibrotic wall formation. Brain abscesses were induced in C57BL/6 mice and tissues collected at the indicated time points after infection for quantitation of M2 macrophages (CD11b+, CD45hi) or microglia (CD11b+, CD45lo-intermediate) by FACS using the M2 marker CD206. Results represent the mean ± SEM from four independent experiments. *P < 0.05, **P < 0.01 versus day 3.
Figure 6
Figure 6
Arginase-1 and iNOS expression is localized to discrete domains within brain abscesses. Brain abscesses were induced in GFP bone marrow chimera mice and tissues collected at day 7 following infection for immunofluorescence staining and confocal microscopy. Sections (10 μm) were stained for arginase-1 (A) or iNOS (B) with significant overlap of both markers detected in GFP+ cells (merge). Arrows highlight areas where overlap between the two stains is observed. Results are representative of tissues collected from six individual animals.
Figure 7
Figure 7
The kinetics of fibrosis regulatory signals coincides with the onset of brain abscess encapsulation. Brain abscesses were induced in C57BL/6 mice and evaluated at the indicated time points after infection for quantitation of TGF-β (A), fibronectin (B), type I collagen (C), STAT6 (D), HIF-1α (E), and MMP-9 (F) expression by qPCR. Gene expression levels in mice harboring brain abscesses were calculated after normalizing signals against GAPDH and are presented as the fold-change relative to sham animals injected with sterile agarose beads as a control. Results represent the mean ± SD of six to eight individual mice per time point. *P < 0.05, **P < 0.01 versus day 3.

Similar articles

Cited by

References

    1. Townsend G.C., Scheld W.M. Infections of the central nervous system. Adv Intern Med. 1998;43:403–447. - PubMed
    1. Kielian T., Phulwani N.K., Esen N., Syed M.M., Haney A.C., McCastlain K., Johnson J. MyD88-dependent signals are essential for the host immune response in experimental brain abscess. J Immunol. 2007;178:4528–4537. - PMC - PubMed
    1. Kielian T. Immunopathogenesis of brain abscess. J Neuroinflammation. 2004;1:16. - PMC - PubMed
    1. Flaris N.A., Hickey W.F. Development and characterization of an experimental model of brain abscess in the rat. Am J Pathol. 1992;141:1299–1307. - PMC - PubMed
    1. Hinz B. The myofibroblast: paradigm for a mechanically active cell. J Biomech. 2010;43:146–155. - PubMed

Publication types

MeSH terms

Substances