. 2011 Dec 1;12(12):1280-5.
doi: 10.1038/embor.2011.196.

Fast transcription rates of RNA polymerase II in human cells

Affiliations

Fast transcription rates of RNA polymerase II in human cells

Paolo Maiuri et al. EMBO Rep. .

Abstract

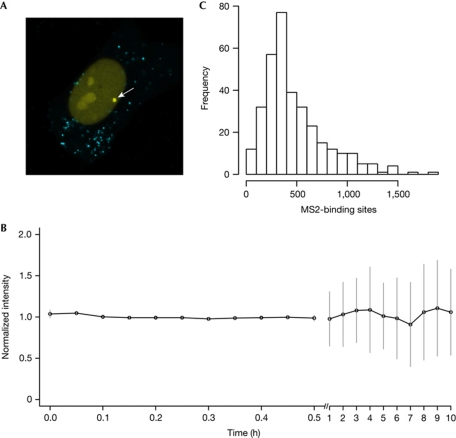
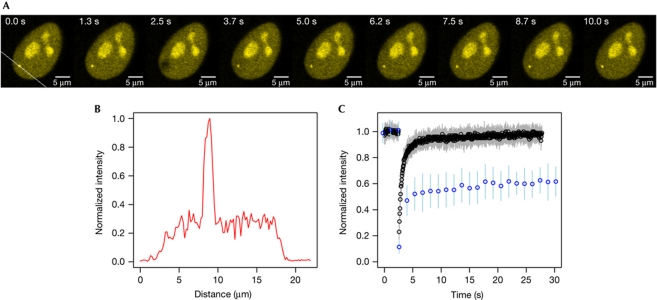
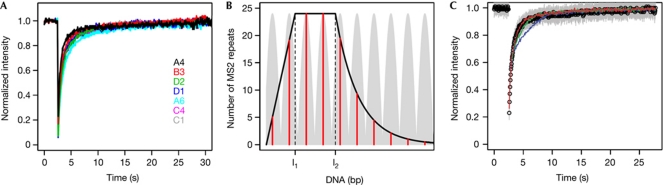
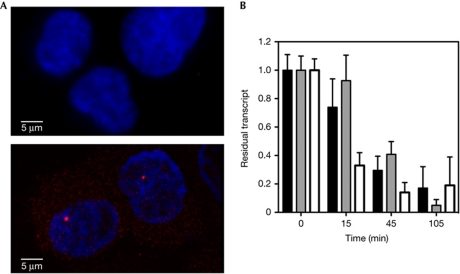
Averaged estimates of RNA polymerase II (RNAPII) elongation rates in mammalian cells have been shown to range between 1.3 and 4.3 kb min(-1). In this work, nascent RNAs from an integrated human immunodeficiency virus type 1-derived vector were detectable at the single living cell level by fluorescent RNA tagging. At steady state, a constant number of RNAs was measured corresponding to a minimal density of polymerases with negligible fluctuations over time. Recovery of fluorescence after photobleaching was complete within seconds, indicating a high rate of RNA biogenesis. The calculated transcription rate above 50 kb min(-1) points towards a wide dynamic range of RNAPII velocities in living cells.


Conflict of interest statement

The authors declare that they have no conflict of interest.

Figures

Figure 1
Figure 1
Quantitative analysis of transcription from a single retroviral transcription unit integrated in a single living cell. (A) The HOS_A4 cell line. When the HOS_A4 clone was activated with Tat, a bright signal (arrow) was clearly visible in the nucleoplasm corresponding to nascent transcripts. The reporter ECFPskl localized to cytoplasmic peroxisomes. (B) Continuous transcription in single cells. The intensity of enhanced yellow fluorescent protein (EYFP) fluorescence at the transcription site was monitored in HOS_A4-expressing MS2–EYFPnls and activated by Tat for 30 min at 5-min intervals. Each acquisition was normalized to the intensity at time zero. Therefore, the figure represents the variability of intensity at steady state independently of the number of polymerases/nascent RNAs. The analysis was then extended for 10 h (N=15; error bars show s.d.). (C) Distribution and quantification of transcripts. Distribution of the number of MS2-binding sites at the transcription site at the steady state was measured in HOS_A4 cells activated by Tat by quantitative in situ hybridization (Boireau et al, 2007; N=337). Data were collected on different transcription sites at the same time point and therefore depend on the number of polymerases/nascent RNAs.
Figure 2
Figure 2
FRAP analysis of the transcription site. (A) Series of frames from a typical fluorescence recovery after photobleaching (FRAP) experiment on HOS_A4 cells. Selected frames from supplementary Video S1 online taken at the indicated time points before and after the bleach are shown. (B) Fluorescence intensity profile of the transcription site. The intensity profile was measured along the white line across the transcription spot of HOS_A4 shown in the first frame of A. (C) Comparative analysis of FRAP recovery curves from single integrations and tandem arrays. Cells carrying a single integration (black circles, N=30; ±s.d., grey bars) or tandem arrays of the same construct (blue circles, N=36; ±s.d., blue bars) were bleached and recovery was monitored up to 30 s. Full recovery of tandem arrays is shown in supplementary Fig S4A online.
Figure 3
Figure 3
An estimate of RNAPII transcription rates. (A) Fluorescence recovery after photobleaching (FRAP) of nascent transcripts from single integrations. Seven HOS clones obtained as described in De Marco et al (2008) were subjected to FRAP analysis after Tat induction. Each of them carries single integrations of the construct mapping in different sites of the genome. The line is the average over 10–40 cells for each clone. (B) The TranWave model. The diagram shows a representation of the TranWave model: a movie of the same is available as supplementary Video S3 online. Light grey indicates the positive travelling wave, black indicates the amplitude and red indicates the position of the sliding maxima. Each red bar represents an RNA polymerase II (RNAPII). L1 and L2 mark the boundaries of the transcribed region after the MS2-binding sites (MS2 BS; L1) and the SA7 (L2). (C) Monte Carlo coupled to TranWave simulations for single integrations. Simulations of different transcription rates at 25 kb min−1 (blue line), 50 kb min−1 (green line) and 100 kb min−1 (red line) with a fixed total number of MS2 BS and a fixed RNA-processing time determined experimentally as shown in Fig 1C and in supplementary Fig S4C online.
Figure 4
Figure 4
(A) RNA in situ hybridization of transcripts. The lentiviral transcript was detected by RNA in situ hybridization in HOS_A4 cells activated by Tat. Two cells are shown with nuclei stained with 4,6-diamidino-2-phenylindole (blue) and messenger RNA (mRNA) stained by Cy3 (red). The transcription site within the nucleus is clearly visible together with granules of mRNA in the nucleus and in the cytoplasm that could be quantified. Cells that where not activated are shown above as background control. (B) Decay rate of mRNA. HOS_A4 cells activated by Tat were treated with actinomycin D (Act-D; 10 μg ml−1) to inhibit transcription. Data are presented as residual transcripts at the indicated time points after Act-D treatment (±s.d.). Black bars in the histogram represent values for the primers mapping in the 5′-end of the transcript, grey bars for those detecting the ECFP gene. The unspliced pre-mRNAs (white bars) are highly unstable on transcription inhibition as expected.

Comment in

Similar articles

Cited by

References

    1. Ardehali MB, Lis JT (2009) Tracking rates of transcription and splicing in vivo. Nat Struct Mol Biol 16: 1123–1124 - PubMed
    1. Bertrand E, Chartrand P, Schaefer M, Shenoy SM, Singer RH, Long RM (1998) Localization of ASH1 mRNA particles in living yeast. Mol Cell 2: 437–445 - PubMed
    1. Bianco PR, Brewer LR, Corzett M, Balhorn R, Yeh Y, Kowalczykowski SC, Baskin RJ (2001) Processive translocation and DNA unwinding by individual RecBCD enzyme molecules. Nature 409: 374–378 - PubMed
    1. Boireau S, Maiuri P, Basyuk E, de la Mata M, Knezevich A, Pradet-Balade B, Bäcker V, Kornblihtt A, Marcello A, Bertrand E (2007) The transcriptional cycle of HIV-1 in real-time and live cells. J Cell Biol 179: 291–304 - PMC - PubMed
    1. Bolte S, Cordelieres FP (2006) A guided tour into subcellular colocalization analysis in light microscopy. J Microsc 224: 213–232 - PubMed

Publication types