Comparative Study
. 2012 May;44(5):857-62.
doi: 10.1249/MSS.0b013e31823d7a2b.

Pulmonary artery and intestinal temperatures during heat stress and cooling

Affiliations
Comparative Study

Pulmonary artery and intestinal temperatures during heat stress and cooling

James Pearson et al. Med Sci Sports Exerc. 2012 May.

Abstract

Purpose: In humans, whole body heating and cooling are used to address physiological questions where core temperature is central to the investigated hypotheses. Core temperature can be measured in various locations throughout the human body. The measurement of intestinal temperature is increasingly used in laboratory settings as well as in athletics. However, it is unknown whether intestinal temperature accurately tracks pulmonary artery blood temperature, the gold standard, during thermal stimuli in resting humans, which is the investigated hypothesis.

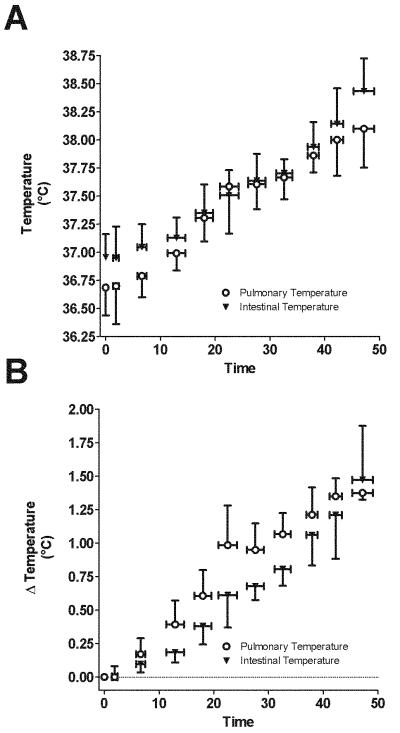
Methods: This study compared pulmonary artery blood temperature (via thermistor in a pulmonary artery catheter) with intestinal temperature (telemetry pill) during whole body heat stress (n = 8), followed by whole body cooling in healthy humans (mean ± SD; age = 24 ± 3 yr, height = 183 ± 8 cm, mass = 78.1 ± 8.2 kg). Heat stress and subsequent cooling were performed by perfusing warm followed by cold water through a tube-lined suit worn by each subject.

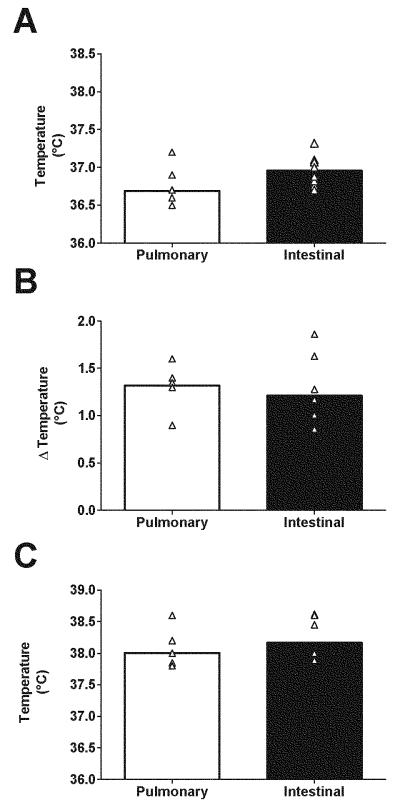
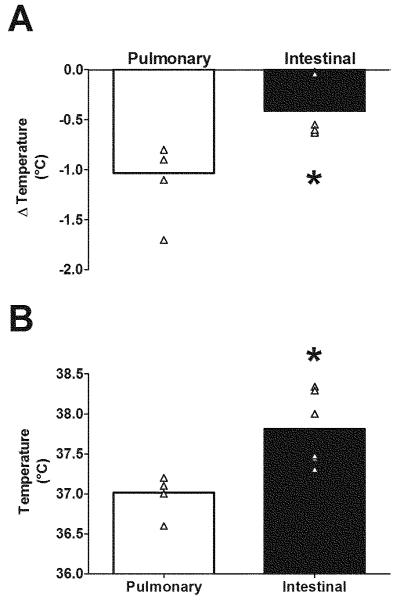
Results: Before heat stress, blood temperature (36.69°C ± 0.25°C) was less than intestinal temperature (36.96°C ± 0.21°C, P = 0.004). The increase in blood temperature after 20 min of heat stress was greater than the intestinal temperature (0.70 ± 0.24 vs 0.47 ± 0.18, P = 0.001). However, the increase in temperatures at the end of heat stress was similar between sites (blood Δ = 1.32°C ± 0.20°C vs intestinal Δ = 1.21°C ± 0.36°C, P = 0.30). Subsequent cooling decreased blood temperature (Δ = -1.03°C ± 0.34°C) to a greater extent than intestinal temperature (Δ = -0.41°C ± 0.30°C, P = 0.04).

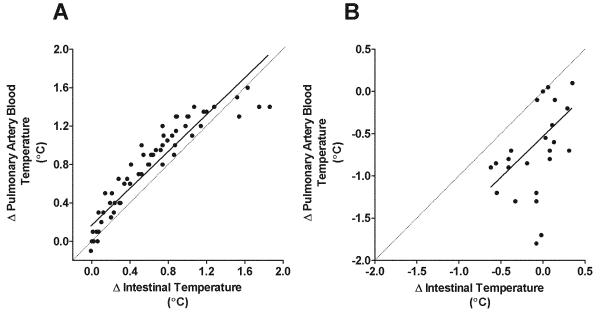
Conclusions: In response to the applied thermal provocations, early temperature changes in the intestine are less than the temperature changes in pulmonary artery blood.


Figures

Figure 1
Figure 1. Core temperatures with heat stress
Pre-heat stress pulmonary artery and intestinal temperatures are illustrated in panel A. Neither the increase in temperatures from pre-heat stress baseline (panel B), nor the actual pulmonary artery and intestinal temperatures at the end of heat stress (panel C), were different between measurement sites at the end of the heat stress (both P > 0.05). Open triangles indicate individual data points while columns depict mean responses. Please note that N=8 for these analyses but some data points are obscured because they overlap other data points.
Figure 2
Figure 2
Time course of the actual (panel A) and delta (panel B) pulmonary artery blood and intestinal temperatures during whole body heating, Data are mean ± SD from 8 subjects. Note that every subject was not heated for the same duration and thus the number of subjects per averaged data point is less than 8 for the final data points. This results in differences in the final temperatures (for both Panel A and B) relative to that depicted in Figure 1.
Figure 3
Figure 3. Limits of agreement between pulmonary artery blood and intestinal temperature during heat stress
Bland-Altman plot of the differences in the elevation in pulmonary artery blood relative to intestinal temperatures throughout the heat stress (pulmonary artery blood – intestinal temperature). This comparison indicates an overall small bias towards elevated pulmonary artery blood temperature (0.17°C) during the heat stress. The upper and lower limits of agreement between pulmonary artery and intestinal temperature across heat stress were −0.18 and 0.53 °C, respectively. See text for discussion of the shape of this curve. Data are from 8 subjects.
Figure 4
Figure 4. Core temperatures with whole body cooling
Following heat stress, subsequent whole body cooling caused a larger reduction in pulmonary artery temperature than intestinal temperature (P = 0.04; Panel A), which resulted in differences in temperatures the end of the cooling stimulus (P = 0.003; Panel B). These data demonstrate that intestinal temperature lags pulmonary artery temperature during rapid cooling of heat stressed individuals. Open triangles indicate individual data points while columns depict mean responses. Please note that N=6 for these analyses but some data points are obscured because they overlap other data points. * denotes a significant difference between temperature measures (P < 0.05).
Figure 5
Figure 5. Changes in core temperature during heat stress and whole body cooling
Throughout the heat stress there was a relatively strong relationship between pulmonary artery and intestinal temperatures (r = 0.93), however, this relationship weakens during subsequent whole body cooling (r = 0.58). Solid line depicts the regression between the indicated values. Dashed line represents the line of identity. Values are from 8 subjects for heat stress and 6 subjects for whole body cooling.

Similar articles

Cited by

References

    1. Armstrong LE, Casa DJ, Millard-Stafford M, Moran DS, Pyne SW, Roberts WO. American College of Sports Medicine position stand. Exertional heat illness during training and competition. Med Sci Sports Exerc. 2007;39(3):556–72. - PubMed
    1. Binkley HM, Beckett J, Casa DJ, Kleiner DM, Plummer PE. National Athletic Trainers’ Association position statement: Exertional heat illnesses. J Athl Train. 2002;37(3):329–43. - PMC - PubMed
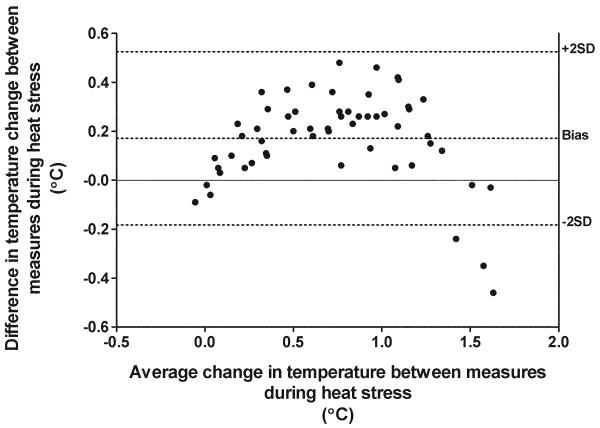
    1. Bland JM, Altman DG. Statistical methods for assessing agreement between two methods of clinical measurement. Lancet. 1986;1(8476):307–10. - PubMed
    1. Bland JM, Altman DG. Calculating correlation coefficients with repeated observations: Part 1--Correlation within subjects. BMJ. 1995;310(6977):446. - PMC - PubMed
    1. Bligh J. Temperature regulation in mammals and other vertebrates. North-Holland; London: 1973. pp. 80–84.

Publication types