

Gestational glucose tolerance and maternal metabolic profile at 3 years postpartum
- PMID: 22015874
- PMCID: PMC3268071
- DOI: 10.1097/AOG.0b013e3182325f5a
Gestational glucose tolerance and maternal metabolic profile at 3 years postpartum
Abstract
Objective: To estimate the independent effect of gestational impaired glucose tolerance, defined as a single abnormal oral glucose tolerance test value, on metabolic dysfunction at 3 years postpartum.
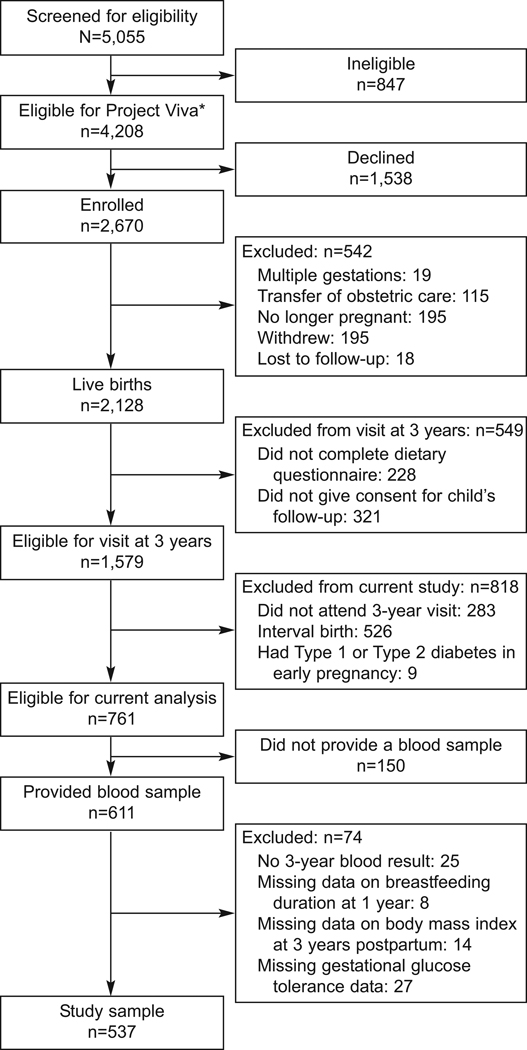
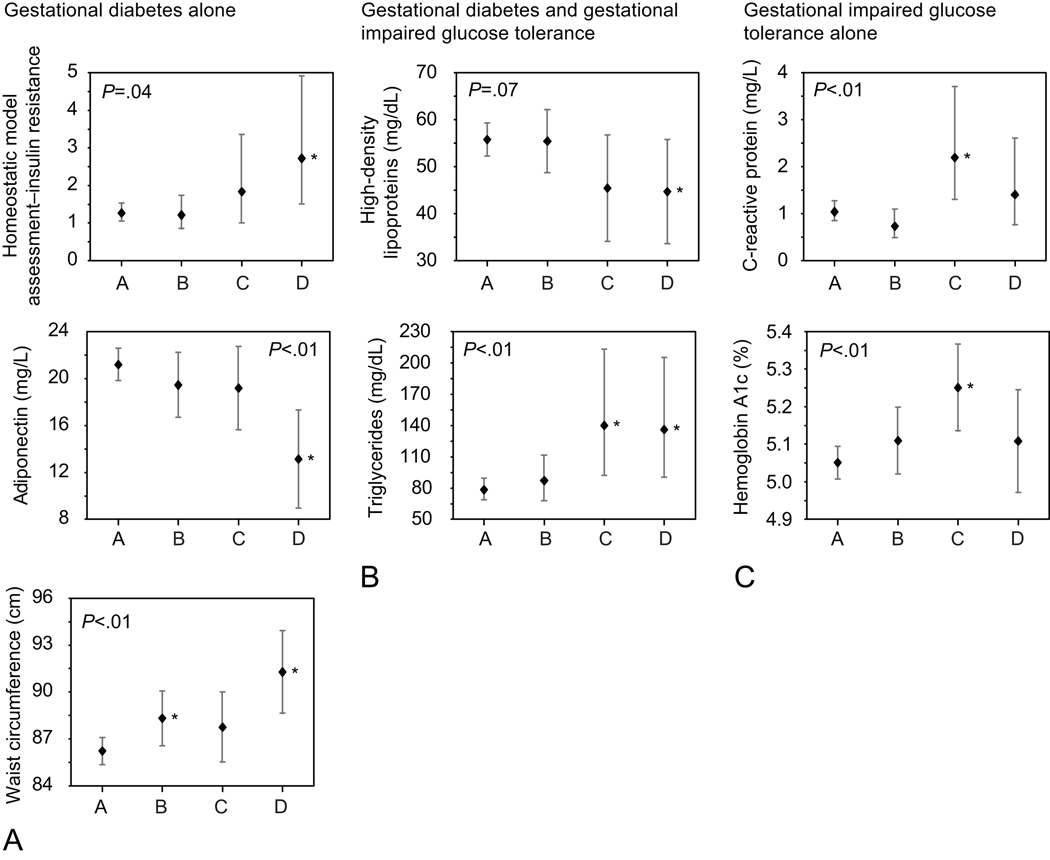
Methods: We used multiple linear regression to measure associations between glucose testing during pregnancy and metabolic markers at 3 years postpartum in Project Viva, a prospective cohort study of maternal and infant health. We compared metabolic measures at 3 years postpartum among four groups: normal glucose challenge test (less than 140 mg/dL, n=461); abnormal glucose challenge test but normal glucose tolerance test (n=39); impaired glucose tolerance (a single abnormal glucose tolerance test value, n=21); and gestational diabetes mellitus (n=16).
Results: Adjusting for age, race, parity, parental history of diabetes, and maternal body mass index at 3 years postpartum, we found women with gestational diabetes mellitus had lower adiponectin (11.2 ng/mL compared with 20.7 ng/mL) and higher homeostatic model assessments of insulin resistance (3.1 compared with 1.3) and waist circumference (91.3 cm compared with 86.2 cm) compared with women with impaired glucose tolerance or normal glucose tolerance. Women in both the impaired glucose tolerance and gestational diabetes mellitus groups had lower high-density lipoprotein (gestational diabetes mellitus 44.7 mg/dL; impaired glucose tolerance 45.4/dL compared with normal glucose tolerance 55.8 mg/dL) and higher triglycerides (gestational diabetes mellitus 136.1 mg/dL; impaired glucose tolerance 140.1 mg/dL compared with normal glucose tolerance 78.3) compared with women in the normal glucose tolerance group. We found the highest values for hemoglobin A1c (gestational diabetes mellitus 5.1%, impaired glucose tolerance 5.3%, normal glucose tolerance 5.1%) and high-sensitivity C-reactive protein (gestational diabetes mellitus 1.4 mg/dL, impaired glucose tolerance 2.2 mg/dL, normal glucose tolerance 1.0 mg/dL) among women with impaired glucose tolerance.
Conclusion: Gestational diabetes mellitus and impaired glucose tolerance during pregnancy are associated with persistent metabolic dysfunction at 3 years postpartum, independent of other clinical risk factors.
Conflict of interest statement
Figures
Similar articles
-
Early postpartum metabolic assessment in women with prior gestational diabetes.Diabetes Care. 1999 Jul;22(7):1053-8. doi: 10.2337/diacare.22.7.1053. Diabetes Care. 1999. PMID: 10388966
-
Hemoglobin A1c and postpartum abnormal glucose tolerance among women with gestational diabetes mellitus.Obstet Gynecol. 2012 Mar;119(3):566-74. doi: 10.1097/AOG.0b013e3182475ac2. Obstet Gynecol. 2012. PMID: 22353955 Free PMC article.
-
Two-day postpartum compared with 4- to 12-week postpartum glucose tolerance testing for women with gestational diabetes.Am J Obstet Gynecol. 2020 Sep;223(3):439.e1-439.e7. doi: 10.1016/j.ajog.2020.05.036. Epub 2020 May 26. Am J Obstet Gynecol. 2020. PMID: 32470456
-
[Gestational diabetes mellitus].Wien Klin Wochenschr. 2016 Apr;128 Suppl 2:S103-12. doi: 10.1007/s00508-015-0941-1. Wien Klin Wochenschr. 2016. PMID: 27052232 Review. German.
-
[Gestational diabetes mellitus (Update 2019)].Wien Klin Wochenschr. 2019 May;131(Suppl 1):91-102. doi: 10.1007/s00508-018-1419-8. Wien Klin Wochenschr. 2019. PMID: 30980150 Review. German.
Cited by
-
Effect of Breastfeeding and Its Duration on Impaired Fasting Glucose and Diabetes in Perimenopausal and Postmenopausal Women: Korea National Health and Nutrition Examination Survey (KNHANES) 2010-2019.Medicines (Basel). 2021 Nov 12;8(11):71. doi: 10.3390/medicines8110071. Medicines (Basel). 2021. PMID: 34822368 Free PMC article.
-
No role of the third-trimester inflammatory factors in the association of gestational diabetes mellitus with postpartum cardiometabolic indicators.BMC Pregnancy Childbirth. 2024 May 15;24(1):361. doi: 10.1186/s12884-024-06563-3. BMC Pregnancy Childbirth. 2024. PMID: 38750471 Free PMC article.
-
Gestational Glucose Intolerance and Risk of Future Diabetes.Diabetes Care. 2023 Jan 1;46(1):83-91. doi: 10.2337/dc22-1390. Diabetes Care. 2023. PMID: 36473077 Free PMC article.
-
Racial/ethnic disparities in the prevalence of gestational diabetes mellitus by BMI.Diabetes Care. 2012 Jul;35(7):1492-8. doi: 10.2337/dc11-2267. Epub 2012 May 22. Diabetes Care. 2012. PMID: 22619080 Free PMC article.
-
Cohort profile: project viva.Int J Epidemiol. 2015 Feb;44(1):37-48. doi: 10.1093/ije/dyu008. Epub 2014 Mar 16. Int J Epidemiol. 2015. PMID: 24639442 Free PMC article.
References
-
- Kim C, Newton KM, Knopp RH. Gestational diabetes and the incidence of type 2 diabetes: a systematic review. Diabetes Care. 2002;25(10):1862–1868. - PubMed
-
- Heitritter SM, Solomon CG, Mitchell GF, Skali-Ounis N, Seely EW. Subclinical inflammation and vascular dysfunction in women with previous gestational diabetes mellitus. J Clin Endocrinol Metab. 2005 Jul;90(7):3983–3988. - PubMed
-
- The Hapo Study Cooperative Research Group. Hyperglycemia and Adverse Pregnancy Outcomes. The New England journal of medicine. 2008 May 8;358(19):1991–2002. 2008. - PubMed
Publication types
MeSH terms
Grants and funding
LinkOut - more resources
Full Text Sources
Other Literature Sources
Medical
Research Materials
