

Review
doi: 10.1038/nrd3578.
Perspectives and opportunities for nanomedicine in the management of atherosclerosis
Affiliations
- PMID: 22015921
- PMCID: PMC3623275
- DOI: 10.1038/nrd3578
Item in Clipboard
Review
Perspectives and opportunities for nanomedicine in the management of atherosclerosis
Nat Rev Drug Discov.
.
Erratum in
- Nat Rev Drug Discov. 2011 Dec;10(12):963
Abstract
The use of nanotechnology for medical purposes--nanomedicine--has grown exponentially over the past few decades. This is exemplified by the US Food and Drug Administration's approval of several nanotherapies for various conditions, as well as the funding of nanomedical programmes worldwide. Although originally the domain of anticancer therapy, recent advances have illustrated the considerable potential of nanomedicine in the diagnosis and treatment of atherosclerosis. This Review elaborates on nanoparticle-targeting concepts in atherosclerotic disease, provides an overview of the use of nanomedicine in atherosclerosis, and discusses potential future applications and clinical benefits.
Figures
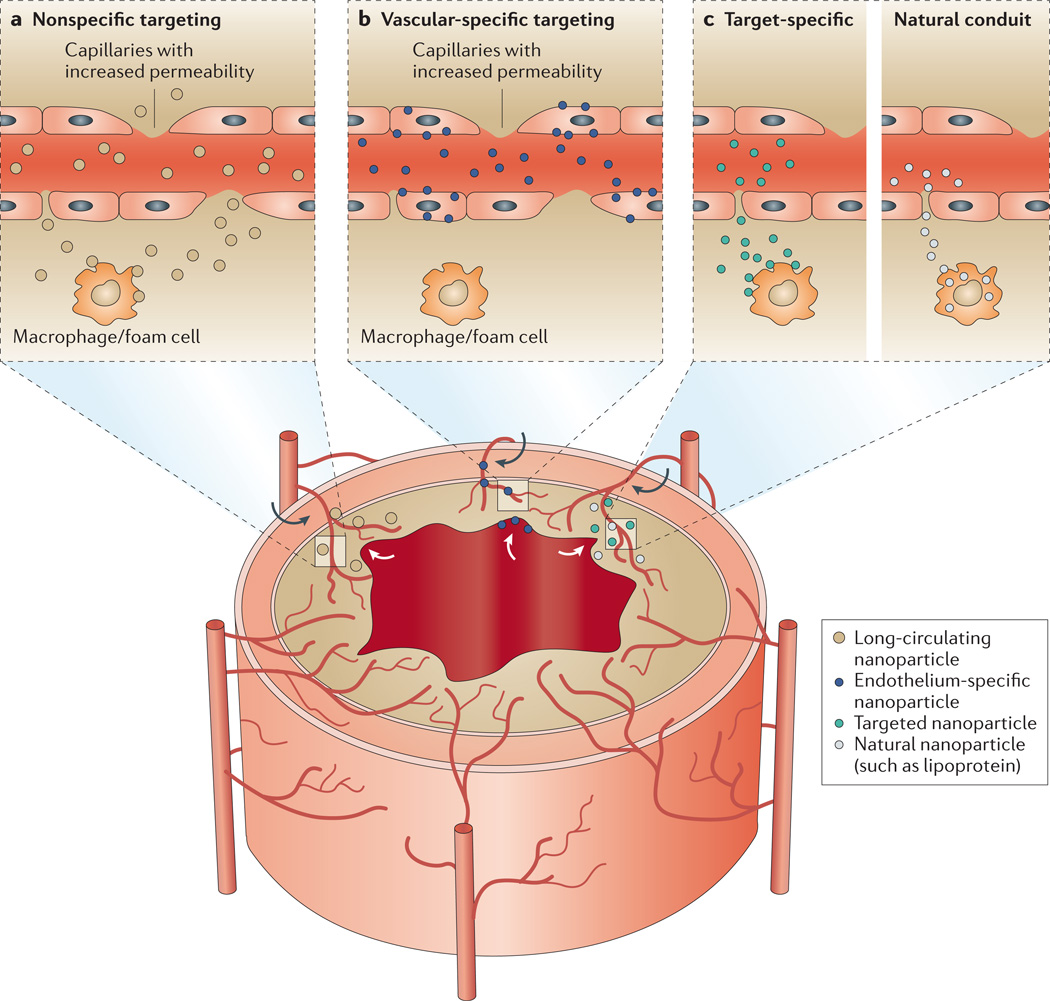
The vessel walls of larger arteries are supplied with nutrients by the lumen and the vasa vasorum — a network of small microvessels. In the lesioned vessel wall the vasa vasorum undergoes angiogenic expansion, with neovessels reaching into the base of the plaque, which is accompanied by the upregulation of cell-surface receptors and increased permeability of the endothelium. The upregulation of receptors and the increased permeability also affect the endothelium on the luminal side of the plaque. The main targeting principles can be classified into nonspecific targeting of the plaque (part a), specific targeting of the vasculature (part b) and specific targeting of components (part c) of the plaque (for example, the extracellular matrix or macrophages) with either synthetic nanoparticles or via interaction through a natural conduit. The targeting of the plaque occurs via both the vasa vasorum and the main lumen at lesioned sites, and is exemplified on the figure with corresponding arrows. Depending on the targeting principle applied, the cellular distribution of nanoparticles in the plaque will vary considerably.
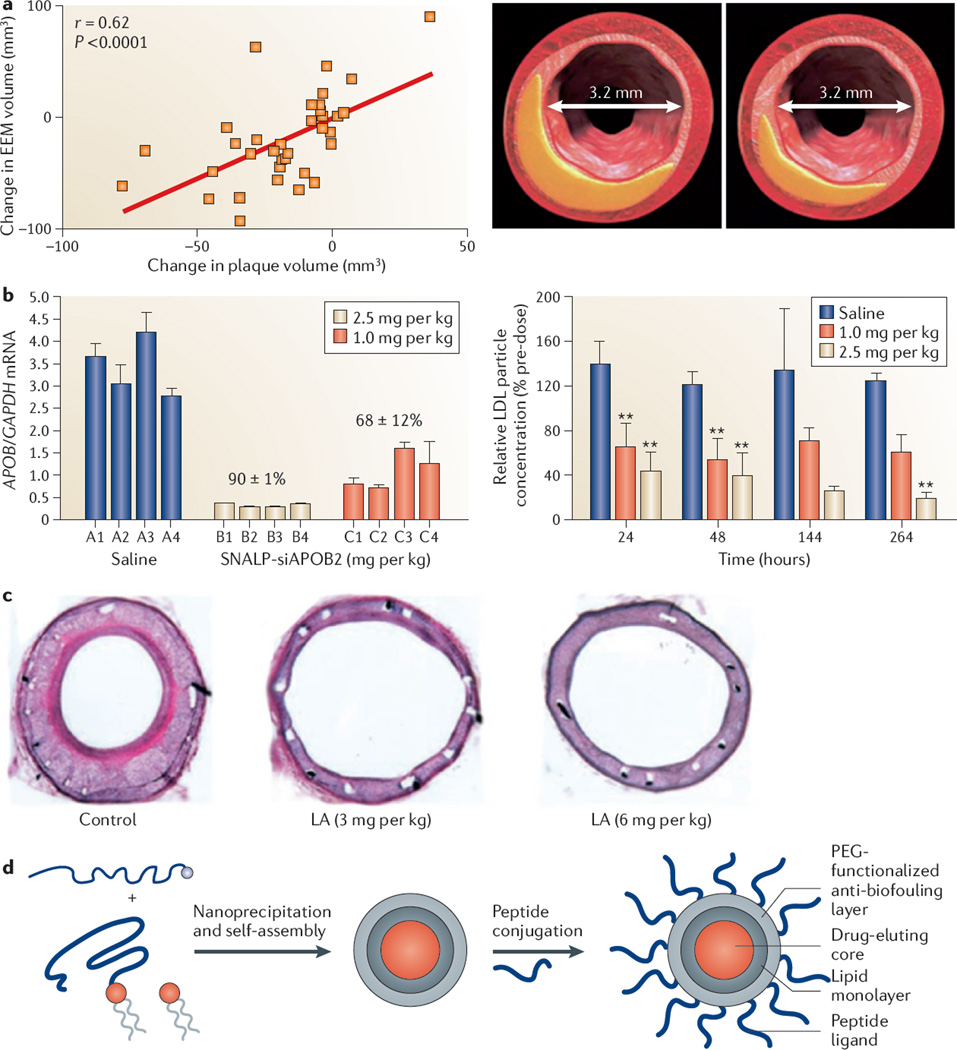
a | Administration of high-density lipoprotein to patients 2 weeks after an acute coronary syndrome leads to coronary plaque regression, shown with representative cross-sectional intravascular ultrasound images of matched arterial segments at baseline (left) and follow-up (right). The graph represents the correlation between the change in external elastic membrane (EEM) volume and the change in plaque volume. There was a concomitant reduction in the EEM volume but no change in the lumen size after 2 weeks. b | The effect of systemic silencing of apolipoprotein B (APOB) mRNA in non-human primates is shown. The graph on the left shows apolipoprotein B (APOB) mRNA levels quantified relative to glyceraldehydes-3-phosphate dehydrogenase (GAPDH) mRNA in biopsy samples from the liver of four non-human primates per group, which are individually numbered (A1–C4), 2 days after treatment with stable nucleic acid lipid particles (SNALPs) encapsulating APOB-specific small interfering RNA (siAPOB2). Data are mean values for each animal. The percentage values above the groups reflect the mean values of the percentage reduction in APOB mRNA compared to saline treatment. The graph on the right shows serial plasma samples of low-density lipoprotein (LDL) obtained from non-human primates treated with saline or liposome-encapsulated small interfering RNA. Asterisks indicate clinical significance compared with the saline-treated group. c | In-stent restenosis is reduced in rabbit iliac artery stents after liposomal alendronate (LA) injection, which is administered concurrently with stent implantation. d | A schematic is shown, illustrating the self-assembly of lipids and a drug-conjugated polymer (left), which results in a hybrid nanoparticle with a slow drug-eluting polymer core and a lipid corona (middle), which is subsequently functionalized with peptide ligands (right). This nanoparticle platform can potentially be used to target injured vasculature for the prevention of in-stent restenosis. PEG, polyethylene glycol. Panel a is modified, with permission, from REF. © (2006) American College of Cardiology. Panel b is modified, with permission, from REF. © (2006) Macmillan Publishers Ltd. All rights reserved. Panel c is modified, with permission, from REF. © (2003) American Heart Association. Panel d is modified, with permission, from REF. © (2010) National Academy of Sciences, USA.
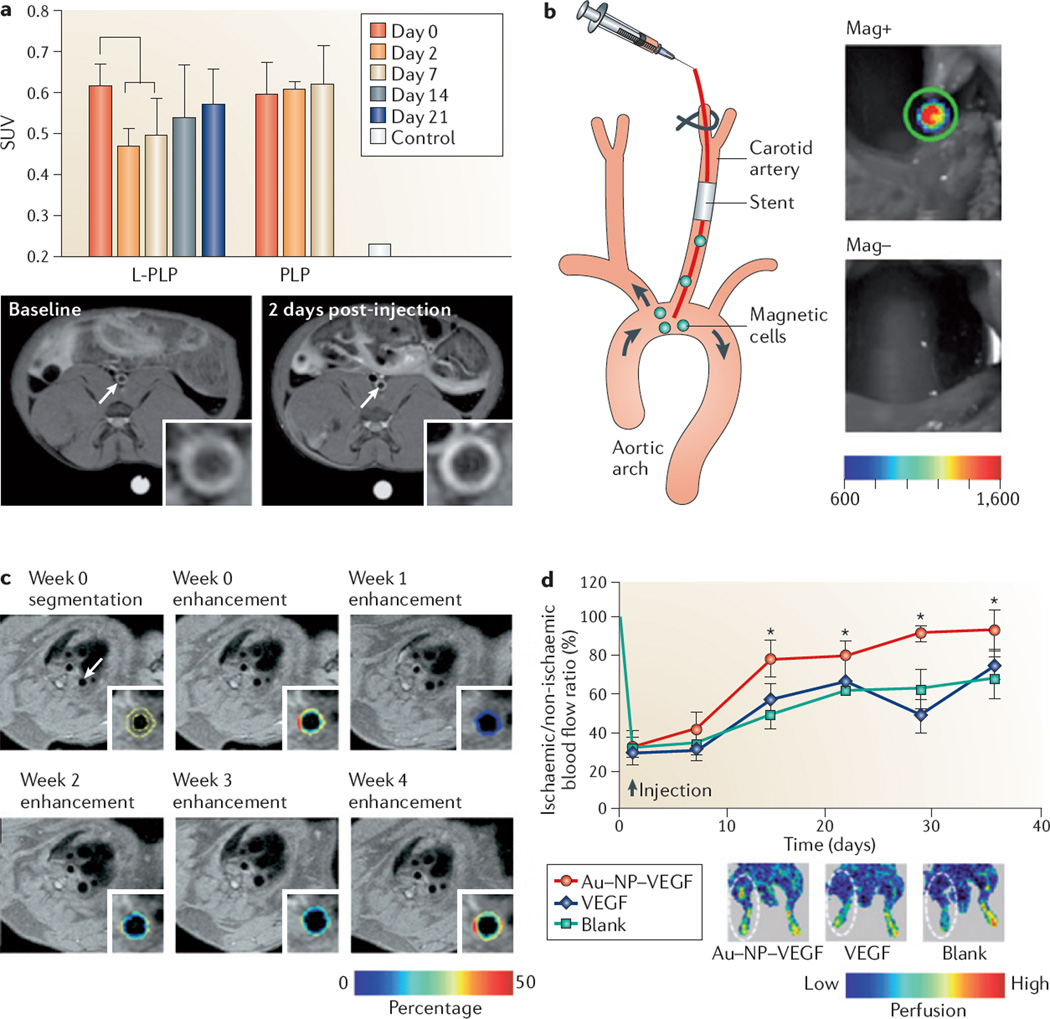
a | The graph shows the therapeutic efficacy of a single intravenous injection of liposome-encapsulated prednisolone phosphate (L-PLP) compared to intravenous injection of prednisolone phosphate (PLP), measured by the standard uptake value (SUV), using 18F-fludeoxyglucose in combination with positron emission tomography and computed tomography. SUV is the corrected tissue concentration divided by the injected dose per body weight. Statistically significant improvements in therapeutic effect can be seen after 2 days, lasting up to 7 days. Below the graph, magnetic resonance imaging (MRI) scans of gadolinium-labelled PLP show signal enhancement in a rabbit atherosclerotic abdominal aorta (depicted on the image with a white arrow) following the injection of liposomes (the image on the right and inset) compared to the baseline scan (the image on the left and inset). b | The figure shows an experimental setup of rats with stainless steel stents in their carotid arteries; these rats were intra-arterially injected with superparamagnetic fluorescent nanoparticles that were preloaded into endothelial cells for the purpose of re-endothelialization. The rats were subsequently exposed to a homogenous magnetic field and showed high uptake of cells within the stent, which was detected with intravital bioluminescence imaging. The image at the top represents treatment in the presence of a magnetic field (Mag+), whereas the image at the bottom represents treatment without a magnetic field (Mag−). c | The images represent molecular imaging of angiogenesis by MRI, with segmentation of the aortic wall and colour-coded signal enhancement before and after the administration of anti-angiogenic perfluorocarbon nanoparticles targeting αVβ3 integrin. The colour-coded overlay indicating the percentage of signal enhancement shows a decrease in the signal after 1 week, which gradually increases after 2 and 3 weeks of treatment; after 4 weeks the level of signal enhancement is almost identical to the image taken at week 0. d | Therapeutic angiogenesis in a murine ischaemic hindlimb model is shown, using the delivery of exogenous vascular endothelial growth factor (VEGF) conjugated to nanoparticles. The graph represents a quantitative analysis of tissue blood perfusion in the murine model over 5 weeks. A statistically significant higher blood flow perfusion was observed following the injection of VEGF-conjugated gold nanoparticles (Au–NP–VEGF) as compared to free VEGF or no treatment (blank). The insets show representative images of laser Doppler perfusion imaging. Panel a is modified, with permission, from REF. © (2010) American Chemical Society. Panel b is modified, with permission, from REF. © (2008) National Academy of Sciences, USA. Panel c is modified, with permission, from REF. © (2008) American College of Cardiology. Panel d is modified, with permission, from REF. © (2011) American Chemical Society.
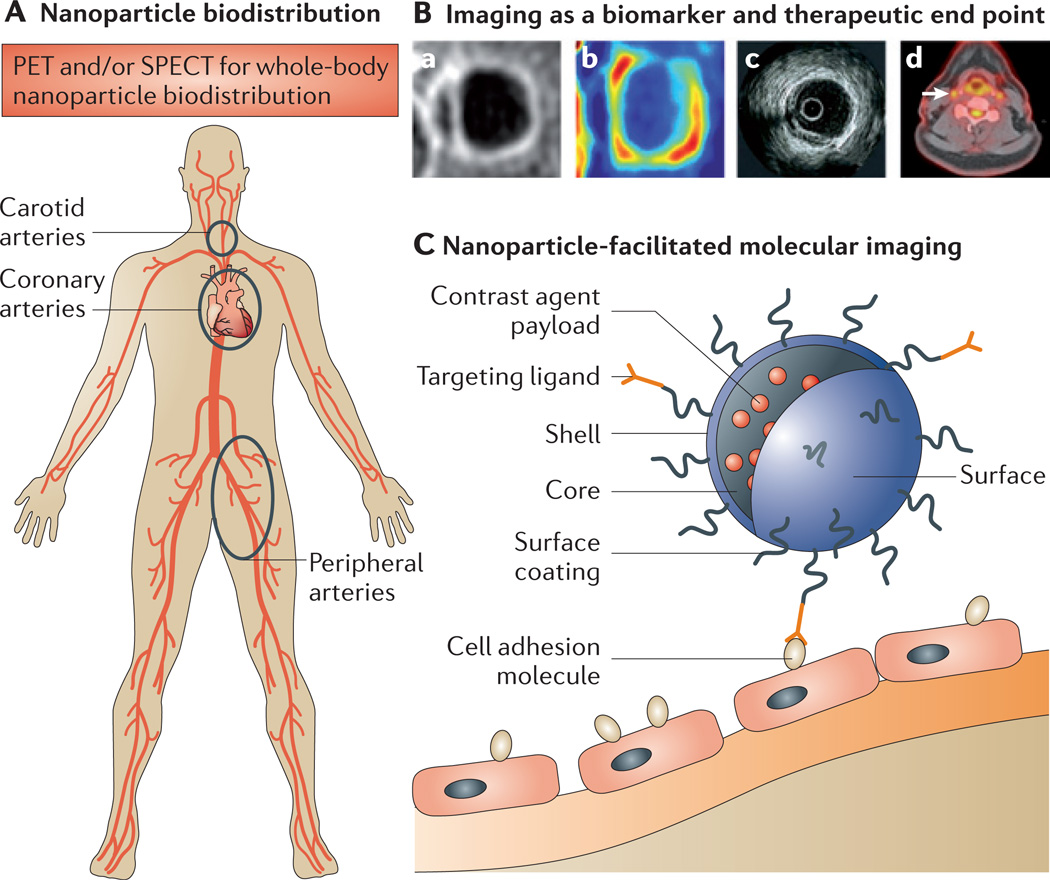
This figure provides examples of the ways in which imaging is associated with nanomedicine. A | The figure depicts the systemic arterial vasculature, highlighting the carotid arteries, coronary arteries and peripheral arteries, which are prone to developing vulnerable lesions that can be visualized by imaging. B | State-of-the-art imaging techniques that are used to visualize plaque morphology and plaque processes are shown. Ba | The image shows a T1-weighted contrast-enhanced magnetic resonance imaging (MRI) scan of a carotid artery, showing thickening of the arterial wall. MRI can provide information on anatomical features and can be used to differentiate between the fibrous cap and lipid core. Bb | The image depicts the same carotid vessel illustrated in part Ba, which has been assessed using dynamic contrast-enhanced MRI; this imaging technique provides information on vascular permeability and neovascularization. Bc | An intravascular ultrasound image is shown in the figure; intravascular ultrasound imaging can be used to obtain information on plaque area within coronary arteries in response to treatment. Bd | A fused image, obtained using 18F-fludeoxyglucose imaging in combination with positron emission tomography (PET) and computed tomography imaging, is shown. The white arrow in the image points to the right carotid artery, showing a high amount of signal, which is indicative of metabolic activity within an atherosclerotic plaque. C | The figure shows a nanoparticle attaching to an endothelial cell lining the atherosclerotic plaque. The contrast payload within the nanoparticle can render it detectable by an imaging modality of choice. SPECT, single-photon emission computed tomography. Image Bc is modified, with permission, from REF. © (2006) American College of Cardiology.
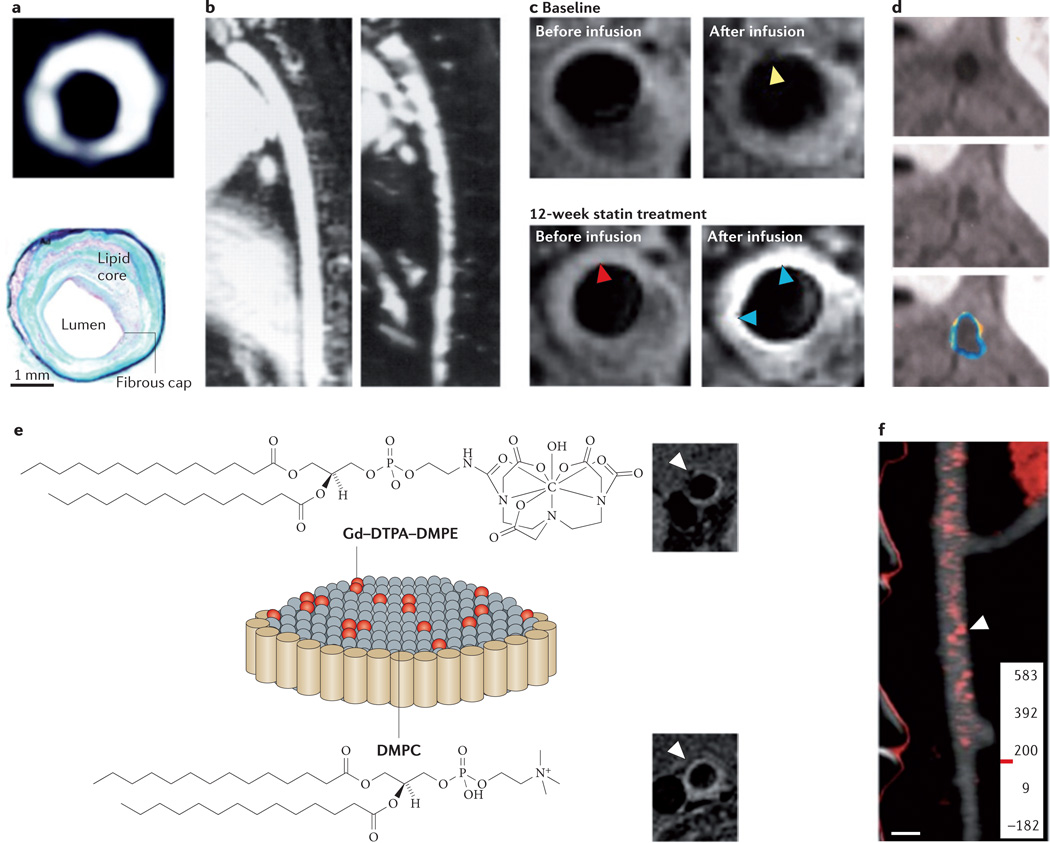
a | The image at the top of the panel, obtained by magnetic resonance imaging (MRI), shows the abdominal aorta of an atherosclerotic rabbit 24 hours after gadofluorine injection; as illustrated by the image, plaque enhancement is observed after injection. The appearance of the image closely correlates with the corresponding histopathological section (shown at the bottom of the panel). b | An MRI scan of a hyperlipidaemic rabbit aorta is shown on the left of the panel. The image on the right is taken from the same rabbit model 5 days after the intravenous injection of ultrasmall superparamagnetic particles of iron oxide (USPIOs). Signal voids can be seen within the vessel wall, representing the uptake of iron oxide in plaque-embedded macrophages. c | MRI scans of the left common carotid artery are shown, before and after USPIO infusion at baseline and after 12 weeks of statin treatment. Pre-USPIO imaging remains very similar in both time points, indicating that USPIOs from the baseline imaging session were not present in the plaque at 12 weeks. Signal enhancement (indicated by the blue arrowheads on the image) can be seen after 12 weeks of treatment, with no evidence of signal voids. The yellow arrowheads indicate signal void due to USPIO accumulation. The red arrowheads indicate that USPIO was not retained in the plaque, as the signal void at 12 weeks is not appreciable anymore. d | Molecular imaging of atherosclerotic plaque angiogenesis with perfluorocarbon nanoparticles targeting αVβ3 integrin is shown. MRI scans of the hyperlipidaemic rabbit aorta pre-injection of perfluorocarbon nanoparticles (at the top of the panel) and post-injection (in the middle of the panel) are shown, along with colour-coded signal enhancement (at the bottom of the panel). e | The figure shown is a schematic depiction of a discoidal high-density lipoprotein agent with gadolinium–lipid incorporated in the phospholipid coating. Representative MRI scans of the aorta of apolipoprotein E knockout mice are shown pre-injection of a high-density lipoprotein agent (at the top of the panel) and 24 hours post-injection (at the bottom of the panel). f | The image shows a computed tomography scan of regions in which high densities (shown in red) of the contrast agent N1177 have accumulated in an atherosclerotic rabbit aorta 2 hours after injection of N1177. DMPC, dimyristoylphosphatidylcholine; DMPE, dimyristoylphosphatidylethanolamine; DTPA, diethylenetriamine pentaacetic acid; Gd, gadolinium. Panel a is modified, with permission, from REF. © (2004) American Heart Association. Panel b is modified, with permission, from REF. © (2001) American Heart Association. Panel c is modified, with permission, from REF. © (2009) American College of Cardiology. Panel d is modified, with permission, from REF. © (2003) American Heart Association. Panel e is modified, with permission, from REF. © (2009) American Chemical Society. Panel f is modified, with permission, from REF. © (2007) Macmillan Publishers Ltd. All rights reserved.
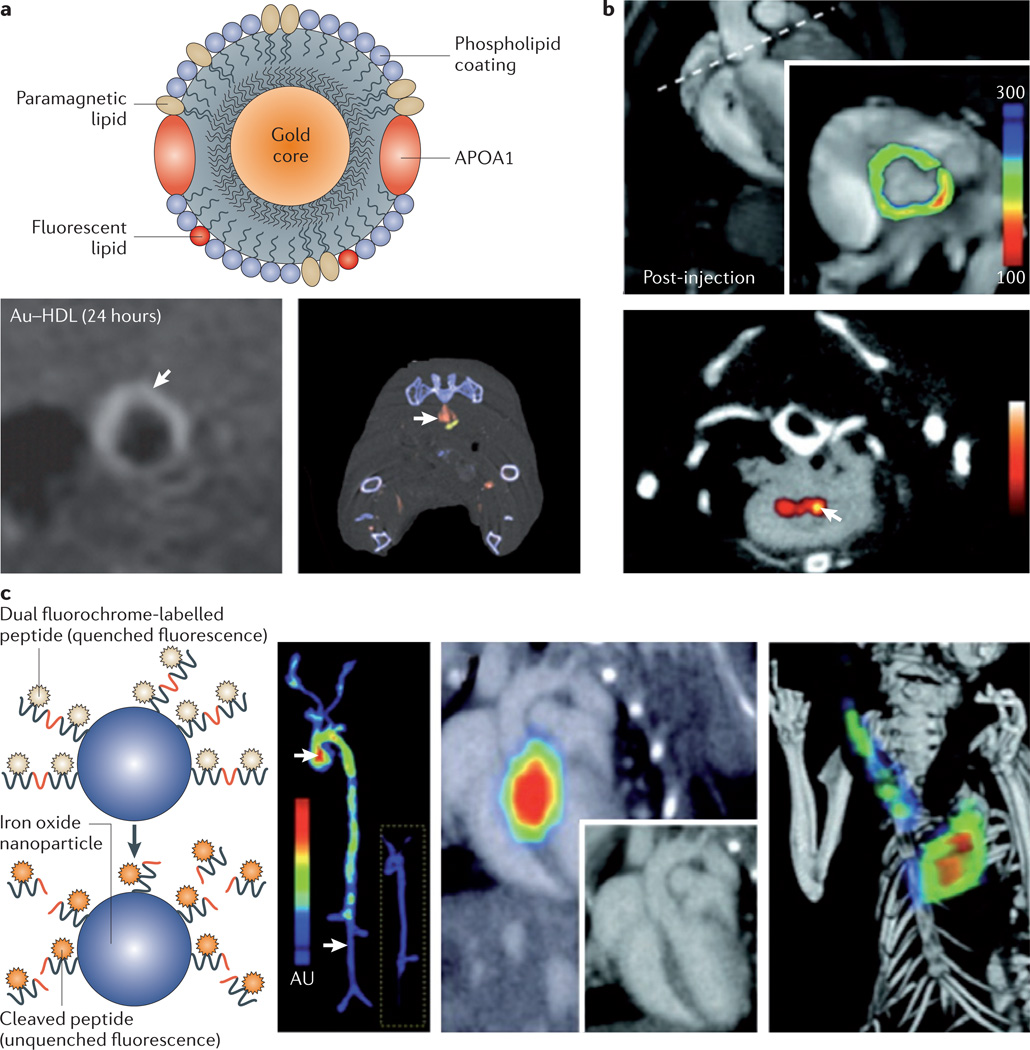
a | A schematic illustration of a gold-core high-density lipoprotein (Au–HDL) nanoparticle is shown, with different components highlighted. The gold core can be replaced by iron oxides or quantum dots to enable magnetic resonance imaging (MRI) and optical imaging. The MRI scan (shown in the bottom left of the panel) shows signal enhancement in the abdominal aorta of an apolipoprotein E (APOE)-knockout mouse 24 hours after injection of the Au-HDL nanoparticle. A spectral computed tomography (CT) image is shown (in the bottom right of the panel) of the aorta of an APOE-knockout mouse injected with the Au–HDL nanoparticle and an iodinated emulsion contrast agent. The gold colour in the scan represents Au–HDL accumulation in the macrophage-rich atherosclerotic plaque, and the red colour represents the iodinated emulsion. The components can clearly be differentiated. b | The image at the top of the panel, obtained using positron emission tomography (PET)–CT shows signal enhancement in the posterior aortic root of an APOE-knockout mouse after the injection of a magnetofluorescent nanoparticle labelled with the radiolabelled PET tracer 64Cu. The MRI scan at the bottom of the panel shows substantial contrast enhancement in the aortic root 48 hours after injection of the nanoparticle. c | A scheme of probe design is illustrated. The first panel shows a fluorochrome-labelled peptide that is conjugated to a polymeric nanoparticle with an iron oxide core. When it is uncleaved the fluorochrome is quenched and does not emit a signal. In the presence of active proteases the fluorochrome is cleaved and liberated from the nanoparticle — it is consequently unquenched and thereby emits fluorescence. The second panel shows excised aortas from an APOE-knockout mouse and a wild-type mouse (inset) 24 hours after the injection of a protease sensor; the images are obtained via fluorescence reflectance imaging. The signal intensity is substantially higher in vascular areas with the plaque than in areas without the plaque. The skeletal and vascular anatomy of an APOE-knockout mouse injected with respective protease sensors is shown in the third panel (via in vivo fluorescence molecular tomography (FMT)–CT imaging with two-dimensional FMT–CT (long-axis view)) and in the fourth panel (via three-dimensional maximum-intensity projection).The fluorescence signal is observed in the aortic root and arch, and additional activation of the sensor is observed in the carotid artery. Panel a is modified, with permission, from REF. © (2008) American Chemical Society, and from REF. © (2010) Radiological Society of North America. Panel b is modified, with permission, from REF. © (2008) American Heart Association. Panel c is modified with permission from REF. © (2009) American Heart Association.
References
-
- Moghimi SM, Hunter AC, Murray JC. Nanomedicine: current status and future prospects. FASEB J. 2005;19:311–330. - PubMed
-
- Wagner V, Dullaart A, Bock AK, Zweck A. The emerging nanomedicine landscape. Nature Biotech. 2006;24:1211–1217. - PubMed
-
- Kim BY, Rutka JT, Chan WC. Nanomedicine. N. Engl. J. Med. 2010;363:2434–2443. - PubMed
-
- Nagarajan R, Hatton TA, editors. Nanoparticles: Synthesis, Stabilization, Passivation, and Functionalization. American Chemical Society; Washington DC: 2008. pp. 2–14.
Publication types
MeSH terms
Grants and funding
LinkOut - more resources
Full Text Sources
Other Literature Sources
Medical
Miscellaneous
