

Expression and function of dopamine receptors in the developing medial frontal cortex and striatum of the rat
- PMID: 22015925
- PMCID: PMC3253459
- DOI: 10.1016/j.neuroscience.2011.10.004
Expression and function of dopamine receptors in the developing medial frontal cortex and striatum of the rat
Abstract
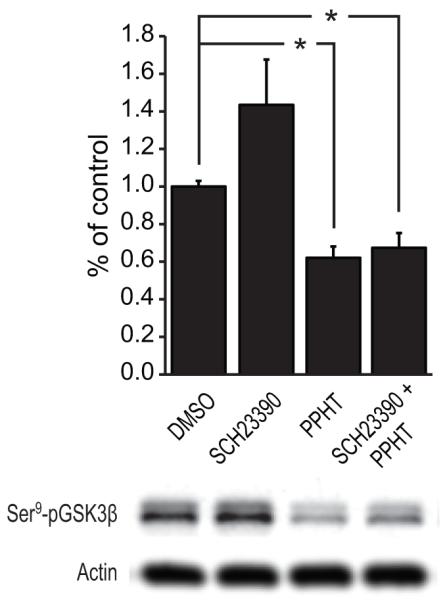
The timeline of dopamine (DA) system maturation and the signaling properties of DA receptors (DRs) during rat brain development are not fully characterized. We used in situ hybridization and quantitative PCR to map DR mRNA transcripts in the medial frontal cortex (mFC) and striatum (STR) of the rat from embryonic day (E) 15 to E21. The developmental trajectory of DR mRNAs revealed distinct patterns of DA receptors 1 and 2 (DRD1, DRD2) in these brain regions. Whereas the mFC had a steeper increase in DRD1 mRNA, the STR had a steeper increase in DRD2 mRNA. Both DR mRNAs were expressed at a higher level in the STR compared with the mFC. To identify the functional properties of DRs during embryonic development, the phosphorylation states of cyclic AMP response element binding protein, extracellular signal-regulated kinase 1/2, and glycogen synthase kinase 3 beta were examined after DR stimulation in primary neuronal cultures obtained from E15 and E18 embryos and cultured for 3 days to ensure a stable baseline level. DR-mediated signaling cascades were functional in E15 cultures in both brain regions. Because DA fibers do not reach the mFC by E15, and DA was not present in cultures, these data indicate that DRs can become functional in the absence of DA innervation. Because activation of DR signal transduction pathways can affect network organization of the developing brain, maternal exposure to drugs that affect DR activity may be liable to interfere with fetal brain development.
Copyright © 2011 IBRO. Published by Elsevier Ltd. All rights reserved.
Figures


Similar articles
-
Differential effect of self-stimulation on dopamine release and metabolism in the rat medial frontal cortex, nucleus accumbens and striatum studied by in vivo microdialysis.Brain Res. 1992 Mar 6;574(1-2):164-70. doi: 10.1016/0006-8993(92)90813-o. Brain Res. 1992. PMID: 1638391
-
Differential effects of clozapine and haloperidol on dopamine receptor mRNA expression in rat striatum and cortex.Brain Res Mol Brain Res. 1996 Sep 5;41(1-2):241-9. doi: 10.1016/0169-328x(96)00101-5. Brain Res Mol Brain Res. 1996. PMID: 8883957
-
Cocaine exposure during the early postnatal period diminishes medial frontal cortex Gs coupling to dopamine D1-like receptors in adult rat.Neurosci Lett. 2008 Jun 20;438(2):159-62. doi: 10.1016/j.neulet.2008.04.014. Epub 2008 Apr 10. Neurosci Lett. 2008. PMID: 18455307 Free PMC article.
-
3-Methoxytyramine is the major metabolite of released dopamine in the rat frontal cortex: reassessment of the effects of antipsychotics on the dynamics of dopamine release and metabolism in the frontal cortex, nucleus accumbens, and striatum by a simple two pool model.J Neurochem. 1994 Sep;63(3):972-9. doi: 10.1046/j.1471-4159.1994.63030972.x. J Neurochem. 1994. PMID: 7914228
-
Dopamine synthesis precedes dopamine uptake in embryonic rat mesencephalic neurons.J Neurochem. 1991 Feb;56(2):392-9. doi: 10.1111/j.1471-4159.1991.tb08164.x. J Neurochem. 1991. PMID: 1671084
Cited by
-
Neurobehavioral changes arising from early life dopamine signaling perturbations.Neurochem Int. 2020 Jul;137:104747. doi: 10.1016/j.neuint.2020.104747. Epub 2020 Apr 20. Neurochem Int. 2020. PMID: 32325191 Free PMC article. Review.
-
Epidermal Growth Factor Receptor Inhibition Reverses Cellular and Transcriptomic Alterations Induced by Hypoxia in the Neonatal Piglet Brain.iScience. 2020 Nov 4;23(12):101766. doi: 10.1016/j.isci.2020.101766. eCollection 2020 Dec 18. iScience. 2020. PMID: 33294779 Free PMC article.
-
Regulation of neural stem cells by innervating neurons.J Neurochem. 2025 Jan;169(1):e16287. doi: 10.1111/jnc.16287. J Neurochem. 2025. PMID: 39775528 Free PMC article. Review.
-
Antipsychotic Induced Dopamine Supersensitivity Psychosis: A Comprehensive Review.Curr Neuropharmacol. 2017;15(1):174-183. doi: 10.2174/1570159x14666160606093602. Curr Neuropharmacol. 2017. PMID: 27264948 Free PMC article. Review.
-
Dopamine-driven increase in IL-1β in myeloid cells is mediated by differential dopamine receptor expression and exacerbated by HIV.J Neuroinflammation. 2025 Mar 23;22(1):91. doi: 10.1186/s12974-025-03403-9. J Neuroinflammation. 2025. PMID: 40122818 Free PMC article.
References
-
- Arnsten AF, Li BM. Neurobiology of executive functions: catecholamine influences on prefrontal cortical functions. Biol Psychiatry. 2005;57:1377–1384. - PubMed
-
- Bahi A, Dreyer JL. Cocaine-induced expression changes of axon guidance molecules in the adult rat brain. Mol Cell Neurosci. 2005;28:275–291. - PubMed
-
- Barzilai A, Melamed E. Molecular mechanisms of selective dopaminergic neuronal death in Parkinson’s disease. Trends Mol Med. 2003;9:126–132. - PubMed
Publication types
MeSH terms
Substances
Grants and funding
LinkOut - more resources
Full Text Sources
Molecular Biology Databases
