

Review
doi: 10.1038/nrm3212.
Imaging the coordination of multiple signalling activities in living cells
Affiliations
- PMID: 22016058
- PMCID: PMC3773929
- DOI: 10.1038/nrm3212
Item in Clipboard
Review
Imaging the coordination of multiple signalling activities in living cells
Nat Rev Mol Cell Biol.
.
Abstract
Cellular signal transduction occurs in complex and redundant interaction networks, which are best understood by simultaneously monitoring the activation dynamics of multiple components. Recent advances in biosensor technology have made it possible to visualize and quantify the activation of multiple network nodes in the same living cell. The precision and scope of this approach has been greatly extended by novel computational approaches (referred to as computational multiplexing) that can reveal relationships between network nodes imaged in separate cells.
Figures
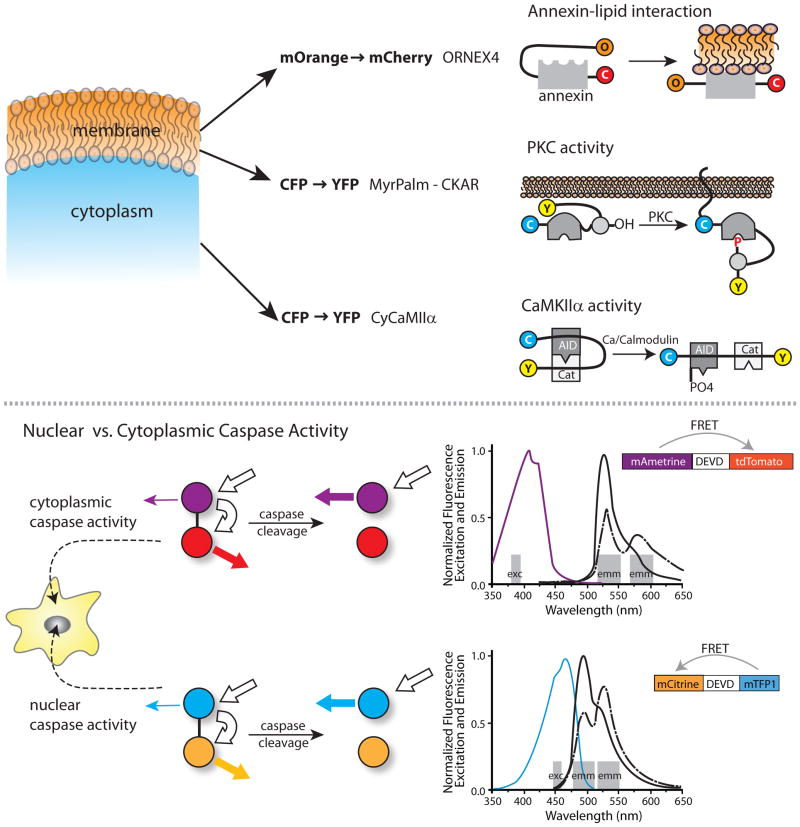
Top) Pilijik and Schultz discriminate signals from three biosensors by using both orthogonal FRET pairs and differences in subcellular localization. They examine the relative kinetics of lipid modification, PCK activity and Cam Kinase IIa activity by using a biosensor with mOrange to mCherry FRET, combined with two biosensors using CFP to YFP FRET. One CFP to YFP biosensor is restricted to the cytosol and the other to the plasma membrane. Bottom) Ai et al. developed a novel fluorescent protein, mAmetrine, with an unusually large Stokes shift. This facilitated separation of wavelengths to image two biosensors independently in the same cell. The Stokes shift enabled fluorophore excitation and monitoring of emission at the orthogonal wavelength bands shown by the grey bars. For each FRET pair a single excitation band is used, leading to emission due to either direct excition of the donor (mAmetrine or mTFP) or FRET emission from the acceptor (mTomato or mTFP). Excitation and emission spectra are shown for the FRET pair in each biosensor, with the color of the excitation spectra corresponding to the donor fluorophores in the biosensors. Bold white arrows show the excitation and FRET of the donor fluorophore, while the colored arrows show the level of emission from the acceptors before and after cleavage. These orthogonal FRET biosensors were used to differentiate caspase activities monitored simultaneously in the nucleus and cytoplasm.
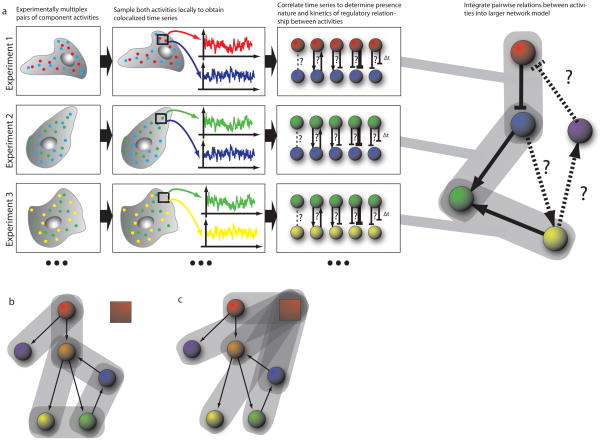
a) In each experiment, a sub-set of the signaling network components (‘nodes’) are experimentally multiplexed (two in the illustrated example). Component activities are sampled locally to extract co-localized time-series for each experimentally multiplexed node, in each region of the cell. The sampling windows are defined in a cell-centered frame of reference (see Fig. 4) in order to generate time series that are independent of the cell-cell to variation in shape. These time series are then analyzed by correlation methods, testing first the presence of an interaction between the activities and then determining the direction and sign (stimulating or inhibiting) as well as the timing of the interaction. This process is repeated for other activity pairs in the network, with each subsequent experiment sharing a common node with any of the previous experiments – that is in this illustration experiments 1 and 2 share observations from the blue node, while experiments 2 and 3 share observations from the green node. Continuing this process allows traversal of the network, without requiring each node to be observed simultaneously. Mathematical tools allow integration of the pairwise and possibly redundant observations into a larger network model. b, c) Two strategies for traversing the network. Experiment establishes pairwise relations bewteen activities throughout the network, b); or each experiment established the relation of one activities relative to a common fiduciary activity, depicted by red box, c).
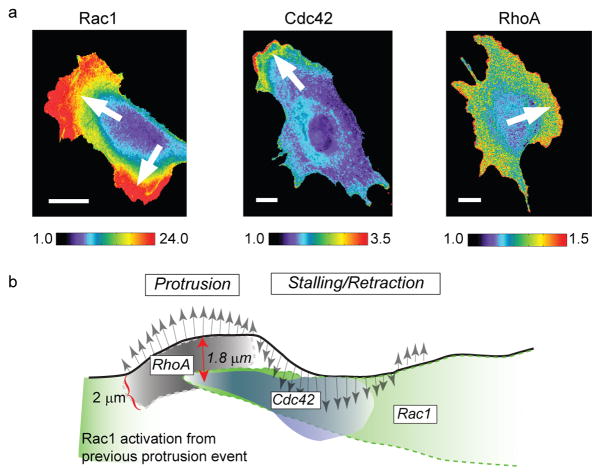
a) Three distinct members of the family of Rho GTPases (Rac1, Cdc42 and RhoA) were imaged in different cells using different biosensors. To monitor Rac1 activation, a bimolecular FRET reporter was used, which produces a high signal when a Rac-binding fragment of the Rac1-effector Pak conjugated to cyPet associates the activated form of Rac1 conjugated to YPet. To monitor Cdc42 activation, an environmentally-sensitive dye, mero87, was coupled to a Cdc42-binding fragment of the Cdc42-effector WASP. Upon association of this labeled fragment with the activated form of Cdc42 the dye undergoes a change in its fluorescence spectrum that is observed as a strong increase in fluorescence at a particular wavelength. To monitor RhoA activation, an intramolecular FRET reporter was used. In contrast to the Rac1 reporter, here RhoA and the RhoA-binding fragment are in a single chain, which undergoes conformational changes upon activation of RhoA. These changes are detected by changes in the FRET intensity between cyPet-/YPet-fluorescent proteins inserted into the single chain sensor. Pseudo-color scales indicate the dynamic range of the biosensor responses (1, no significant response; maximum value, strongest response throughout the time-lapse sequence. Arrows indicate the direction of cell protrusion. b) Cartoon illustrating the spatially and temporally differentiated activation of the three Rho GTPases during protrusion (gray arrows pointing north) and retraction/stalling (gray arrows pointing south) events at the cell edge. The shading in the activation clouds indicates how the signaling strength decreases after initial induction. The relations between the signaling activities were predicted first indirectly by spatiotemporal cross-correlation analysis of each biosensor in a separate cell to the velocity of edge movement as a common fiduciary (strategy Fig. 2c). The inferred relations were then confirmed by direct observation of two of the biosensors (Cdc42 and RhoA) in the same cell (strategy Fig. 2b). Images reproduced from with permission from Nature.
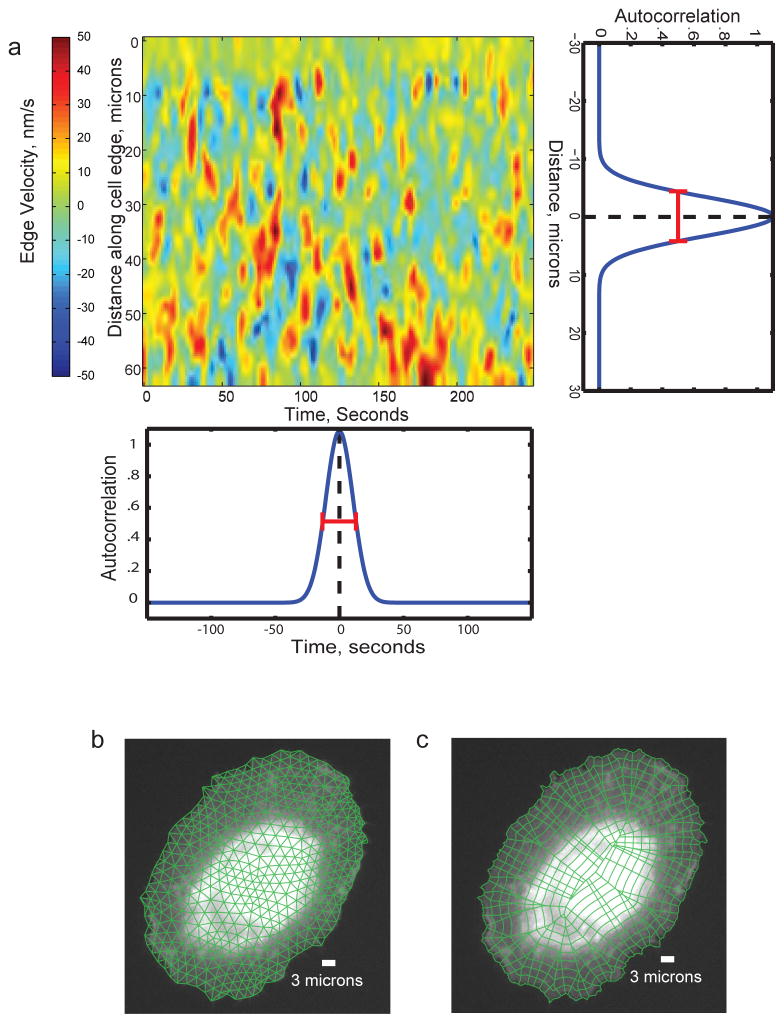
a) Map of the spatial (vertical axis) and temporal (horizontal axis) activity of an experimental fiduciary (here cell edge velocity). The activity map displays typical stochastic oscillations, as seen for many cellular activities. The horizontal autocorrelation of the map indicates the characteristic time scale of the oscillations (~40 s in this example, as deduced from the full width at half maximum (FWHM) of the function, red bar). This time scale defines the requirement for temporal sampling. The vertical autocorrelation of the map indicates the characteristic length scale of the oscillations (~15 μm in this example, as deduced from the FWHM). This length scale defines the requirement for spatial sampling. For both, time and space domain 2 – 4 fold oversampling should be achieved. That is, movies should be acquired at 10 s frame intervals or faster and biosensor intensities should be sampled in probing windows of max. 4 microns side length. b) Definition of a triangular mesh of appropriately-sized probing windows. c) Definition of a polygonal mesh of appropriately-sized probing windows. In contrast to the triangular mesh in b), each window inside the cell perimeter has a unique relation to a window at the cell periphery. Thus, this mode of windowing is preferred for studies that relate intracellular signals to cell protrusion and retraction events.
References
-
- Olsen JV, et al. Global, in vivo, and site-specific phosphorylation dynamics in signaling networks. Cell. 2006;127:635–648. - PubMed
-
- Barrios-Rodiles M, et al. High-throughput mapping of a dynamic signaling network in mammalian cells. Science. 2005;307:1621–1625. - PubMed
-
- Colman-Lerner A, et al. Regulated cell-to-cell variation in a cell-fate decision system. Nature. 2005;437:699–706. - PubMed
Publication types
MeSH terms
Grants and funding
LinkOut - more resources
Full Text Sources
Other Literature Sources
