Comparative Study
. 2011 Dec 9;52(13):9379-90.
doi: 10.1167/iovs.11-8319.

Quantitative measurements of autofluorescence with the scanning laser ophthalmoscope

Affiliations
Comparative Study

Quantitative measurements of autofluorescence with the scanning laser ophthalmoscope

François Delori et al. Invest Ophthalmol Vis Sci. .

Abstract

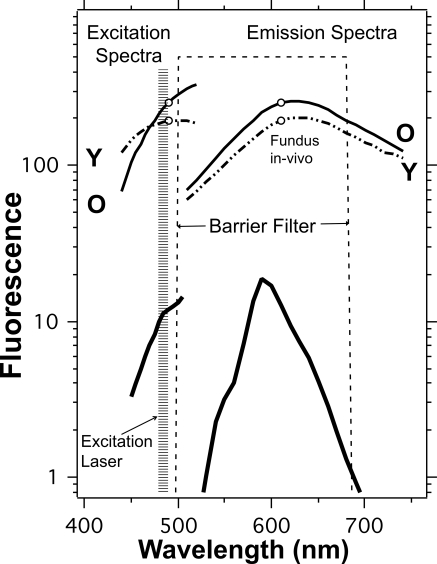
Purpose: To evaluate the feasibility and reliability of a standardized approach for quantitative measurements of fundus autofluorescence (AF) in images obtained with a confocal scanning laser ophthalmoscope (cSLO).

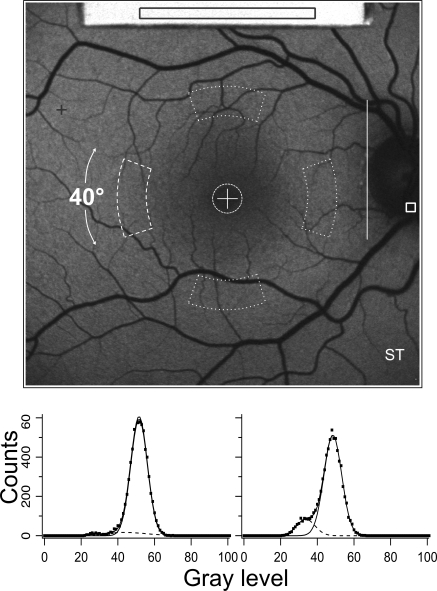
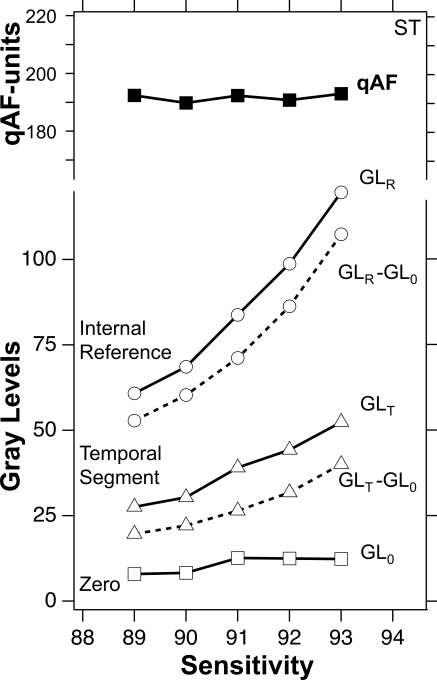
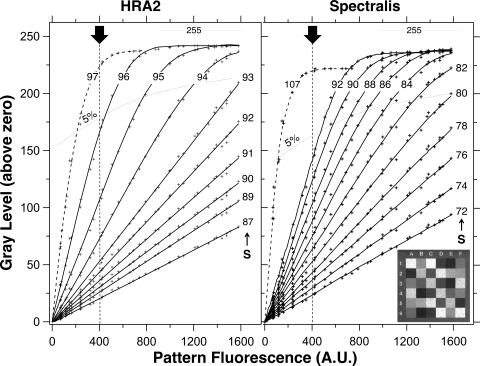
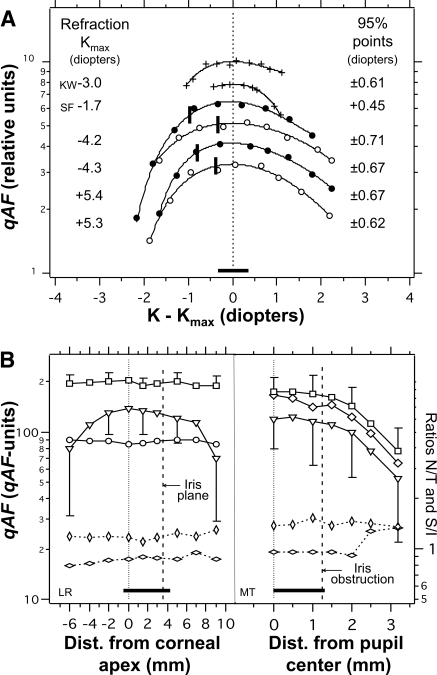
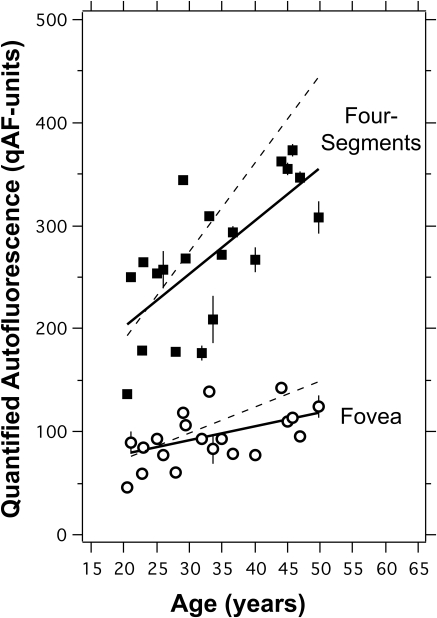
Methods: AF images (30°) were acquired in 34 normal subjects (age range, 20-55 years) with two different cSLOs (488-nm excitation) equipped with an internal fluorescent reference to account for variable laser power and detector sensitivity. The gray levels (GLs) of each image were calibrated to the reference, the zero GL, and the magnification, to give quantified autofluorescence (qAF). Images from subjects and fixed patterns were used to test detector linearity with respect to fluorescence intensity, the stability of qAF with change in detector gain, field uniformity, effect of refractive error, and repeatability.

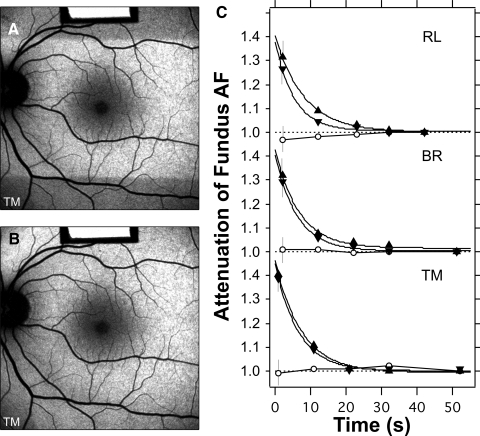
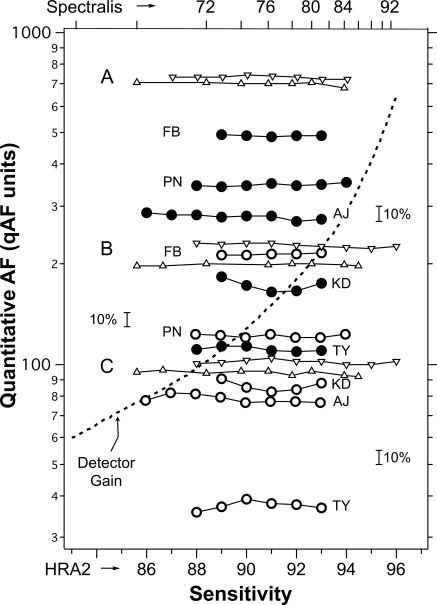
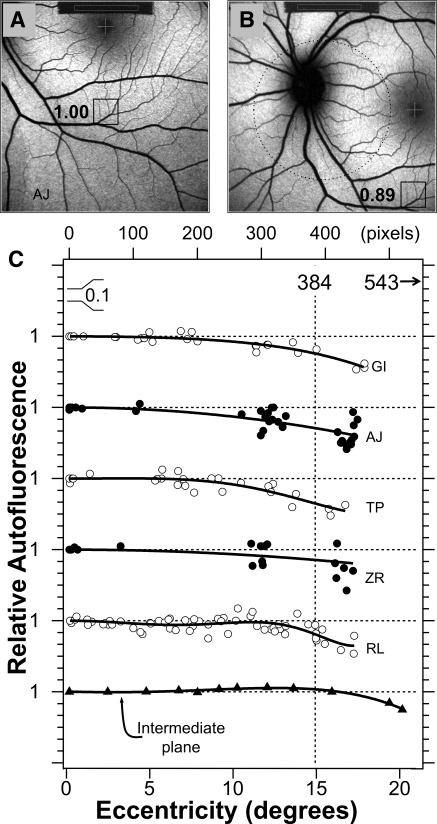
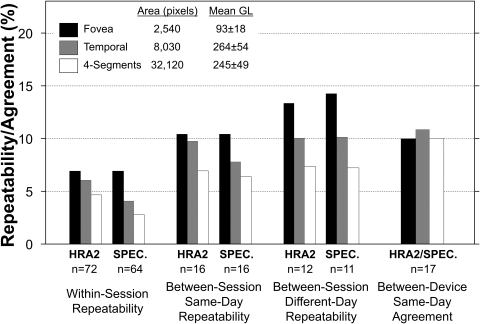
Results: qAF was independent of detector gain and laser power over clinically relevant ranges, provided that detector gain was adjusted to maintain exposures within the linear detection range (GL < 175). Field uniformity was better than 5% in a central 20°-diameter circle but decreased more peripherally. The theoretical inverse square magnification correction was experimentally verified. Photoreceptor bleaching for at least 20 seconds was performed. Repeatability (95% confidence interval) for same day and different-day retests of qAF was ±6% to ±14%. Agreement (95% confidence interval) between the two instruments was <11%.

Conclusions: Quantitative AF imaging appears feasible. It may enhance understanding of retinal degeneration, serve as a diagnostic aid and as a sensitive marker of disease progression, and provide a tool to monitor the effects of therapeutic interventions.


Figures

Figure 1.
Figure 1.
Autofluorescence fundus image from a 28-year-old man showing the internal fluorescence reference (top) that was recorded simultaneously with the fundus image. The average GLR was always measured in the same rectangular area located over each reference. The protocol used for normal subjects consisted of calculating the mean GL in the different areas enclosed by white dashed lines. The analyzer positioned the central cross on the fovea and the vertical line on the temporal neuroretinal edge of the optic disc. The horizontal distance, L, between these landmarks served as a scale for the positions and sizes of all sampling areas; the foveal circle was 0.19 × L in diameter (≈2°), and the inside and outside radii of the four segments were 0.58 × L (≈6.6°) and 0.78 × L (≈8.9°), respectively. The angular width of each segment was 40°. For the emmetropic eye, the sampling areas were 2540 and 8030 pixels, for the fovea and for each segment, respectively. Highest (+) and lowest (square, on the optic disc) GLs were determined outside the contour of the reference. The highest level indicated whether the image GLs were within the range of linearity of the detection system. The lowest level was generally located on the optic disc. The histograms demonstrate how the influence of vessels is minimized: The sum of two Gaussians are fitted to the histogram, allowing the smaller Gaussian to account for the low GLs associated with the vessels while the large Gaussian accounts for the GLs in the fundus background. The center GL of the large Gaussian is then the mean level.
Figure 2.
Figure 2.
Excitation and emission spectra (thick lines, measured by spectrophotometry; MPF-44A; Perkin Elmer, Boston, MA) of the fluorescent material used in the study together with the spectral ranges of the excitation laser and of the barrier filter. Other characteristics of the internal reference are given in Table 1. For comparison, excitation and emission spectra of the fundus are shown for the 20- to 30-year age group (dashed lines, Y) and for the 60- to 70-year age group (solid lines, O). The spectra were measured by fluorometry, with no correction for ocular media losses. The emission spectra between 500 and 535 nm were extrapolated. The excitation spectrum for older individuals is highly attenuated by the ocular media for wavelengths below 500 nm.
Figure 3.
Figure 3.
Gray levels (solid lines) for the temporal segment (▵), the internal reference (○), and the equivalent zero GL0 (□) as a function of sensitivity for images from the subject in Figure 1. qAF (■) was derived from equation 1 by substitution of GLT − GL0 and GLR − GL0 (dashed lines, corrected for GL0), the reference calibration factor RCF = 515 (HRA2, Table 1), and the scaling factor SF = 11.38 μm/pixel for the tested subject. The zero GL0 is shifted electronically to remain at 10 to 14 GLs. Despite an increase in the mean GLs by a factor 2.1, the qAF changed only slightly (coefficient of variation = 3.3%).
Figure 4.
Figure 4.
Zero-corrected gray levels (GLs) versus the fluorescence of a calibrated pattern AFpattern at different sensitivities, S, (as indicated) for the HRA2 and the Spectralis. Inset: an image of the calibrated pattern. Dashed lines: point at which nonlinearity reached 5% at different sensitivities. Pixel-sized flashes of colored light appear slightly below the 5% level. For high exposures, the GLs saturate at a level of 255 − GL0. The range of AFpattern was chosen to correspond roughly with measurements previously obtained by fluorometry: normal subjects (AFpattern = 200–400), patients with AMD (AFpattern = 300–500), Stargardt's disease (AFpattern = 500–1200), and Best disease (AFpattern ≈ 1600).,– Dark arrow: the equivalent exposure for the internal reference currently used in the study. For example and for the HRA2, if we set a lower limit for GL − GL0 to 25 (mainly for contrast), then the reference should be adequate to cover a large range of fundus AF levels ranging from an equivalent of 1600 (using S = 89, GLF − GL0 ≈ 110, and GLR − GL0 ≈ 25 at the limit) to an equivalent of 100 (using S = 96, GLF − GL0 ≈ 25 at the limit, and GLR − GL0 = 165).
Figure 5.
Figure 5.
Bleaching of photoreceptors, using the 488-nm illumination with laser power of 260 μW through the pupil. The test started with a 30-second exposure using the 20° field (images not recorded). The irradiated area was then 20° × 30°, or 0.53 cm2, and the retinal irradiance was 490 μW/cm2. The rods in the 20° high strip were then bleached to 99%; no changes in AF were detected in the subsequent images. (A) A 30° fundus image was taken immediately after the field was switched to 30° × 30° (0.79 cm2).The retinal irradiance was then 330 μW/cm2. The superior and inferior fundus was then roughly dark adapted. Images were recorded after 11, 21, 31, and 51 seconds, to document the effect of bleaching. (B) Image recorded 30 seconds after image (A). No clear differential AF was detected between the areas that were and were not initially bleached. (C) Time course of the attenuation of the AF during bleaching for three subjects (age range, 23–47years). Error bars are SD, calculated from propagation of errors. Measurements were made within the superior (▵) and inferior (▿) dark bands, at the boundary of the dark area (eccentricities, 12°–17°), and in the fovea (○). The AF measured in the bleached zone outside the fovea acted as the reference. The data were fitted by exponential functions. At t = 0 the attenuations ranged from 1.37 to 1.47, corresponding to optical densities of 0.16 to 0.19 DU for the rods (500 nm). The attenuation was reduced to 1.05 (5% absorption) after a bleaching duration of 12 to 17 seconds and to 1.02 (2% absorption) after 17 to 24 seconds. Marginal increases in AF were observed at the fovea for RL and TM (○), perhaps related to regeneration of the photopigment.
Figure 6.
Figure 6.
Relative stability of qAF measurements obtained from images recorded with different sensitivities in five subjects (initials) by the HRA2 (temporal segment, ●; fovea, ○), and for three targets A, B, and C from stationary fluorescent patterns using the HRA2 (▿) and the Spectralis (▵, sensitivity top scale). Some curves were displaced vertically to avoid overlap. Small brackets indicate a change of 10%. If no internal reference were used to obtain qAF, then all data would vary approximately as much as the variation of the detector gain (dashed line). The relationship of the sensitivities of the two devices, implied by the top and bottom axes is valid only for the study cSLOs. The exact relationship could vary from instrument to instrument, particularly at high gain.
Figure 7.
Figure 7.
Testing the uniformity of qAF images. Images for an inferior (A) and nasal (B) fixation. The boxed areas correspond with the same fundus areas (100 × 100 pixels) located at a fixed horizontal and vertical offset from the center of the fovea. The numbers are the ratios of the mean GL in that area to the mean GL in the same area when it is located in the center of the field. Such comparison was repeated 15 to 30 times for different fundus sites and fixation positions. Dotted circle: a 20°-diameter area centered in the field. (C) Relative AF for five subjects as a function of eccentricity. The bottom profile was measured in the intermediate plane of the HRA2 by placing a uniformly fluorescent material in that plane. Profiles were displaced for clarity; each horizontal dashed line corresponds to a ratio of 1 for the profile below it (0.1/division). Vertical dashed line: the eccentricity of 768/2 = 384 pixels (15°) and the corners of the image have an eccentricity of 543 pixels (23°). The smooth lines are sixth-degree polynomials that were fitted through the data (even terms only, offset = 1). The mean relative AFs (±SD) at 10° and 15° eccentricity were 0.95 ± 0.03 and 0.84 ± 0.05, respectively.
Figure 8.
Figure 8.
Repeatability (equation 2) of qAF measurements obtained from two images within a session, from two sessions on the same day (<5 minutes apart), and from two sessions on different days (28–64 days apart), and agreement (equation 2) between qAF measurements on the HRA2 and the Spectralis on the same day. Repeatability was better (smaller) within sessions than between sessions, suggesting that positioning of the subject's eye is a major source of measurement noise. Repeatability had the same pattern for all comparisons, improving with increasing sampling area and increasing fundus AF. The two cSLOs had similar repeatability (no significant differences between ΔqAF distributions, Kolmogorov-Smirnov two-sample; P ≥ 0.08). In one session, three to four images were acquired, separated by blinking and, if necessary, minor realignment of the camera. For between-session and between-instrument comparisons, two images from each session (randomly selected from session images) were averaged to provide the data. Repeatability and agreement computations included corrections for the use of multiple measurements per session. Test–retest measurements were made in 12 subjects, 10 of whom had both eyes tested. As there were no significant correlations between the differences, ΔqAF, obtained from left and right eyes (three comparisons: ρ <0.3; P > 0.26) data for both eyes were used.
Figure 9.
Figure 9.
Variations in qAF resulting from errors in focus and alignment. Horizontal bars: ranges applicable to a skilled operator. (A) Relative qAF versus the difference between the focus K and the focus yielding maximum AF (Kmax) for two subjects (+), with the Spectralis, and for a stationary fluorescent pattern (with resolution target), with the Spectralis (○) and the HRA2 (●). Each curve is normalized to its maximum qAF (0 D). The curves were displaced to avoid overlap. The 95% points indicate the focus change at which qAF decreased to 95% of the maximum. Solid vertical bars: the focus position that yielded maximum sharpness (modulation) of the resolution pattern (10 pixels/line pair). This occurs at a slightly more myopic focus than that which produces maximum AF intensity (which is generally the focus obtained by operators). (B) Left: Changes in qAF with axial distance between the scan pupil (incident laser beam) and the corneal apex (±0.5 mm accuracy). Data are shown for the fovea (○), the mean of the four-segments (□), and the mean of the four corners of the image (▿; 75 × 75 pixels in each corner). (B, right): Changes in qAF with lateral distance between the center of the scan pupil and the center of an 8.5-mm dilated pupil. External fixation was used, resulting in an 8° more nasal fixation. qAF measurements were from the image center at roughly midway between the disc and fovea (◊), from four-segments located at 12° from the image center (□; more eccentric than in Fig. 1: nasal to the disc and temporal to the fovea), and from the image corners (▿). (B, left and right) Bottom plots represent the ratios of qAFs (right) measured in the temporal and nasal segments (T/N, horizontal lozenges) and in the superior and inferior segments (S/I, vertical lozenges). Changes in these ratios reflect changes in uniformity; the axial and lateral displacements did not result in changes larger than 5%.
Figure 10.
Figure 10.
qAF versus age for 20 subjects (age range, 20–50 year, all white) for the average of the four-segments (■) and for the fovea (○). Error bars are ±1 SD. Linear regression lines through the data showed a significant increase in qAF with age. For the four-segments, qAF = 201 + 5.22 × (age-20) (r19 = 0.70; P = 0.0005), and for the fovea, qAF = 76 + 1.35 × (age-20) (r18 = 0.52; P = 0.02). Dashed line: regression lines for the data (symbols omitted for clarity) of the four-segments and foveal sites after accounting for media absorption with the algorithm of van de Kraats and van Norren (Appendix F, Supplementary Material, http://www.iovs.org/lookup/suppl/doi:10.1167/iovs.11-8319/-/DCSupplemental); the rate of increase of qAF with age was then 8.6 and 2.7 qAF units/year for the four-segments and fovea, respectively.

References

    1. Delori FC, Dorey CK, Staurenghi G, Arend O, Goger DG, Weiter JJ. In vivo fluorescence of the ocular fundus exhibits retinal pigment epithelium lipofuscin characteristics. Invest Ophthalmol Vis Sci. 1995;36:718–729 - PubMed
    1. Sparrow JR. Lipofuscin of the retinal pigmented epithelium. In: Holz F, Schmitz-Valckenberg S, Spaide RF, Bird A. eds. Atlas of Fundus Autofluorescence Imaging. Berlin, Heidelberg, New York: Springer; 2007:4–16
    1. Eagle RC, Lucier AC, Bernadino VB, Janoff M. Retinal pigment epithelial abnormalities in fundus flavimaculatus: a light and electron microscopic study. Ophthalmology. 1980;87:1189–1200 - PubMed
    1. Weng J, Mata NL, Azarian SM, Tzekov RT, Birch DG, Travis GH. Insights into the function of rim protein in photoreceptors and etiology of Stargardt's disease from the phenotype in abcr knockout mice. Cell. 1999;98:13–23 - PubMed
    1. Sun H, Nathans J. ABCR, the ATP-binding cassette transporter responsible for Stargardt macular dystrophy, is an efficient target of all-trans-retinal-mediated photooxidative damage in vitro: implications for retinal disease. J Biol Chem. 2001;276:11766–11774 - PubMed

Publication types